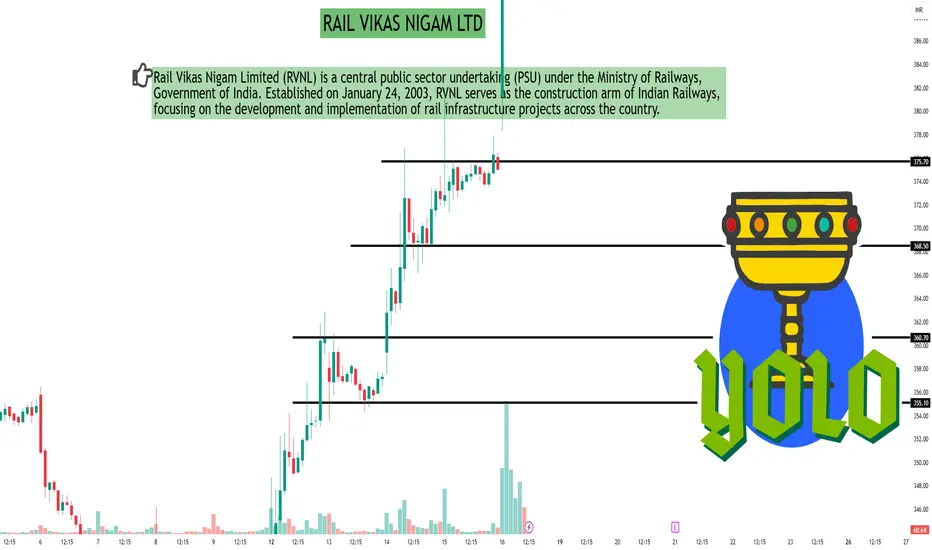
RAIL VIKAS NIGAM LTDAs of May 16, 2025, Rail Vikas Nigam Ltd. (NSE: RVNL) exhibits a bullish trend on the 30-minute timeframe, supported by several technical indicators:
📈 30-Minute Technical Analysis Summary
Current Price: ₹412.45
Relative Strength Index (RSI): 70.92
Indicates overbought conditions, suggesting strong upward momentum.
Moving Average Convergence Divergence (MACD): 2.89
Positive value supports the bullish trend.
Average Directional Index (ADX): 62.56
Reflects a strong trend strength.
Stochastic Oscillator: 78.09
Near overbought territory, indicating strong buying pressure.
Rate of Change (ROC): 0.972
Positive value aligns with upward price movement.
Supertrend: ₹372.14
Below current price, reinforcing the bullish outlook.
Parabolic SAR (PSAR): ₹371.61
Below current price, indicating an uptrend.
Chaikin Money Flow (CMF): 0.216
Positive value suggests buying pressure.
📊 TradingView Technical Summary (30-Minute Timeframe)
On TradingView, the 30-minute technical indicators for RVNL present a Neutral outlook, suggesting a balance between bullish and bearish signals.
⚠️ Trading Considerations
Overbought Indicators:
RSI and Stochastic values suggest the stock is in overbought territory; traders should watch for potential pullbacks.
Support Levels:
Supertrend and PSAR levels around ₹372 may act as support in case of a price correction.
Volume Analysis:
Monitoring volume trends alongside price movements can provide additional insights into the strength of the current trend.
Search in ideas for "INDICATORS"
RUSSIA UKRAIN FALL ACHIEVED Technical Analysis Report: Nifty 50
Prepared by: Sucrit Patil Date: April 8, 2025
Overview: This report analyzes the weekly price movements of the Nifty 50 Index from mid-2021 to early 2025, highlighting significant trends, market events, and future projections. The focus is on two critical periods: the Russia-Ukraine War (2021–2022) and the Results + Global Tariffs (2024–2025).
Key Observations:
Russia-Ukraine War (2021–2022):
Price Movement: The Nifty 50 Index experienced a sharp decline of 3,421.05 points, representing an 18.39% drop.
Volume: A total of 68,421 shares traded, indicating heightened volatility during this geopolitical conflict.
Indicators:
Moving Average (SMA): The index breached its 50-week moving average, signaling bearish sentiment.
RSI: Dropped below 30, suggesting oversold conditions.
Results + Global Tariffs (2024–2025):
Price Movement: The index declined further by 4,835.75 points, an 18.39% drop.
Volume: A surge to 96,715 shares traded, reflecting intensified market reactions to global economic policies and tariff announcements.
Indicators:
Moving Average (SMA): 200-week SMA acted as a resistance level during recovery attempts.
RSI: Currently at 39.30, indicating a shift from oversold to neutral territory.
Conclusion: The Nifty 50 Index remains at a critical juncture influenced by global events. Monitoring support/resistance levels, coupled with technical indicators, will be essential for navigating the current market landscape.
Disclaimer: This report is for educational purposes only and does not constitute investment advice or recommendations. I am not SEBI-registered. Please consult a financial advisor before making any investment decisions.

Open Interest Analysis with Dynamic Threshold Highlights This Open Interest (OI) Analysis indicator is tailored specifically for the Indian markets, providing insights into the NIFTY, Bank NIFTY, and SENSEX indices. By visualizing Open Interest data dynamically, this tool helps traders assess market sentiment and identify key trends or reversals in the Indian stock market. This indicator is ideal for traders and investors looking to leverage OI data to understand institutional behavior, detect potential turning points, and refine entry and exit strategies.
Key Features:
1) Comprehensive Open Interest Display:
Choose between Open Interest, Open Interest Delta (daily change in OI), OI Delta with Relative Volume (OI change adjusted by relative volume), and OI RSI (an RSI-based measure for OI) to customize how you view market sentiment across NIFTY, Bank NIFTY, and SENSEX.
2)Index-Specific Compatibility:
The indicator allows users to view OI data across NIFTY, Bank NIFTY, and SENSEX —India's most actively traded indices. By default, it displays Bank NIFTY , but traders can easily switch between indices to suit their trading focus. This multi-index approach provides a comprehensive picture of the Indian market, allowing users to analyze sector-specific sentiment and track institutional interest.
3) Dynamic Threshold-Based Highlighting:
Highlight Large OI Changes: The indicator visually highlights significant increases and decreases in OI, using fluorescent green for large increases and fluorescent red for large decreases. This makes it easy to identify unusual shifts in Open Interest that may indicate strong buying or selling activity.
Customizable Threshold Multiplier: Users can adjust the sensitivity of these highlights using a multiplier. A higher multiplier filters out smaller fluctuations, focusing only on the most significant changes in OI.
4)Advanced Color and Display Settings:
Customize colors for general uptrends and downtrends, highlight significant moves, and set index or INR as the quote currency. These options make the indicator visually adaptable, allowing users to tailor it to match their preferred chart themes.
5)Technical Analysis Tools:
EMA Smoothing: Smooth out Open Interest data with an Exponential Moving Average (EMA) to reveal longer-term OI trends and filter noise. This is particularly helpful for spotting sustained institutional interest in the market.
RSI on Open Interest: The indicator includes an RSI (Relative Strength Index) option for OI, allowing traders to gauge the momentum of Open Interest. This feature can help identify overbought or oversold conditions specific to Open Interest, providing an additional layer of analysis.
6) Visual Threshold Lines:
Display threshold lines for both positive and negative OI Delta values, acting as benchmarks for evaluating the significance of OI changes. This is particularly helpful for understanding whether OI movements are within a typical range or reflect an extraordinary event.
How to Use:
1)Identify Key Market Sentiment Shifts:
Watch for fluorescent green and red highlights to identify unusual increases or decreases in OI, which can signal strong buying or selling pressure in NIFTY, Bank NIFTY, or SENSEX.
2) Analyze Multiple Indices for Sector-Specific Insights:
Toggle between NIFTY, Bank NIFTY, and SENSEX to track how each segment is performing. Bank NIFTY, for example, may show significant OI increases during periods of heightened activity in the banking sector, while NIFTY or SENSEX may reflect broader market sentiment.
3) Confirm Entry and Exit Points with Technical Indicators:
Use the EMA on OI to observe sustained trends and the OI RSI to validate potential overbought or oversold conditions. Together, these indicators can help traders make more informed decisions about entry and exit points.
Settings Overview:
Display Options: Choose from Open Interest, Open Interest Delta, OI Delta with Relative Volume, or OI RSI for customized analysis.
Data Source Selection: Easily switch between NIFTY, Bank NIFTY, and SENSEX for a comprehensive view of Indian market sentiment.
Threshold Multiplier: Adjust to control the sensitivity of highlights for large OI changes.
Highlight Colors: Set fluorescent colors to emphasize large OI increases and decreases.
Technical Indicators: Enable or disable EMA and RSI options for enhanced trend analysis.
Example Use Cases:
Swing Traders in the Indian market can utilize this indicator to monitor large OI decreases as potential reversal signals, especially on Bank NIFTY.
Intraday Traders can look for significant OI increases highlighted in fluorescent green on the 5-minute or 15-minute timeframe to detect early signs of momentum in either direction.
Index Traders can switch between indices to analyze where institutional interest is most concentrated, helping to track broader market sentiment across NIFTY, Bank NIFTY, and SENSEX.

Stock Study: Manorama Industries (Swing Trade)📊 Stock Overview:
1) Pattern Formation: Manorama Industries has formed a basing continuation pattern on the daily timeframe. This pattern is often a bullish signal, indicating the stock is consolidating before continuing its previous upward trend.
2) Breakout: Recently, the stock gave a breakout from this continuation pattern, confirming the potential for an upward move.
🔍 Historical Performance:
1) The same pattern was observed previously, and the stock delivered 19-20% returns following the breakout.
2) Given the similar technical setup, we expect a similar move in the upcoming weeks.
📈 Technical Indicators:
1) Volume Surge: A breakout accompanied by higher-than-average volume adds confidence to the validity of the move.
2) Momentum Indicators: Keep an eye on momentum indicators such as RSI or MACD to confirm bullish momentum as the stock moves higher.
🔑 Action Plan:
1) Entry: With the breakout confirmed, this stock looks like a good candidate for a swing trade. An entry at the current price levels or slight pullbacks could be considered.
2) Stop-loss: A well-placed stop-loss just below the breakout point or the previous support area will help manage risk.
Target: Based on past performance, we anticipate a potential return of 19-20% in the coming weeks.
🚨 Disclaimer: This analysis is based on historical patterns and technical factors, but always consider market conditions and risk management before entering any trade.

🚀 IRB Breakout Alert: Ready to Surge Above INR 72!Hello TradingView Community,
Get ready for an exciting breakout opportunity in IRB Infrastructure Developers Ltd! With the current stock price at INR 68, IRB is on the brink of a significant breakout above INR 72. Here’s why you should keep this stock on your radar:
🔍 Technical Analysis:
Current Price: INR 68
Breakout Level: INR 72
Volume: Increasing steadily, indicating growing interest and accumulation.
Key Indicators:
RSI (Relative Strength Index): Approaching bullish territory, suggesting momentum buildup.
MACD (Moving Average Convergence Divergence): Positive crossover, signaling potential for upward movement.
Support Levels: Strong support around INR 65, providing a safety net for the current price action.
IRB Breakout Chart
📈 Fundamental Analysis:
IRB Infrastructure Developers Ltd, a key player in the infrastructure sector, shows promising growth indicators:
Revenue Growth: Consistent quarterly revenue growth, driven by robust project execution and new order wins.
Profit Margins: Improved operational efficiency resulting in better profit margins.
Sector Outlook: The infrastructure sector is poised for growth with increased government spending on road and highway projects.
💡 Why This Matters:
Breakout Potential: A breakout above INR 72 could trigger a strong rally, providing lucrative opportunities for traders and investors.
Bullish Sentiment: Technical indicators and increasing volume suggest strong bullish sentiment and potential for substantial gains.
🚀 Conclusion:
IRB is on the verge of a major breakout. With the current price at INR 68 and a breakout level at INR 72, this stock offers a compelling opportunity. Keep an eye on this one!
📢 Call to Action:
Watchlist: Add IRB to your watchlist to catch the breakout.
Discussion: Share your thoughts and analysis in the comments below. Let’s explore this opportunity together!
Disclaimer: This analysis is for informational purposes only and does not constitute investment advice. Trading stocks involves risks, and you should conduct your own research before making any investment decisions.

Bitcoin 4hr analysis 2-6-2021Good morning again ladies and gentlemen and 40k as well! We have broken resistance and things are looking good for BTC at the moment. The bulls have put on a show over night and reminded everyone of us (including me) not to underestimate the bulls. The alt coin market has taken a lot of the recent glory in the crypto market but it looks as if BTC is attempting to take some dominance back. But can it last? Lets take a look at the charts.
First of all I want to point out that we have overcome the bears and broke up from the small bullish triangle overnight. It looks as if we have a confirmation candle that indicates that we have successfully broken the resistance. Former resistance becomes support. Technical Analysis 101. I love passing off little helpful hints in my analysis. Most vets already understand former support becomes resistance and vice versa. Learning how to identify support and resistance and understanding exactly how they work is better than any indicator you can turn on. Keep that in mind when you are looking at a chart. You can have a billion lines on the chart. In the end it looks like a bowl of spaghetti.
I do enjoy keeping a few indicators on the chart such as the 50 MA and the 200 MA and the cloud specifically. Bollinger bands and MACD are also helpful. But I can certainly read a chart without these indicators. But I will say that I can appreciate the usefulness of these indicators and I leave them on to make it even easier on me. Just keep it simple. Decide on a few key indicators and stick with them. Learn them. Understand them. Then check out the lesser used indicators. Maybe you will lay that golden egg.
So here we are back at 40k. I had a feeling we would break up from the right ascending triangle on the chart. We topped out on this triangle 2 times this week. I was hesitant to mention it looked like a double top to me when I saw it recently which led me to believe we may not break up from this. But after waking up this morning I was pleasantly surprised and I will walk my stop loss up to lock in that profit. Easy peasy...
So the next hurdle sits around 42k. That will be the real test. I do like the fact we have started creating higher highs once again. All of the bullish factors I am bringing up certainly gives traders confidence to long this. Especially with the abundance of support below us on multiple time frames. If we do in fact break 42k I think 45k - 50k would be a possibility. But WTFDIK??? Make good choices folks!
TLDR: Bulls are awake early. And they drank some espresso

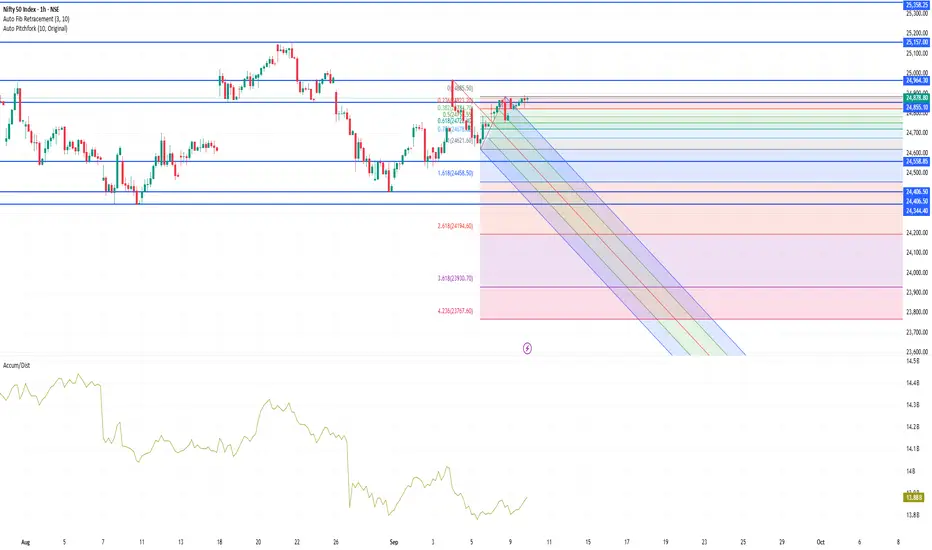
NIFTY50 index levelsKey Levels & Swing Trade Outlook (1-Hour Timeframe)
Resistance & Support (Broader Technical View)
Key Resistance Zones:
24,900–25,000 range (daily level)—a critical breakout area
Slightly higher potential if breakout occurs, toward 25,200+
Immediate Support Zones:
24,750–24,800 level
Broader range support at 24,620–24,700
More defensive base near 24,400 (longer-term)
Intraday Pivot Levels (Based on latest derived pivots)
From Moneycontrol, for the current trading session:
Classic Pivot R1: 24,855 | R2: 24,937 | R3: 24,989
Classic Pivot S1: 24,721 | S2: 24,669 | S3: 24,587
1-Hour Swing Trading Perspective
Although explicit 1-hour pivot data is not readily available, we can infer swing strategies using the broader technical context and typical indicators:
1-Hour Swing Fundamentals:
Use short-term moving averages (e.g., 20/50 EMA) to gauge trend direction. The index is trading above these on shorter timeframes, suggesting intraday bullish bias
Common indicators: RSI, Bollinger Bands, MACD, etc.
Btc long 1H TimeframeKey Observations:
1. Chart Type & Indicators:
• Timeframe: 1 Hour (1H)
• Indicators: EMA 9 (yellow), EMA 20 (blue) for short-term trend tracking.
2. Price Action:
• Current Price: 109,260 USDT
• Recently bounced sharply after a strong dip, showing bullish recovery.
3. Pattern:
• There’s a visible ascending triangle (orange lines), which usually indicates bullish continuation if price breaks upward.
• Price has broken out of the small ascending trendline with momentum.
4. Trade Setup (Long):
• Entry Zone: Around 109,260 USDT
• Target (TP):
• First resistance near 111,998 USDT
• Next major resistance around 113,217–113,431 USDT
• Stop Loss (SL): Around 107,200–107,386 USDT
5. Volume:
• Noticeable increase in buy volume at the breakout, confirming bullish pressure.
⸻
✅ Summary:
This is a long position setup based on breakout from an ascending structure. If BTC holds above the 109,000–108,500 support zone, it has potential to test 112k–113k levels. Stop loss is placed below the recent swing low (~107.2k).

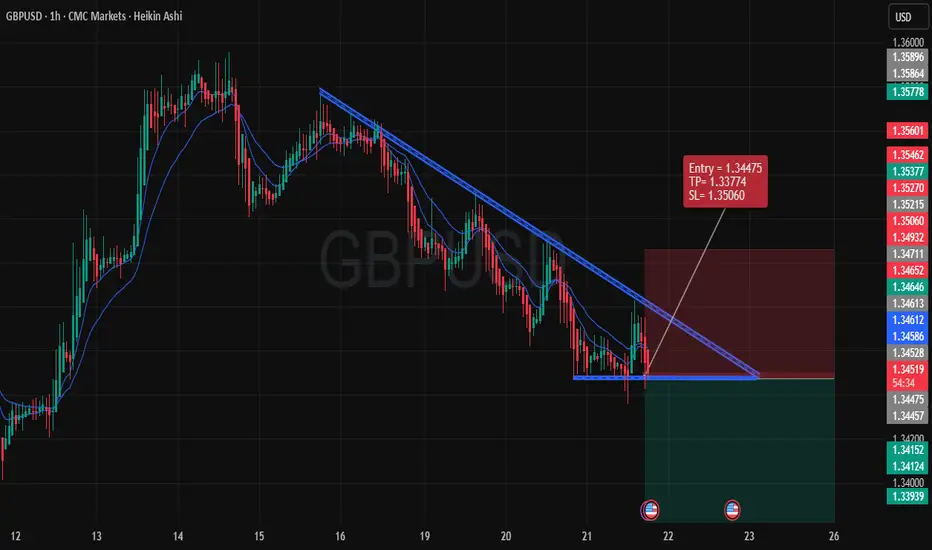
GBP/USD Bearish Trade Idea** IF you like my observation, please boost and follow for more content."
Overview:
The chart displays a clear bearish setup on the 1-hour timeframe for the GBP/USD currency pair. The pair has formed a descending triangle pattern, indicating potential downward price action. The price has been respecting the trendline resistance, which adds confidence to the short trade. Here’s a detailed breakdown of the key elements for this trade:
1. Pattern Formation:
Descending Triangle: A continuation pattern that suggests consolidation and potential breakout to the downside. The price is nearing the apex of the triangle, and we anticipate the breakout to occur below the horizontal support at 1.34495.
2. Entry Point:
The entry is set at 1.34475, just below the critical horizontal support level. This level aligns with the trendline resistance from previous price action, ensuring that we are positioning ourselves at a point where price momentum is likely to shift downward.
3. Stop-Loss (SL):
The stop-loss is placed at 1.35060, just above the trendline resistance. This level is chosen to minimize the risk in case the price fails to break the support and reverses back upward. Keeping the SL tight ensures that the risk is controlled.
4. Take-Profit (TP):
The take-profit level is set at 1.33774, based on the price's potential to reach a key support zone. The target is set at a conservative level, providing a strong risk-to-reward ratio while aligning with previous price action lows.
5. Risk to Reward Ratio:
With a SL of 85 pips and a TP of 705 pips, the trade offers a favorable 1:8.3 Risk to Reward Ratio. This ensures that the reward far outweighs the risk, making it a worthy trade setup for those seeking high probability and high return trades.
6. Technical Indicators:
Trend Indicators: The 9 and 20 EMA lines confirm the bearish trend as the price is trading below these EMAs. The cross of the 9 EMA below the 20 EMA further supports the downside momentum.
Volume: A decrease in volume during the consolidation phase suggests a buildup for a breakout, likely to the downside as indicated by the pattern.
7. Conclusion:
This trade setup provides a logical bearish scenario, supported by strong technical analysis. The entry, SL, and TP are placed strategically based on price action and pattern confirmation. A breakout below the support level at 1.34475 would trigger the short position, aiming for the next significant support at 1.33774.
The risk is well-managed with a tight SL, and the reward is significant, offering an excellent risk-to-reward profile.
Make sure to monitor the breakout closely, as this setup depends on the price respecting the triangle formation.
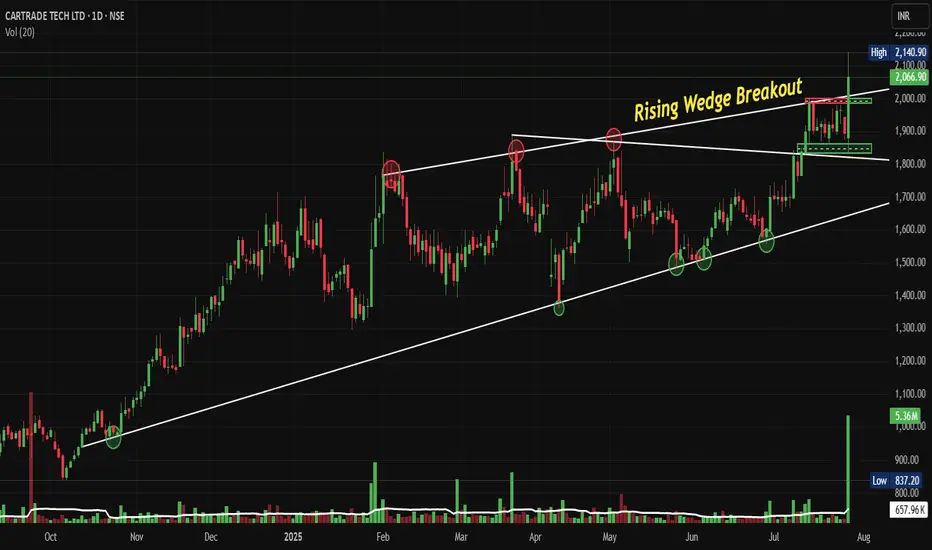
CARTRADE: Breaks Free with Rising Wedge Breakout Post Q1 FY 26NSE:CARTRADE Breaks Free: The Rising Wedge Breakout That's Driving This Auto-Tech Giant to New All-Time Heights with Strong Q1 FY 26
Price Action:
Price Movement and Trend Structure:
• Current Price: ₹2,066.90 (as of July 28, 2025)
• Daily Change: +₹172.20 (+9.09%) - Strong bullish momentum
• Price Range: High ₹2,140.90 | Low ₹2,100.90 | Volume 5.36M shares
• Price Trajectory: Consistent higher highs and higher lows pattern from October 2024
• Recent Action: Sharp acceleration in price movement post-July breakout
• Momentum Character: Strong bullish momentum with gap-up openings and sustained buying
Volume Spread Analysis:
Volume Characteristics:
• Breakout Volume: Exceptional volume spike during the breakout phase (5.36M shares)
• Volume Pattern: Generally increasing volume during upward moves, declining during consolidations
• Average Volume: Approximately 1-2M shares on regular trading days
• Volume Confirmation: The breakout is well-supported by above-average volume, validating the move
Volume Indicators:
• Volume Expansion: 3-4x normal volume during breakout sessions
• Distribution vs Accumulation: Clear accumulation pattern throughout the wedge formation
• Volume-Price Relationship: Positive correlation between volume and price advancement
Chart Patterns:
• Rising Wedge Breakout: The stock has successfully broken out of a long-term rising wedge pattern that was forming since October 2024
• Timeframe: Daily chart showing progression from October 2024 to July 2025
• Breakout Confirmation: Strong breakout above the upper trendline of the wedge with significant volume expansion
• Breakout Level: Approximately ₹1,850-1,900 range
• Pattern Completion: Clean breakout with follow-through buying confirming pattern validity
Key Price Levels:
• All-Time High: ₹2,140.90 (recent high)
• Previous Resistance Zones: ₹1,800, ₹1,900, ₹2,000
• Immediate Support: ₹1,850-1,900 (previous breakout zone)
• Major Support: ₹1,650-1,700 (middle of previous consolidation)
• Long-term Support: ₹1,400-1,450 (bottom of the rising wedge)
Trend Analysis:
• Primary Trend: Strong bullish momentum with consistent higher highs and higher lows
• Secondary Trend: Recently accelerated upward movement post-breakout
• Trend Strength: Multiple touchpoints on both trendlines confirm the validity of the wedge pattern validity
• Momentum: Increasing momentum as evidenced by the steepening price action
Key Support and Resistance Levels:
Key Resistance Levels:
• Immediate Resistance: ₹2,150-2,200 (psychological and technical resistance)
• Next Target: ₹2,300-2,350 (measured move from wedge breakout)
• Long-term Target: ₹2,500+ (extension based on wedge height projection)
Critical Support Levels:
• First Support: ₹1,950-2,000 (recent consolidation zone)
• Strong Support: ₹1,850-1,900 (breakout confirmation level)
• Major Support: ₹1,650-1,700 (50% retracement of recent move)
• Ultimate Support: ₹1,400-1,450 (wedge bottom - unlikely to be tested)
Base Formation:
• Base Pattern: Rising wedge base formed over 9 months (October 2024 to July 2025)
• Base Depth: Approximately ₹1,000 to ₹1,900 range
• Base Quality: High-quality base with multiple retests of support and resistance
• Breakout Strength: Clean breakout with gap-up opening confirming institutional interest
Technical Patterns and Indicators:
Chart Patterns:
• Completed Pattern: Rising Wedge Breakout (Bullish continuation pattern)
• Pattern Reliability: High - well-defined trendlines with multiple touchpoints
• Measured Move Target: ₹2,300-2,400 (based on wedge height projection)
• Time Frame: 9-month pattern completion
Technical Formations:
• Flag and Pennant Potential: Post-breakout consolidation may form continuation patterns
• Gap Analysis: Potential gap fills not immediately concerning given strong fundamentals
• Trend Channel: Stock is establishing a new, steeper upward channel post-breakout
Trade Setup and Strategy:
Entry Levels:
• Aggressive Entry: ₹2,050-2,070 (current market price on dips)
• Conservative Entry: ₹1,950-1,980 (on pullback to breakout zone)
• Momentum Entry: ₹2,100-2,120 (on continuation above resistance)
• Scale-in Strategy: 40% at ₹2,000, 35% at ₹1,950, 25% at ₹1,900
Exit Levels and Targets:
• Target 1: ₹2,200-2,250 (immediate resistance zone) - Book 30% profits
• Target 2: ₹2,350-2,400 (measured move target) - Book 40% profits
• Target 3: ₹2,500-2,600 (extension target) - Book remaining 30%
• Trail Strategy: Trail stop-loss 8-10% below recent swing lows after Target 1
Stop-Loss Strategy:
• Aggressive Stop: ₹1,900-1,920 (below recent support)
• Conservative Stop: ₹1,850-1,870 (below breakout zone)
• Disaster Stop: ₹1,750-1,780 (below major support)
• Risk-Reward Ratio: Minimum 1:2, targeting 1:3 for optimal entries
Position Sizing and Risk Management:
Position Sizing Guidelines:
• Conservative Allocation: 2-3% of portfolio (suitable for risk-averse investors)
• Moderate Allocation: 4-5% of portfolio (balanced approach)
• Aggressive Allocation: 6-8% of portfolio (for high-conviction trades)
• Maximum Position: Not exceeding 10% of the total portfolio, regardless of conviction
Risk Management Rules:
• Single Trade Risk: Maximum 1-2% of portfolio value per trade
• Stop-Loss Discipline: Strict adherence to predetermined stop-loss levels
• Profit Booking Strategy: Systematic profit booking at predetermined targets
• Position Monitoring: Daily review of technical levels and volume patterns
Risk Mitigation Techniques
• Diversification: Avoid overconcentration in a single stock or sector
• Hedging Options: Consider protective puts for large positions
• Correlation Analysis: Monitor correlation with broader auto and tech indices
• News Sensitivity: Be prepared for volatility around earnings and sector news
Sectoral and Fundamental Backdrop:
Industry Landscape:
• Auto Marketplace Growth: India's online auto marketplace is growing at a 27.5% CAGR (2025-2030)
• Digital Transformation: Increasing shift from offline to online vehicle transactions
• Market Leadership: CarTrade Tech is India's leading and only profitable auto marketplace
• Competitive Advantage: Multi-platform presence with CarWale, BikeWale, CarTrade, and OLX India
Business Model Strength:
• Asset-Light Model: Operates 114 auto malls, mostly leased, ensuring capital efficiency
• Revenue Diversification: Multiple revenue streams including listing fees, transaction commissions, and financial services
• Platform Integration: Comprehensive ecosystem covering new cars, used cars, commercial vehicles, and two-wheelers
• Strategic Acquisitions: OLX India acquisition for ₹535.54 crore, strengthening market position
Recent Fundamental Performance:
• Q1 FY26 Results: Revenue of ₹173 crore (22% YoY growth)
• Profit Growth: Net profit doubled year-on-year in Q1 FY26
• Market Capitalization: ₹9,801 crore (up 139% in past year)
• Valuation Metrics: Trading at 4.42 times book value
• EBITDA Performance: EBITDA almost doubled in Q1 FY26
Growth Catalysts:
• Market Expansion: Penetration into tier-2 and tier-3 cities
• Technology Enhancement: AI and ML integration for better user experience
• Financial Services: Growing fintech vertical with loan facilitation
• Electric Vehicle Segment: Positioning for EV marketplace opportunities
• B2B Growth: Expanding dealer and OEM partnerships
Sector Tailwinds:
• Digital Adoption: Accelerated post-pandemic shift to online platforms
• Used Car Market: Growing preference for certified pre-owned vehicles
• Credit Penetration: Increasing vehicle financing accessibility
• Regulatory Support: Government push for digitization and transparency
• Consumer Behaviour: Millennial and Gen-Z preference for online research and transactions
Risk Factors and Considerations:
Technical Risks:
• Overbought Conditions: Stock may be due for consolidation after a sharp run-up
• Gap Risk: Potential for gap-down on negative news or market corrections
• Volume Sustainability: Need for continued high volume to sustain momentum
• Market Correlation: High beta stock susceptible to broader market volatility
Fundamental Risks:
• Economic Slowdown: Auto sales sensitivity to economic cycles
• Competition Intensification: New entrants and existing players' aggressive strategies
• Regulatory Changes: Potential policy changes affecting online marketplaces
• Technology Disruption: Emergence of new technologies or business models
Market Risks:
• Sector Rotation: Shift in investor preference away from auto-tech stocks
• Liquidity Concerns: Mid-cap stock with potential liquidity constraints during market stress
• Earnings Expectations: High growth expectations leading to volatility on any disappointment
• Valuation Concerns: Premium valuations make stock sensitive to market sentiment changes
My Take and Investment Thesis:
NSE:CARTRADE presents a compelling technical setup with a successful rising wedge breakout supported by strong volume and robust fundamental performance. The stock has established itself as a leader in India's growing auto marketplace sector with a diversified business model and strong growth trajectory.
The technical breakout, combined with excellent Q1 FY26 results showing doubled profits and 22% revenue growth, creates a favourable risk-reward scenario for investors. However, given the stock's significant run-up (146% in 11 months), careful position sizing and strict risk management are essential.
The investment thesis is supported by both technical momentum and fundamental strength, making it suitable for investors seeking exposure to India's digital transformation in the automotive sector. The key to success will be disciplined execution of the outlined entry, exit, and risk management strategies while monitoring both technical levels and fundamental developments closely.
Keep in the Watchlist and DOYR.
NO RECO. For Buy/Sell.
📌Thank you for exploring my idea! I hope you found it valuable.
🙏FOLLOW for more
👍BOOST if you found it useful.
✍️COMMENT below with your views.
Meanwhile, check out my other stock ideas on the right side until this trade is activated. I would love your feedback.
Disclaimer: "I am not a SEBI REGISTERED RESEARCH ANALYST AND INVESTMENT ADVISER."
This analysis is intended solely for informational and educational purposes and should not be interpreted as financial advice. It is advisable to consult a qualified financial advisor or conduct thorough research before making investment decisions.
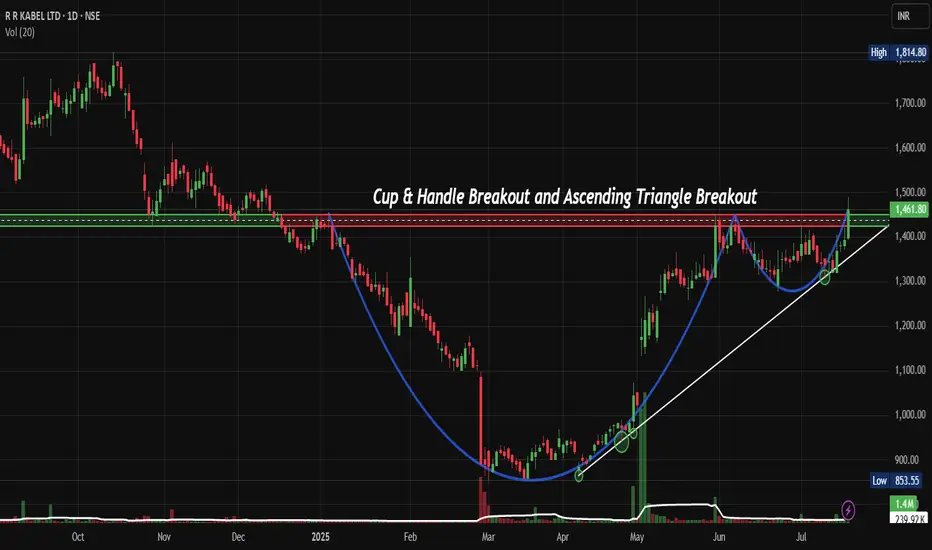
RRKABEL: Cup & Handle Pattern Could Trigger 30% Upside RallyNSE:RRKABEL Perfect Storm: How Cup & Handle Pattern Could Trigger 30% Upside Rally
Price Action Analysis:
Candlestick Patterns:
- Doji Formation: Multiple doji candles during handle formation indicate indecision and potential reversal
- Bullish Engulfing: Strong bullish engulfing pattern on breakout day, showing buying pressure
- Higher Highs/Lows: Clear pattern of higher highs and higher lows post-breakout
- Rejection Candles: Long lower wicks during handle formation show buying support
Price Structure:
- Swing: Clear swing low at ₹853 (March 2025) and swing high at ₹1,850 (previous year)
- Impulse Waves: Strong impulsive moves during the breakout phase indicate institutional participation
- Corrective Waves: Orderly corrective structure during cup and handle formation
- Price Momentum: Accelerating price momentum post-breakout with minimal pullbacks
Market Structure:
- Trend: Transition from downtrend to sideways consolidation to uptrend
- Support Respect: Multiple tests of support levels without breakdown showing strength
- Resistance Breaks: Clean break above multiple resistance levels with conviction
- Price Velocity: Increasing price velocity on breakout indicates strong momentum
Intraday Price Action:
- Opening Gaps: Positive opening gaps during the breakout phase show overnight interest
- Closing Strength: Consistent closing in the upper portion of the daily range
- Pullback Behaviour: Shallow pullbacks with quick recoveries indicate a strong underlying bid
- Volume-Price Sync: Price advances accompanied by volume expansion
Volume Spread Analysis:
Volume Patterns:
- Base Formation: Declining volume during cup formation indicates a lack of selling pressure
- Handle Volume: Minimal volume during handle formation, showing controlled supply
- Breakout Volume: Significant volume spike on breakout confirming institutional participation
- Volume Trend: Above-average volume sustaining post-breakout
Volume Indicators:
- Accumulation Phase: Volume patterns suggest institutional accumulation during the base
- Breakout Confirmation: 2-3x average volume on breakout day
- Follow-through: Consistent volume support in subsequent sessions
- Volume Price Analysis: Positive volume-price correlation during upward movement
Technical Patterns:
Primary Pattern: Cup & Handle Formation
- Cup Formation: The stock formed a classical cup pattern from Jan 2025 to March 2025, with the left rim at approximately ₹1,420 levels
- Handle Formation: A clean handle pattern developed from May to July 2025, showing controlled consolidation with diminishing volume
- Breakout Confirmation: Strong breakout above ₹1,420 resistance with increased volume, signalling pattern completion
- Pattern Reliability: The 6-month cup formation provides a strong technical foundation for sustained upward momentum
Secondary Pattern: Ascending Triangle
- Formation Period: June to July 2025 within the handle structure
- Resistance Level: Horizontal resistance at ₹1,420 tested multiple times
- Support Trend: Rising support line indicating accumulation phase
- Breakout: Clean breakout above triangle resistance with volume expansion
Support & Resistance Levels:
Key Support Levels:
- Immediate Support: ₹1,350 (breakout pullback level)
- Secondary Support: ₹1,280 (handle low)
- Major Support: ₹1,200 (psychological level and previous resistance)
- Critical Support: ₹1,080 (cup base level)
Key Resistance Levels:
- Immediate Resistance: ₹1,500 (psychological level)
- Target Resistance: ₹1,650 (cup depth projection)
- Extended Target: ₹1,800 (previous swing high)
- Long-term Resistance: ₹1,850 (52-week high)
Base Analysis:
Base Characteristics:
- Base Type: Cup with handle base formation
- Duration: 7 months (Jan 2025 to July 2025)
- Depth: Approximately 35% correction from highs
- Volume Pattern: Declining volume during base formation, expanding on breakout
- Base Quality: High-quality base with proper structure and time frame
Base Strength Indicators:
- Volatility Contraction: Price volatility decreased during handle formation
- Volume Dry-up: Minimal selling pressure during consolidation
- Support Holding: Multiple tests of support levels without breakdown
- Institutional Activity: Likely accumulation phase based on volume patterns
Trade Setup:
Entry Strategy:
- Primary Entry: ₹1,420-1,430 (on breakout confirmation)
- Secondary Entry: ₹1,380-1,400 (on pullback to breakout level)
- Aggressive Entry: ₹1,350-1,360 (deeper pullback support)
Entry Confirmation Signals:
- Volume Expansion: Minimum 1.5x average volume on entry
- Price Action: Close above ₹1,420 for two consecutive sessions
- Momentum: RSI above 50 and trending upward
- Moving Averages: Price above 20 and 50-day moving averages
Exit Levels:
Profit Targets:
- Target 1: ₹1,500 (5.5% upside) - Psychological resistance
- Target 2: ₹1,650 (16% upside) - Cup depth projection
- Target 3: ₹1,800 (27% upside) - Previous swing high
- Extended Target: ₹1,850 (30% upside) - 52-week high
Exit Strategy:
- Partial Profit: Book 25% at Target 1
- Scale Out: 50% at Target 2
- Trailing Stop: Implement 8-10% trailing stop after Target 2
- Final Exit: Complete exit at Target 3 or on stop-loss trigger
Stop-Loss Strategy:
Stop-Loss Levels:
- Conservative: ₹1,320 (7% below entry)
- Moderate: ₹1,280 (10% below entry)
- Aggressive: ₹1,250 (12% below entry)
Stop-Loss Management:
- Initial Stop: Below handle low at ₹1,280
- Trailing Stop: Move to breakeven after 5% profit
- Progressive Stops: Raise stops with each target achievement
- Time Stop: Exit if no progress within 4-6 weeks
Position Sizing:
Risk-Based Sizing:
- Conservative Approach: 1-2% of portfolio risk
- Moderate Approach: 2-3% of portfolio risk
- Aggressive Approach: 3-5% of portfolio risk
Position Calculation:
- Risk Per Share: Entry price minus stop-loss level
- Position Size: (Portfolio Risk Amount) / (Risk Per Share)
- Example: For ₹1,400 entry with ₹1,280 stop, risk = ₹120 per share
- Capital Allocation: Maximum 5-8% of total portfolio in a single position
Risk Management:
Risk Control Measures:
- Position Sizing: Limit individual position to 5% of portfolio
- Stop-Loss Discipline: Strict adherence to predetermined stop levels
- Diversification: Maintain exposure across multiple sectors
- Correlation Risk: Avoid concentration in similar cable stocks
Risk Monitoring:
- Daily Monitoring: Track volume, price action, and sector performance
- Weekly Review: Assess progress toward targets and adjust stops
- News Monitoring: Stay updated on company and sector developments
- Market Correlation: Monitor broader market conditions
Sectoral Backdrop:
Indian Cable Industry Outlook:
- Market Growth: The market is projected to grow from USD 10.01 billion in 2025 to USD 17.08 billion by 2032, exhibiting a CAGR of 7.94% during the forecast period
- Infrastructure Push: India's National Grid capacity is expanding continuously under the PM Gati Shakti National Master Plan, which is expected to add around 26,988 circuit km capacity by 2024-2025
- Renewable Energy: India has observed a substantial rise in the demand for wires and cables due to the country's ambitious renewable energy goals
Growth Drivers:
- Smart Cities: The development of smart cities in the country, along with the increase in electronic devices in the household, would increase the demand
- Government Investment: India Wires and Cables Market would grow on the back of rapidly growing investment by the government towards the development of infrastructural projects
- Electrification: Growing electricity demand is driving transmission and distribution network expansion
Fundamental Backdrop:
Company Profile:
- Market Position: RR Kabel is now the 4th largest W&C Company in India by value.
- Global Presence: With a global presence spanning over 67 countries, this electrical company has established a strong international footprint
- Financial Performance: Revenue: 7,618 Cr · Profit: 312 Cr
Financial Metrics:
- Market Cap: Mkt Cap: 16,529 Crore (down -17.5% in 1 year)
- Valuation: Stock is trading at 7.68 times its book value
- Promoter Holding: Promoter Holding: 61.8%
- 52-Week Range: The 52-week high is ₹1825 and the 52-week low is ₹750
Investment Considerations:
- Sector Tailwinds: Strong sectoral growth prospects with government infrastructure push
- Market Leadership: Established position as the 4th largest cable company in India
- International Exposure: Diversified revenue streams from 67 countries
- Valuation Concerns: Recent 22.8% decline in market cap may indicate value opportunity
My Take:
The technical setup for NSE:RRKABEL presents a compelling opportunity with the successful completion of a cup and handle pattern. The 8-month base formation, combined with strong sectoral tailwinds and the company's market leadership position, creates a favourable risk-reward scenario. The breakout above ₹1,420 with volume confirmation suggests institutional participation and potential for sustained upward momentum toward the ₹1,650-1,800 target range.
Key success factors include strict adherence to stop-loss levels, proper position sizing, and monitoring of broader market conditions. The sectoral growth prospects, driven by infrastructure development and renewable energy initiatives, provide fundamental support for the technical breakout.
Keep in the Watchlist and DOYR.
NO RECO. For Buy/Sell.
📌Thank you for exploring my idea! I hope you found it valuable.
🙏FOLLOW for more
👍BOOST if you found it useful.
✍️COMMENT below with your views.
Meanwhile, check out my other stock ideas on the right side until this trade is activated. I would love your feedback.
Disclaimer: "I am not a SEBI REGISTERED RESEARCH ANALYST AND INVESTMENT ADVISER."
This analysis is intended solely for informational and educational purposes and should not be interpreted as financial advice. It is advisable to consult a qualified financial advisor or conduct thorough research before making investment decisions.
NTPC - long for 20 % NTPC chart (as of July 12, 2025) shows strong bullish technical signals, suggesting potential upside momentum. Here's a breakdown of the bullish indicators:
🔍 1. Cup and Handle Formation
Pattern: A classic bullish continuation pattern.
Interpretation: Price formed a rounded bottom (cup), followed by a consolidation dip (handle), signaling accumulation before a breakout.
Breakout Zone: Around ₹371.70 — once breached with volume, it typically leads to a strong upward move.
📈 2. Price Breakout with EMA Confluence
Trendline Break: The downtrend resistance line has been decisively broken.
EMA Crossover: Price is crossing the 18-day EMA and 50-day EMA together — a rare and significant convergence.
Implication: Indicates a shift from consolidation to possible trend reversal or breakout.
📊 3. MACD Turning Positive
MACD (12,26,9): Histogram flipped positive, and the MACD line is above the signal line — a common buy signal.
MACD (3,6,9) & (50,100): Short and long-term MACDs also trending upward — reinforcing momentum across timeframes.
💪 Additional Strength
Volume Spike: Recent volume bars are elevated, confirming buying interest behind the breakout.
RSI (14): At ~58, RSI is neutral-positive — with enough headroom before overbought levels (>70), allowing room for price expansion.
🟢 Conclusion: Bullish Setup
This setup exhibits a strong confluence of technical indicators:
Classical breakout pattern (cup & handle)
EMA/trendline alignment
MACD confirmation
Volume support

A Classic Case of Accumulation Turning into Momentum📈 SUPREME INDUSTRIES LTD – TECHNICAL ANALYSIS
📆 Date: May 27, 2025
🔍 Timeframe: Daily
Price Action:
Supreme Industries surged over 4% today and delivered a clean breakout after forming a consolidation triangle. The strong bullish candle closed near the day’s high with significant volume, confirming momentum on the upside.
Chart Pattern / Candlestick Pattern:
Symmetrical Triangle Breakout
Pullback Entry Zone Tested
Breakout Candle – wide range, strong body
Volume Surge – institutional interest visible
Technical Indicators:
RSI (Daily): 77 – strong bullish zone
MACD: Bullish crossover active
Stochastic: 98 – overbought but confirming strength
CCI: Above 200 – high momentum phase
Volume: 791.75K – supportive of breakout
Support & Resistance Levels:
Immediate Resistance: 4277.93
Next Resistance: 4355.47
Major Resistance: 4490.43
Immediate Support: 4065.43
Secondary Support: 3930.47
Major Support: 3852.93
Possible Fresh Demand Zone: 3837.60 – 3750.90
Chart Overview:
This visual clearly shows:
🔸 The symmetrical triangle pattern
🔸 Breakout + retest zone
🔸 Marked fresh demand zone for potential pullback opportunity
Educational Breakdown:
This setup combines:
Price Action: Triangle + Breakout
Volume Confirmation: Institutional participation
Momentum Indicators: Strong alignment
Demand Zone Mapping: Pre-breakout base
This is a classic trend continuation setup with clearly defined zones of interest. Risk control is key as price enters overbought territory.
Over the past few months, Supreme Industries displayed classic signs of an accumulation zone — a period marked by sideways movement, controlled volatility, and relatively stable volumes. This range-bound behavior typically indicates that long-term investors are quietly building positions while retail participation remains low. Recently, a strong bullish move supported by a significant rise in volume suggests the stock may have exited accumulation and entered the mark-up phase. This phase is often characterized by increased demand, higher price swings, and a clear shift in sentiment from neutral to bullish. The sharp breakout from the range, along with volume confirmation, signals the possible beginning of a new directional trend — where price tends to move swiftly as broader market participants join in.
How to Trade Supreme Industries (for learning purpose):
Entry Example: 4220.50
Stop Loss: 3781.50 (Risk: 439.00)
Target Example: 4659.50 (Reward: 439)
Sample Quantity: 50 shares
RR Ratio: ~1:1/1:2 etc.
Aggressive Traders: May consider riding the trend with trailing stop
Conservative Traders: Can wait for a pullback into the fresh demand zone (3837.60–3750.90)
⚠️ Risk Management Tip: Always trade with a clearly defined stop loss. Avoid entering positions impulsively. It is advisable to start with a smaller quantity and increase your exposure only if the price action confirms the continuation of the trend. Capital protection should always be the priority.
📢 Disclaimer
This content is created purely for educational and informational purposes. It is not intended as investment advice, stock recommendations, or trading tips. Trading and investing in the stock market involves risk. Please consult with a SEBI-registered financial advisor before making any investment decisions. The author/creator is not registered with SEBI and shall not be held responsible for any losses incurred based on this information. Always do your own research and use proper risk management.
👉 If you found this analysis helpful, don’t forget to Follow, so you never miss out on a trade-worthy setup, breakout opportunity, or valuable educational insight again. Stay updated and trade smarter! 💡📈

Nifty and Bank nifty View for 20.05.2025DATED 20.05.2025 ***Good morning ***
🔹 Nifty – CMP: 24,945 (Spot Level)
Indicators: PCR: 0.61 | RSI: 63 bullish
Resistance: 25,280
Support: 24,830-772
Bank Nifty – CMP: 55,420 (Spot Level)
Indicators: PCR: 0.87 | RSI: 61
Resistance: 55,703, 56,106
Support: 54,444
📉 Nifty Outlook:
Nifty crossed major resistance 24830 now next 25280 soon.
📉 Bank Nifty Outlook: Bank Nifty is currently forming a Flag and Pole pattern, indicating a potential continuation of the prior trend. We are closely monitoring for a breakout from this formation.
Key Levels to Watch:
Buy on Dips: 54,444 – 53,800 (support zone)
Breakout Confirmation: Above 55,503

"Bharat Dynamics in High Gear: A Bullish Outlook"Weekly Analysis
>>>Price Movement: The stock closed at ₹1,507.00, up by 6.61% for the week.
>>>Indicators: The 20-day Exponential Moving Average (EMA) is at ₹1,264.23, showing a bullish trend. The Stochastic Oscillator is at 99.73, indicating an overbought condition.
Daily Analysis
>>>Price Movement: The stock showed strong momentum, closing at ₹1,507.00.
>>>Indicators: The daily Stochastic Oscillator is also at 99.73, suggesting the stock is overbought. The Relative Strength Index (RSI) is neutral, indicating a balanced trend.

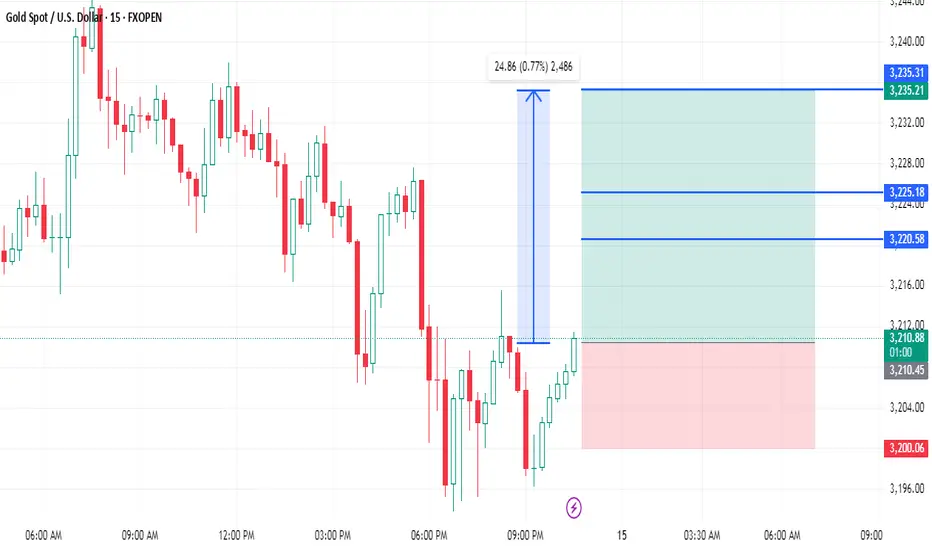
XAUUSD 3210.50 TO 3235 CHANCE 25 POINTSXAUUSD strong zone buy above only 3210.50
There is no resistance upto +
Buy above 3210.50
Stoploss.............3200.....10.50
Target1...............3220.....9.50 points
Target2................3225.....14.50 points
Target3..............3235....25 points
Disclaimer - this level only for education purpose only
BTCUSD READY TO FLY 3500 POINTS..CHECK IT WORLD CLASS ACCURACY??BTCUSD strong zone above only 85550
there is no resistance upto 89000..3500++ point
wait for active mode
Buy above 85550
Stoploss.............84600......950 points
Target1.............87000........1500 points
Target2.............89000++......3500 points
Disclaimer - This level only for education purpose . Do ur own analysis
Magic Indicator - private only script ( any one want 1 week demo for dm me in tradingview. Sent ur username )

XAUUSD INTRADAY TARGET 22 POINTS...3032 TO 3054+XAUUSD strong zone above 3032
There is no resistance upto 3048....16 points
wait for active zone
Buy above 3032
Stoploss..........3024....8 points
Target1..............3038...6 points
Target2...............3048...16 points
Target3...Risk..........22 points
Disclaimer - This level only for education purpose and papertrade purpose only. Do ur own analysis

XAUUSD 18 points up NEXT ALL TIME HIGH 3170++XAUUSD strong above 3152.30
There is no resistance upto 3170++
wait for active zone
Buy above 3152.30
Stoploss...........3144.70.....7.60 points
Target1...........3158....6 points
Target2............3160...8 points
Target3............3168...16 points
Target4 Risk.......3170...18 points
Final expect 3178 to 3185 only maximum
I suggest buy above only mode 3152.30
below this levels downtrends
Disclaimer - This level only for educational purpose and papertrade . Do ur own analysis

XAUUSD 1% FALL CHANCE 38 + POINTSXAUUSD weak below only 3116.50
There is no suport 3116.50 to 3078
wait for active zone
Sell below only 3116.50
Stoploss...............3126...10.50 points
Target1................3108....8 points
Target2................3093....23.50 points
Target3...Risk.........3078....38.50 points
1 % fall chance
Disclaimer - This level only for educational purpose only. Do or own analysis.

XAUUSD 23 POINTS FALL SHARF FALL BELOW 3113.30...UPTO 3090XAUUSD weak below zone 3113.30
There is no suport upto 3090
wait for active mode
Sell below only 3113.30
Stoploss 3021......8 points
Target1.....3109........4.30 points
Target2.....3100........13.30 points
Target3......3090.........23++ points
Disclaimer - This level only my view and education purpose only. Do ur own analysis

BTCUSD READY TO FLY 1400 POINTS ..ONESIDE UP CHANCE Btcusd strong zone above 82400
strong above 82400 there is no resistance upto 83800
wait for active mode
Buy above 82400
Stoploss.......81950....450 points
Target1........83000....600 points
Target2........83800.....1400 points
Disclaimer- This level only for educational purpose only . Do ur own analysis

XAUUSD 20 PTS SHARP FALL SURE BELOW 3113.50XAUUSD weak below 3113.50
sharp fall will chance upto 3093.....20 points
weak zone there is no suport zone below 3113.50 letsee
wait for active zone
Sell below...................3113.50
Stoploss.....................3121....7.50 points
Target1.........3109.50.....4points
Target2.........3100.........13.50 points
Target3..........3093........20+ points
Disclaimer- This level only for education purpose . Do ur own analysis
