Search in ideas for "MACD"

Buy at CMP, MACD crossover, T1-1650, T2-1740, SL AT LAST SWING.Buy for short term at CMP, MACD crossover, T1-1650, T2-1740, SL AT LAST SWING.

Buy at CMP for short term , MACD crossover. Target 5500Buy at CMP for short term , MACD crossover. Target 5500

Tata elxsiWelll as we can see from the daily chart if it break the resistance and I think it will ,as from the macd histogram and rsi it's quite indicative it will

BULLISH PRICE RSI + MACD DIVERGENCE ON BABAAfter weeks of bashing, this stock seems to be finally moving towards its bottom. There are various indicators that points that BABA has bottomed out.
1. RSI - PRICE DIVERGENCE on Daily chart. Both RSI & MACD have improved while the price has been on a Downward trajectory.
2. PUT CALL Ratio changing its complexion from completely bearish to less bearish on Monthly options.
3. The stock is sitting at 61% Fib retracement.
4. Inverted hammer on weekly candle (though this is a red candle but still it can be looked as a reversal candle if next candle breaks the high of previous week)
5. 30 & 60 Min RSIs bouncing off from low 20s again and again.
6. Too many CPR gaps to be filled in the range of 155 - 167
If this gap up in next trading session. Just go long blindly.

IPCA LAB - MACD trigger and also Trendline breakoutIPCA LAB - MACD trigger and also Trendline breakout

TATA Invest - MACD trigger. Major trend also supportingTATA Invest - MACD trigger
Major trend also supporting
Suggestions welcome

AU Small finance bank - MACD + Cup and HandleAU Small finance bank - MACD + Cup and Handle
Suggestions welcome


TATA ELXSI : Upmove expectedThe MACD is indicating an upward movement along with gradual increase in RSI.....Upward movement can be seen in 1-2 days.

CoalIndia- divergences in Price action and MACD lines.Divergences are caused when the price action deflects in different direction than the direction it should be moving in. Monthly charts are the best and one of the most reliable chart system to know the direction of the herd psychology. monthly charts shows that the price action is bearish while the MACD lines are saying the complete different story. Divergence doesn't allows means that there is going to be a reversal but there are other factors to that we have to consider while trading in any script. MA's (11 and 22) distance has already narrowed and about to cross which is going to confirm the big move before the sentiments changes for this script. You need to wait and have this script under your observation so you don't miss out on big move because this script has been in the bearish traps from past two years.
More details will be updated.

Potential Breakout and MACD DivergenceVET seems strong to finally break out of the channel for next leg up. The RSI and MACD also validates the se up and with a little increase in volume, it can easily do 10% from here. However if it falls from the trendline then it will touch the channel bottom and try again. They had some good news as well today, and so my bet is on VET. Lemme know what you think in the comments.


pidilite like asian paint looking positive rsi,macd,moving averapidilite like asian paint looking positive rsi,macd,moving average all bullish signal

Bharti Airtel looks good on Chart,RSI & MACDRSI started moving up from the lowest point, MACD line starting to cross signal line. Taking support from an important support level. Good time to start...

Support at 50, Confirmation of MACD awaited for a rally upBreakout is confirmed and retesting which acts as support. Waiting for MACD confirmation to enter.
Disclaimer: For educational purpose only but not a recommendation.


raduco khaitan Buy according to macdthe macd line will cross soon the signal line so you should buy it

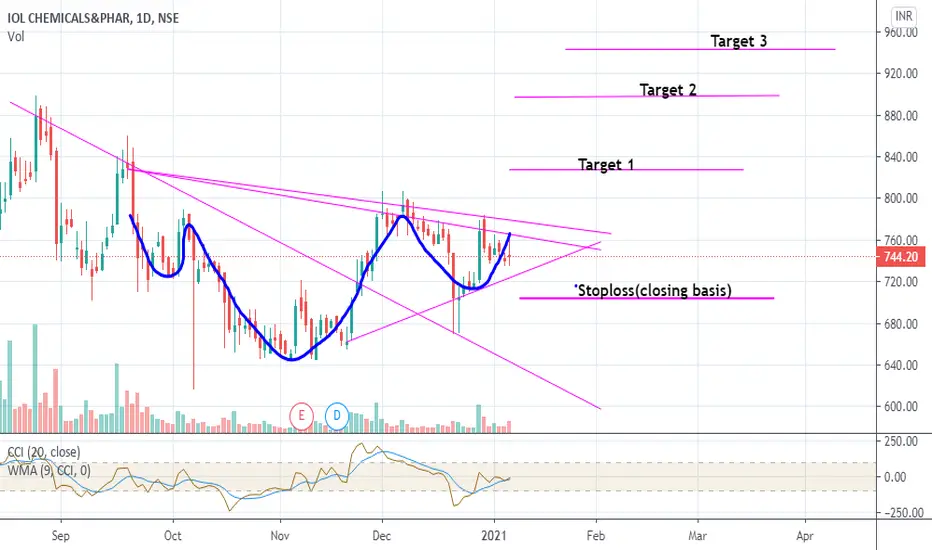
IOLCP: Short& Mid term view BullishRef chart. MACD crossover may happen on upcoming days in daily chart. This will trigger to price shoot-up. In daily chart Indicators are turning bullish from bearish . In monthly chart indicators are continuing the bullish momentum last few months. From this level it may move the further upside. Targets are given by using patterns.
****Note: If you noticed my earlier views, most of the views given before breakouts by using indicators. Risk takers no issues but Safe traders can take the trade after breakout.
Vijayaraghavn.K
Kovilpatti.
NTPC Long - Anticipating MACD + UptrendAnother long trade based purely on the trend and the anticipation of a MACD cross. I do not use stop losses but you can set one for yourself based on the information on the chart. Most of the long trades are likely to be correlated to the broader markets, so any change in the index is likely to influence the price action. We seem to be in an extended bull market, but it can only go on for so long. Regardless, my previous trades on similar technical analysis seem to work out, so here is another one. I am not an expert or a financial analyst of any kind, so do your own due diligence.


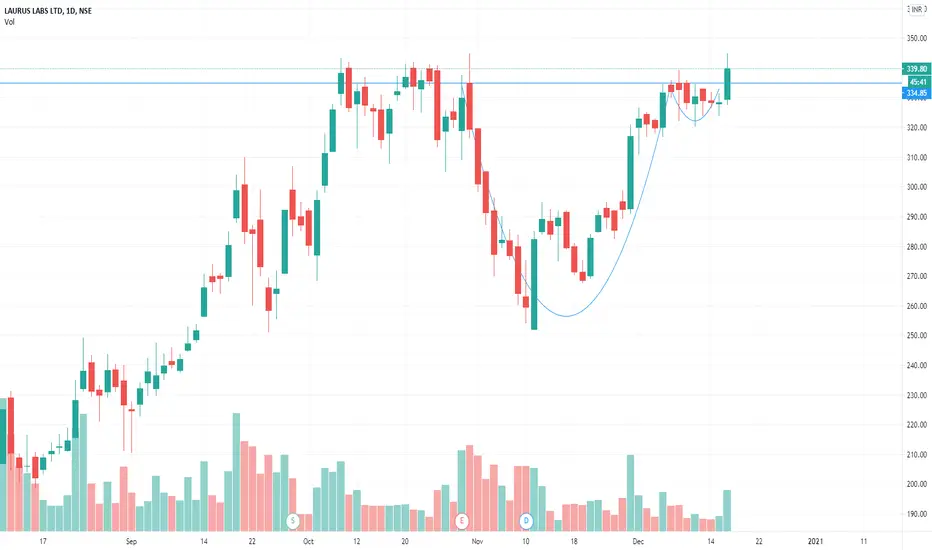
lauras lab cup & handle with macd breakover with big bullish canafter long time in sideways.
macd cross over+rsi is showing 60 above+ big bulosh candle with decent volume..
SIRCA LONG MACD CROSSOVERSirca Looks Good for LONG as per MACD crossover also Stoploss and Target Levels Marked
