National Aluminum Short term view- Bullish Weekly and daily MACD crossover helps to move further upside upto the given target levls. CCI,Stoch and RSI also favorable to move upside. As per indicators view, expecting to move upside for short term only.
Vijayaraghavn,
Chennai
Search in ideas for "MACD"


Bata India: Has the trend bent?The stock was into dominant trend up, last few months the stock hasn’t displayed any zeal to move up. Now at a high intensity resistance level, the price consolidated and formed a negative candle pattern. The RSI is into neutral zones creating bearish signs. Macd is into bearish zone. The stock is expected to correct to 1620-1540 levels where it may find support. Above 1735 the bearish analysis is negated.

Bullish MACD Crossover- Positional LongBullish MACD Crossover expected with one more green candle on chart + RSI also supporting the positional Long. For education purposes only.

Long - TL support , divergence, MACD turns positiveLong - TL support , divergence, MACD turns positive

IMTL Dbl Bottom and MACD "Buy Signal" on Huge VolumeIMTL shares are sitting right in the sweet spot in a MACD bullish divergence setup. Volume has been off the charts in recent action as the company hits the wires with a series of very significant announcements, including truly explosive growth in image uploads and submissions for its Fotofy.com in-image ad network segment.
Ultimately, this is a nascent growth story with some strong accomplishments in play since the Fotofy launch in August:
- Launched digital analytics dashboard for image owners to track use and sharing
- Installed and deployed top-down central analytics facility for management of network
- Negotiated back-end ad placement with top digital ad firm
- Finished development work on proprietary programmatic ad exchange
The data on image submissions, uploads, and image sharing demonstrate extremely robust and accelerating growth:
- Sep month/month growth in images submitted onto the Fotofy platform: 200%
- Oct month/month growth in images submitted onto the Fotofy platform: 3,840%
Management also notes that the Company has set two primary near-term goals: 1. Upload the first one million images to Fotofy, and 2. Generate a run rate of over one million sharing events per month. Once those goals have been achieved, the Fotofy Ad Network will become a significant factor in driving near-term revenue growth.

Bajfin- RSI- support and resistance with parallel channel -MACDBajfin- RSI- support and resistance with parallel channel -MACD

M&M- RSI- support and resistance with parallel channel -MACDM&M- RSI- support and resistance with parallel channel -MACD

Bullish crossover generated in MACD Showing strength in price in MACD by generated bullish crossover. Probability for new life time high in KOTAKBANK

When Price action Confuse ? Go with MACD This one is amazing confusion created in price action patterns , and any one can be fooled with this kind of large % move by price , but if you know how to look it , then you will know what is going to happen next ,
I made an small efforts of placing an abc corrective label on MACD as they are very clear , but in price pattern its very messy , Look for weekly strong close before you make a decision or daily strong close above this last Friday close and run this ride ,
those who are getting knowledge you can stay continued to tune with my posts , i see few individuals having an issue with my egoistic boosted updates you have clear message , " either you earn like me and create your own personality or Un-follow me and stop getting abused by my boosting updates its better for you also Mr Bloomberg Executive , stop following me

Nifty : Sell MACDNifty is looking short as MACD has turned below zero line. Moving averages are above candlestick. Long term support line could be tested before the next upmove. 10900 & 11000 call can be sold keeping 10840 as stop loss for position. Target would be 10540- 10410-10340. 10700-10750 would be the resistance zone to create position. People may play for H&S and might get trapped in next selling. 10300 is unlikely to get breached in next few trading sessions.

Bajaj Auto Short term view-BullishBreakout happen already. MACD Crossover may happen on coming days. These will help to achieve target Pls refer chart..
Vijayaraghavan.K,
Kovilpatti.

KSCL - SHOWING BULLISH SIGNS - MACD DIVERGENCEKSCL - SHOWING BULLISH SIGNS
KSCL HAS SHOWN A STRONG BULLISH REVERSAL SIGN WITH THE MACD DIVERGENCE AS INDICATED IN THE CHART
USUALLY DIVERGENCES PLAY A CRUCIAL PART IN THE TREND REVERSAL AS THEIR ACCURACY IS 9/10.
THIS CAN BE A SHORT TERM RALLY, ENTER ONCE THE PRICE CLOSES ABOVE THE 20 DEMA LINE.
HAVE A TARGET OF 40-50 POINTS

DIVIS LAB MACD CROSS OVER DIVIS LAB
MACD CROSS OVER FOR BUY SIDE
BUY AT 1094.95
TGT 1. 1114
TGT 2. 1124
TGT 3. 1138
SL 1082

ACEL- long position- cloud breakout and MACD crossover with volACEL cloud breakout with MACD crossover and jump in volumes.
Long position with open target in long term uptrend

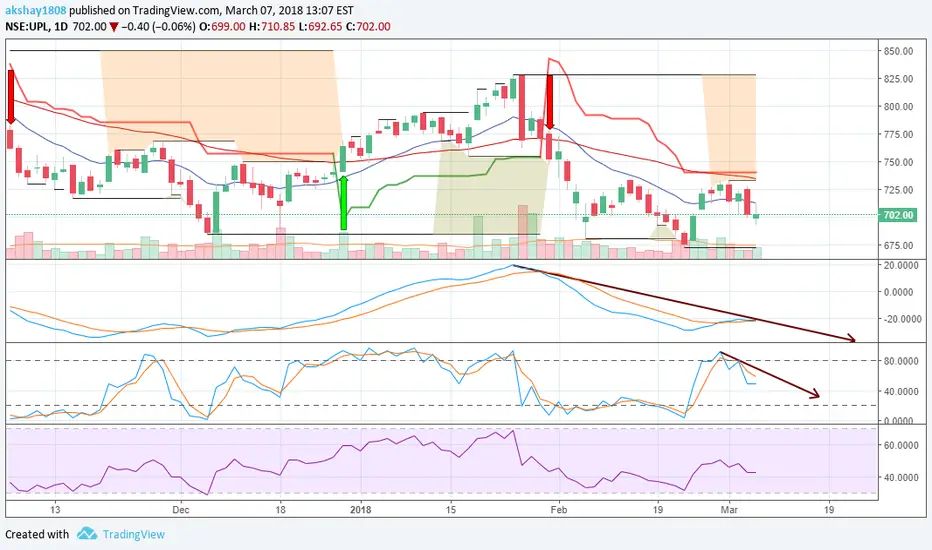
Short UPL as per MACD & Stochastic signalsNSE:UPL is one of those stocks where it seems bearish phase is yet not stopped. Fresh signal are given by MACD crossover as well Stochastic crossovers. Interestingly both are also giving bearish divergences (observe down arrow) which confirms our short selling call. Short Sell in range of 700-705. Targets will be 693(T1), 680(T2), 672(T3). A stop loss of 709 is highly recommended.
PCJEWELLER MACD CROSSOVERPcjewellers is expected to move upwards due to MACD crossover indication on charts
Buy PCJEWELLERS at 333
Stoploss 310
Target 355-365
Enjoy! Happy Trading

Lupin shows a clear divergence in MACD oscillatorLupin shows a clear divergence in MACD oscillator. One can wait for a confirmation when 3 period EMA crosses 20 period EMA to go long

Bullish engulfing with MACD crossoverBPCL made bullish engulfing with good volume and MACD crossover on 30th Jan
SL 470
Target 535

ITC - MACD Divergence + BB SqueezeITC is poised for strong either way move, considering MACD divergence & BB squeeze, it is likely to move upward.
Above 270, it is expected to reach 290.

GBPUSD- MACD BUY ON 4 HOUR CHART. HEADING TOWARD 1.32/33 ZONEBullish MACD crossover on 4 hr chart supported by moving average crossovers.