BTST TRADE IN MANAPPURAM FIN JUL FUTMANAPPURAM JUL FUTURES
BUY@166.5
STOP@162.5
TARGET@170.5
QTY=6000
Search in ideas for "MANA"

intraday trade in mananpurram finintraday trade in mananpurram fin
buy@127
stop@125
target@131
qty=5000(cash)

MOMENTUM TRADE IN MANAPPURAM FIN JUL FUTMOMENTUM TRADE IN MANAPPURAM FIN FUTURES
BUY@178.25
STOP@176
TARGET@180.75
QTY=6000

BULLISH ENGULFING IN MANAPPURAM FIN BTST TRADE IN MANAPPURAM FIN
BUY@157.75
STOP@154
TARGET-1@162
TARGET-2@166

STBT TRADE IN MANAPPURAM FINANCE !!(FUT)!!STBT IN MANAPPURAM FINANCE
VIEW
:-DARK CLOUD COVER
:-RSI OB ZONE
:-PROFIT TAKING ON THE CARDS
TRADE IN 28TH NOV FUTURE CONTRACT
SHORT @171.5
STOP @173.5
TARGET @168.25
LOT:6000
QTY:1

INTRA-DAY SHORT TRADE IN MANAPPURAM FIN !!(FUT)!!INTRA-DAY SHORT IN MANAPPURAM FIN
VIEW:-RSI REVERSAL SPIKE
BEARISH CANDLE
TRADE IN NOV FUT
SHORT@168.25
STOP@170.75
TARGET@165.75
LOT:6000
QTY:1

MANALI PETROCHEMS LTDMANALI GIVEN BREAKOUT AND ALSO TRADING AT LIFE TIME HIGH SO GOOD TO PICK FOR 2-3 MONTHS STOCK MAY DOUBLE IN 2-3 MONTH USE STOP LOSS AT 30 TARGET 80-100-120


MANAPPURAMMANAPPURAM:- Ascending triangle pattern is formed, breakout is found and if it comes out above 132 then you can plan something, till then keep your eye on the stock.
Hello traders,
As always, simple and neat charts so everyone can understand and not make it too complicated.
rest details mentioned in the chart.
will be posting more such ideas like this. Until that, like share and follow :)
check my other ideas to get to know about all the successful trades based on price action.
Thanks,
Ajay.
keep learning and keep earning.

MANAPPURAMMANAPPURAM trading very close to weekly support trend line after showing poor results this quarter. As per technicals we can see a bounce back from this trend line support and the three upside targets as per fibonnaci retracement levels. Note : for educational purpose only.

ManappuramManappuram have completed cup & handle patterns and drifting towards its first target (179)

MANA token in descending triangle consolidation.Mana token that is built on Ethereum coin is a currency of Decentraland.
It gained a reputation last year after the launch of the metaverse to the public domain and gave a nice return of about 600-700% in just few months.
Though, after the initial hype the token lost its gains and travelled back to its inital price.
The token started trading below its weekly 20 ema in the First week of April 2021 and is still trading below it.
Even on the smaller time frame (daily), MANA is struggling to convincingly trade over its 20 DMA and is now forming a desending triangle formation.
Its trading around its 20 DMA and have lost around 85-90% of its value from ATH.
If the global markets regain their bullish moment the token can also give a nice targets.
On the 4-hour chart analysis the token is taking a support around 0.681 USDT levels.
Support:- 0.681, 0.629
Resistance :- 0.720, 0.730
The token has been in the down trend for so long and bullish move is expected in it.
Wait for the token to breakout of the consolidation range and a price action near the levels for creating an intraday or swing trade.

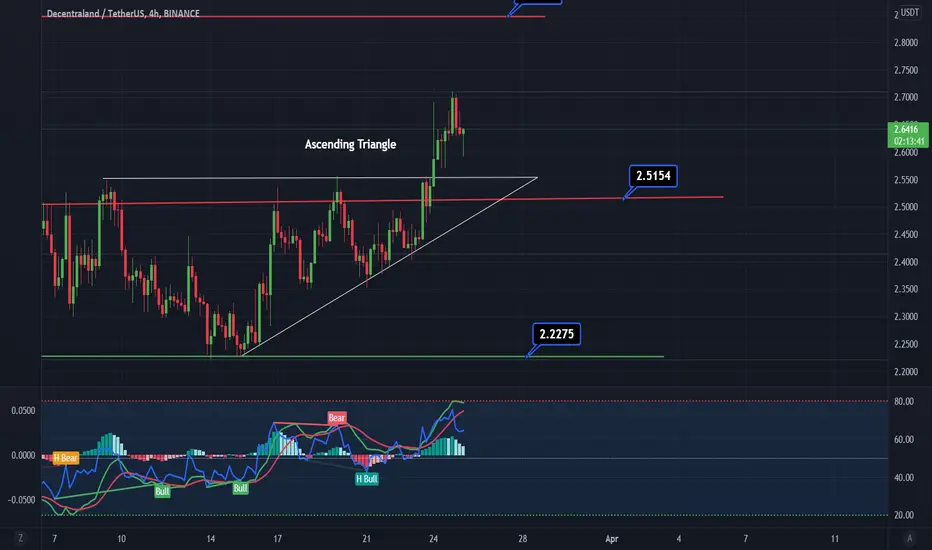
#Mana scalpzone & triangle breakout 4hr TF sup. & resis.#MANA finally broke out of the triangle & resistance line and currently, retesting back. The support around, $2.51 is the good area for buy setups. #BTC also looking bullish but at the resistance, so use proper stoploss with and risk management as well.
MANA Signal#MANABTC
Buy: 1000-1155
Target: 1234-1373-1475-1585-1691-1807-hodl
SL: 889
Risk/Reward: 10% / 80%

MANAUSDT LEVELS 08.12.2024MANAUSDT Trading in sideways market from 2022,once it's breaks 0.836 at monthly levels, will expect to reach previous high.
RISK REWARD IS GOOD
(DYOR)

Mana coin-Downside flag breakoutMana coin is making a flag pattern in 4h timeframe.The flag once broke out earlier,now it is retesting from the trendline and can fall downside to the next support.If high volume bear candles form on the chart,then a short trade can be initiated downside.Supports are marked there on the chart.

Mana scalpzone 4 hr TF with supp & resisMANA is testing the support of the $1.252 area and needs to hold above this level. There is a downtrend line which works as a resistance level. A break above $1.80 is considered bullish and we see a rally towards the $2.20-$2.40 area. You can add some MANA near the support level with a tight stop loss of below the $1.25 level.

#Mana scalping zone 4 hr TF with sup. & resis#Mana scalping zone 4 hr TF with sup. & resis, there's is #ascending triangle channel pattern which is bullish and shows bullish intent. Currently, price reached a good flip area around $2.55 - $2.56. Overall, rejection is expected, if price break this resistance. Better wait for a breakout of the resistance line or a proper dip to any strong support.

MANA Breakout MANA/USDT forming a breakout pattern on technical charts.
after the recent correction, we can see some momentum and growth.
