Simple Trade Setup | ITC | 09-05-2022 [INTRADAY]NSE:ITC
Observations:
1) On 1hr time frame, we can see it gave breakout of triangle pattern.
Please refer below chart : 1hr time frame.
2) On 1 day time frame, we can see it gave closing above the critical level of 265
Please refer below chart : 1day time frame.
-------------------------------------
Trade Setup for 09-05-2022
1) Don't Jump in to trade at the beginning of the market. Let it get settle for 15-20min first and judge the price action.
2) Everything is mentioned on the chart. I hope it is easy to understand.
3) All the levels will work as support, resistance, entry and exit w.r.t price action near that level.
4) Avoid gap up or gap down chase. Wait and trade between levels.
Please refer below chart for levels.
Hope I made it easy to understand it.
Do comment your doubt or suggestion.
Note: Trade with Strict SL. It may or may not hit all the levels. So one can book profit / loss at respective level considering how price action works near that level.
Search in ideas for "Nse:itc"

ITCNSE:ITC is a very cash rich company
after a long consolidation today it closes above 240 levels.
so, as per our analysis it's making inverted head and shoulder kind pattern
so, we can take a swing trade on this for the targets of 265

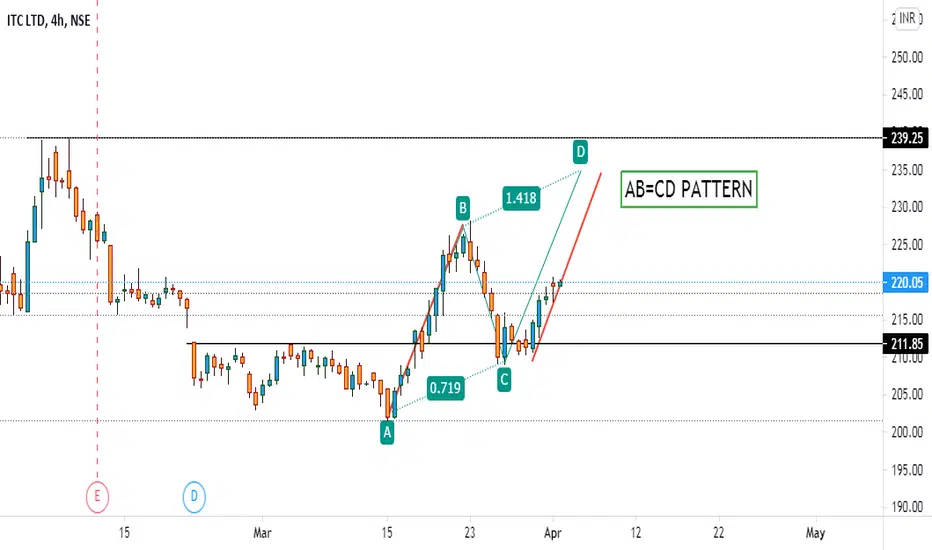
#ITC at resistance now NSE:ITC
After giving great up move now stock at resistance.
First given good long from harmonic level now find the opportunity for short or profit booking at harmonic resistance.
📌 To Trade on This Chart, You Should Have Reversal Trading Knowledge. As Harmonic is One Of The Best Reversal Trading Strategy, But Always Remember That Harmonic Patterns Also Can Fail (there is no holly grail In Stock Market). That's Why One Should Must Have Knowledge Of Reversal Trading To Trade On Harmonic Patterns.
📌 That Dash Line Is Called PRZ, From That Dash Line To that Horizontal Simple Line Area Is Whole PRZ(Price Reversal Zone).
******whatever charts or levels sharing here or on any other platforms are just for educational purpose only, Not A Recommendation To Buy Or Sell. Please do your own analysis before taking any trade on them. We are not SEBI registered.

ITC DOUBLE BOTTOM AND DESCENDING TRIANGLE BREAKOUT - BULLISHNSE:ITC HAS SHOWN A AMAZING BULLISH BREAKOUT AFTER REACTING POSITIVELY TO THREE MAJOR BULLISH REASONS
1. Took support at 32 years old trendline
2. Made double bottom pattern and respected the support zone.
3. Breakout from descending triangle pattern.
YOU CAN ADD THIS FOR TARGE OF 250-260 WITH SL OF 208 FOR MEDIUM TERM, THIS IS ALSO A GREAT PICK FOR SAFE INVESTORS IT ALSO ENTERTAIN WITH AMAZING DIVIDEND EVERY YEAR
LIKE | SHARE | COMMENT

itc buyNSE:ITC
its price channel pattern and given breakout with good volume and crossing rsi 60 gives good hope for long
Note: I'm not a Sebi registered guy, Consult ur analyst before investing

Doji forms in resistance zone: ITCDoji forms in resistance zone: ITC
Detailed analysis given on the chart
NSE:ITC

ITCNSE:ITC
*Not a financial advise just a prediction not responsible for loss.
ITC giving a triangle breakout by a new in a bullish channel followed by a bearish channel.
#TA

Buying opportunity in ITCGood buying opportunity in NSE:ITC .
1. MACD crossover to go up.
2. FMCG sector showing bullish momentum.
3. Showing above average volume.
4. Inflation rate has increased in October.
ENTRY : Buy above 242
SL : 230 (Closing basis)
TARGET : 250/265/280/300
NOTE :This post is just for educational purpose. Do consult with your financial advisor before taking any trade.
Thank you.

ITC: Breakout NSE:ITC
Levels mentioned in Chart.
Note: Not a SEBI Registered analyst.
Trade at your own discretion.

ITC 4HOUR CHART ANALYSNSE:ITC
Hi helo vanakam.....
In this post, I would analysis ITC company in India stock market....
Market will small corrective in4 hour chart now a time.
I plotted a 2Torget in 📊chart...
So wait for correction after go to entry peoples
Important notice:
This is only education purpose
Not for decision taking,
Trading or investment is your own decision with your own risk....

ITC near imp resistance NSE:ITC
make new entry only above 242 closing
SL closing below 222
T 248, 255, 266
280 will be next major hurdle

ITC Head & ShoulderNSE:ITC
ITC looks Head and Shoulder pattern
Support levels 201-203
Resistance 209-211


ITC Ltd Long @ Rs 214 or belowNSE:ITC
Entry 214 or Below
Target 258
SL 195
Time: 3-4 Week
ITC is trading in a zone for the last 8 months now it looks Bullish , It has strong support at 200. The supply zone is at 223-229 which is tested so looks week and can be broken by a strong upside movement. if the supply zone is broken successfully then it can reach to 258 targets. Buy and hold for the 3-4 weeks.
Disclaimer: the author may enter in trade, take your own decision , This is a trading idea, not a trading or investment advice

ITC channel pattern BO, educational purpose onlyITC looks good to have given a breakout from channel in 1h frame, retest also done , can test levels of 210,220. Give a like if you agree. :) NSE:ITC

ITC here again at Daily Support. Go long on May FuturesIt is time again that we are hitting most of the checkboxes pretty much decently well. Nifty is showing signs of strength while trapping the innocent retails. FMCG and IT are my go sectors right now, and if I am talking about FMCG, I should mention NSE:ITC
The stock is at the daily support. The NIFTYFMCG index is around the trendline support too. When the markets are weak, FMCG is a safe sector. One can definitely long ITC for smaller to larger targets mentioned on the charts with the SLs mentioned on the charts too.
Be smart in your level selections. If you are going for 205.25 SL, make sure your Targets are reasonable too. Always trail SL to previous-2 target and go along for a target of 225, and then 240 in the short term.
1. Buy March Fut
2. SL as per your risk appetite. Best SL at 199.5, and Targets are 215 and 225 and 240 for me.
3. Don't fall into the trap of expected market fall. If you are an investor, stay away. If you are a trader, you shouldn't care about the news or sentiments. Take traders that have a great RR.
Disclaimer: I am not responsible for your profit/loss here and this is just for educational use only.


ITC still trading within range
ITC trading in range.
216 is the support.
Resistance 1 is 218 .
resistance 2 is 220 .
NSE:ITC
ITC 1D TIMEFRAME WAITING FOR BREAKOUTITC SEEMS TO BE FORMING ANOTHER CHANNEL PATTERN IN 1HR
IF IT BREAKS THE DIAGONAL LINE WITH VOLUME IT WILL GO UP BY 17% MINIMUM AS PER MY ANALYSIS
ANY SUGGESTIONS ARE WELCOME. NSE:ITC

ITC | Wait for the support from current level218.5 - 222 was big resistance which had been broken on 04-feb, if it takes support from the same current level then one can long on it. 264 is easy target and can get more in positional. NSE:ITC

ITC's new target is 260 +Please check the levels marked in the chart and ask any doubts in the comment section NSE:ITC
