BTC - TP 127200 confirmed coming !!! 29th july viewEveryone are in same page with respect to wave 5 is in progress and we will be seeing new high.
Inner waves of 5th wave is clear now with support formed and ABC corrective move of 2nd wave seems to be completed price moving up. when price respect fib levels and align with wave theory then we can predict the targets. 3rd, 4th and 5th are plotted based on the first 2 move and this will happen for minimum possibilities. so with this data points I am predicting TP of 127200 for BTC very soon in short term.
Search in ideas for "PLOT"

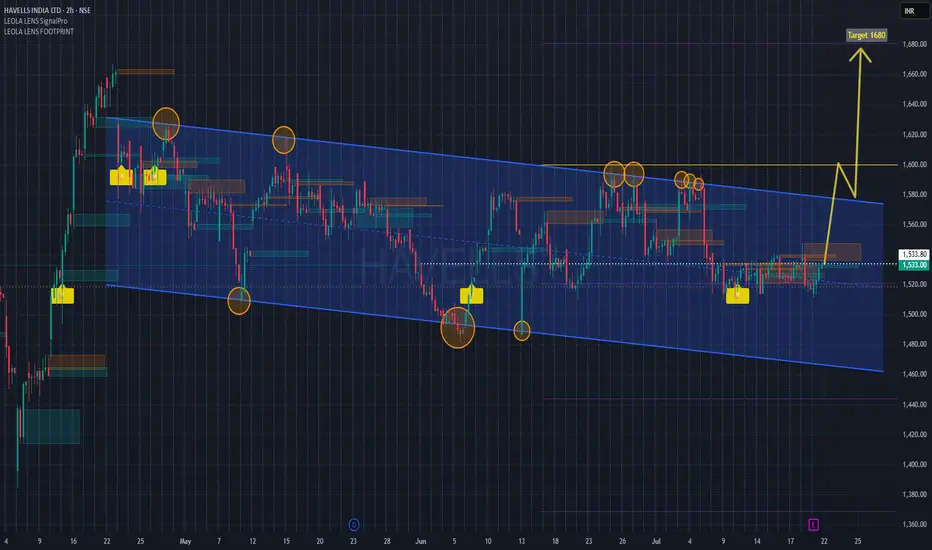
HAVELLS Channel Breakout Setup with Earnings Ahead Havells is approaching a crucial resistance trendline within a well-defined downward sloping channel. Price currently tests mid-channel and historical supply zones, with multiple Leola Lens SignalPro yellow caution labels plotted—historically seen before directional reversals.
📌 Structure Highlights:
Clear channel formation since April
Multiple resistance rejections near 1580 zone
Buy interest seen near lower boundary with SignalPro confirmation
Breakout projection suggests target zone near 1680, aligning with prior volume gap
📅 Earnings event likely to be a catalyst. Monitor price behavior post-results for potential breakout confirmation above 1580.
🧠 Leola Lens™ SignalPro Notes:
Yellow caution labels have repeatedly appeared near key turning points within the channel, suggesting possible trend transition zones. These zones highlight moments of institutional activity, where smart money behavior often shifts.
The yellow caution markers indicate potential trend change zones, based on historical conditions where price has shown institutional interest or liquidity shifts. These zones are not direct buy/sell signals, but highlight areas to monitor closely for structural confirmation.
🧠 This chart is intended for educational and structural analysis only. No financial advice.
Mastering Volatility: How to Use Average True Range (ATR)Volatility is often seen as a trader’s worst enemy or greatest ally. Knowing how to measure it accurately can give you an edge in both planning entries and managing risk. That’s where the Average True Range (ATR) comes into play. It doesn’t tell you the direction of the market—but it does tell you how much the market is moving. And that makes all the difference in uncertain environments.
Let’s dive into how ATR can become your secret weapon for smarter trading.
What is Average True Range (ATR)?
The ATR is a technical indicator that measures market volatility. Originally developed by J. Welles Wilder Jr., ATR calculates the average of true ranges over a specified period—often 14 days. The “true range” accounts for gaps, high-low spreads, and price jumps, making it more comprehensive than just looking at daily ranges.
The result? A simple line plotted on your chart that shows how much an asset typically moves during a given timeframe.
How to Use ATR in Your Strategy
While ATR doesn’t signal buy or sell directions, it plays a powerful supporting role in many strategies:
Setting Stop-Loss and Targets: Traders often use a multiple of the ATR value to determine stop-loss or take-profit levels, adjusting for market volatility.
Volatility Breakouts: If ATR is rising, it may indicate a potential breakout. Low ATR might signal consolidation and tighter ranges—perfect for range-bound strategies.
Position Sizing: High ATR? Reduce your position size. Low ATR? You might afford to scale slightly larger. ATR helps align trade size with risk.
Managing Risk with ATR
One of the most practical uses of ATR is in risk management. Suppose you’re trading a stock with an ATR of ₹5. Setting a stop-loss of ₹2 might be too tight and likely to get hit. ATR helps avoid premature exits by showing what’s “normal” volatility for that stock. Combine ATR with risk management tools like Dhan’s Bracket Orders to structure your trades smartly.
Conclusion
ATR doesn’t predict the future—but it does reveal the tempo of the market. Whether you're navigating a choppy day or holding through a trending week, ATR helps you adjust your expectations, fine-tune your stop-losses, and avoid emotional decisions.
Happy Trading!
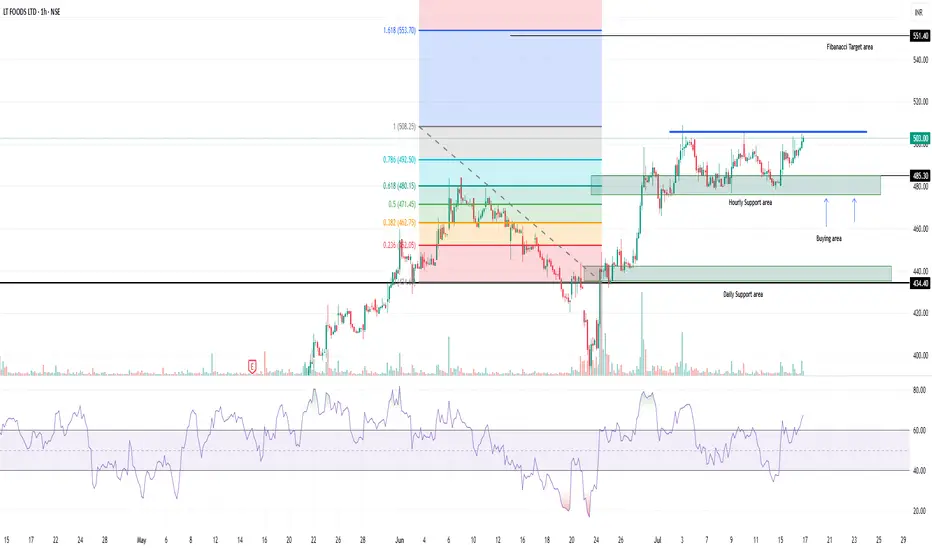
LT Foods | Strong Breakout + Fibonacci Confluence | CMP ₹503Technical Analysis Summary:
✅ Breakout Structure: Price is attempting a breakout from a consolidation zone near ₹503 after a strong bullish rally.
📊 Fibonacci Confluence:
Fibonacci retracement plotted from swing high to swing low.
Key retracement levels respected — especially the 0.618 zone at ₹480.15, which aligns with the hourly support area.
🟩 Buying Area Identified:
Green zone (₹470–₹485) marked as strong support — previously tested multiple times.
Price bounced from this level with volume confirmation.
📈 RSI Momentum: RSI is trending above 60, indicating strong momentum buildup.
Trade Plan (For Educational Use):
=================================
Entry: On sustained close above ₹503 or retest near ₹485 zone with volume support.
Stop-Loss: Below ₹471 or swing low.
Targets:
T1: ₹508 (Fibo 1.0)
T2: ₹553 (Fibo 1.618)
Trail beyond with SL moved to cost.
⚠️ Disclaimer:
This chart idea is for educational purposes only and should not be considered investment advice. Please do your own research and consult a financial advisor before making any trading decisions. Trade at your own risk.
BTC 30 Mins Timeframe Analysis 12 July 2025 #intraday #BTCCRYPTOCAP:BTC Bitcoin is currently testing a strong resistance zone near $118K, forming a bullish ascending channel on the 30-min chart. Breakout or breakdown from this level could dictate the next directional move. Multiple entry points and risk zones identified for both scalpers and swing traders.
📌 Key Technical Highlights:
Ascending trendline support intact
Resistance zone: $118,040 – $118,422
Fibonacci levels plotted for precision targets
“Safe Entry” level above resistance for reduced risk
Breakdown level near $117,170 marked clearly
Volume building into resistance zone
🎯 Upside Target Levels:
Target 1: $118,909
Target 2: $119,365
Extended Target: $119,852 – $120,048 (monthly range)
⚠️ Downside Risk Levels (if breakout fails):
Breakdown Trigger: $117,170
Risk Zone 1: $116,633
Risk Zone 2: $115,690 – $115,226
📈 Strategy Outlook:
Bullish Bias: If BTC breaks and sustains above $118,422 with volume
Bearish Setup: On rejection or breakdown below $117,170
Use tight SLs near ascending trendline for intraday trades
Scalp long if price retests support zones and holds with volume
🛡️ Disclaimer:
We are not SEBI-registered analysts. This content is for educational and informational purposes only. Please consult your financial advisor before making any trading decisions.

BSE FORMED BAT PATTERNHere BSE having BAT PATTERN ratio is visible clearly to get you clear i plotted a fib retracement and in BAT pattern other ratios are mentioned to understand easily.
another dashed line in green is also drawn here to show you previuos high wored as support during formation if BAT.

Intraday Trading with VWAPThe Volume Weighted Average Price (VWAP) is one of the most trusted tools for intraday traders. Used by institutional and retail traders alike, VWAP helps identify fair value during the trading day and can act as both a dynamic support/resistance and trend guide.
What is VWAP?
VWAP stands for Volume Weighted Average Price. It gives the average price a security has traded at throughout the day, weighted by volume. It resets at the start of each trading session.
Why VWAP Matters in Intraday Trading
Price above VWAP: Suggests a bullish bias; buyers are in control.
Price below VWAP: Indicates bearish sentiment; sellers are dominating.
VWAP as Support/Resistance: The line often acts as a natural support or resistance throughout the session.
How Intraday Traders Use VWAP
Trend Confirmation: Combine VWAP with price action. For example, if price is consistently above VWAP and making higher highs, the trend is strong.
Entry/Exit Signals: Enter long positions near VWAP support in an uptrend or short positions near VWAP resistance in a downtrend.
Mean Reversion: In range-bound markets, traders buy below and sell above VWAP assuming price will revert to the mean.
Using VWAP on TradingView
Go to the Indicators tab and search “VWAP.”
It automatically plots the daily VWAP line.
You can also try Anchored VWAP to align with specific events like earnings or large candles.
Conclusion
VWAP is not just for institutions it can be a powerful ally for retail traders too. It’s simple, effective, and offers real-time insights into market sentiment. Use it with price action or other indicators to fine-tune your strategy.
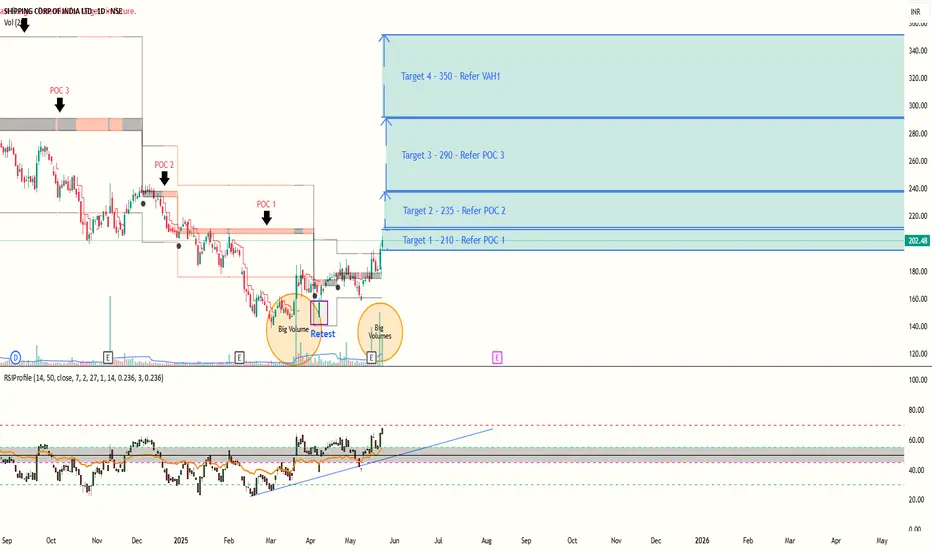
Shipping Corporation of India - Value Buying and Bullish trendShipping Corporation of India had retraced almost 61.8 % from highs near the lows, after a period of accumulation where there were continous responsive buyers at lows. The price started moving up.
Volumes : Volumes can be confirmed with the circles plotted on chart.
Retest : The retest of price happened highlighted by the rectangle.
Initiative Buyer : we can see big volumes coming after the retest happened and price started moving above POC - Point of control of current range. This suggest a strong support zone below even if the price retraces a bit eventual trend is up.
From the previous point of controls and value area highs we can set targets for upcoming upmoves :
Targets :
1)210
2)235
3)290
4)350
There should be strong support around Point of control and value area low of current range, in case of SL hunting of weak hands.
Still shows a relatively low risk opportunity with potential for high reward.
PS : Post is educational in nature and doesn't constitute any financial or buy sell advice. Do your own research. The publication is made with the intention to explain the concepts of RSI Hybrid Profile.
Indicator
RTNPOWER – A Classic Price Action Study Around Major Trendlines🟦 Dotted Blue Line
Represents the main counter trendline, stretched over a significant duration. Price has currently pushed above it, but the weekly candle is still open.
⬜ White Line (Hidden CT)
A hidden resistance line, drawn from key lower highs. Price is currently reacting near this line — acting as a logical area where sellers might test control ( for my setups )
🟨 Yellow Zones
These levels highlight higher lows, a sign of evolving structure. These bases often add context to the strength behind a breakout move.
🔴 Red Line (MTF Resistance)
Plotted from historical monthly rejection zones — a crucial area for confluence and reaction.
🛠️ Only sharing my Charting — no recommendations, no forecasting .

Nifty Mid_Select IndexHello & welcome to this analysis
From July 2022 to Sep 2024 it appears to have completed an impulse 5 waves up structure forming a Primary Wave 1
From Sep 2024 to Apr 2025 is a corrective ABC wave that has done a 38 Fibonacci retracement.
While it is too early to suggest whether that zigzag fall was a Primary Wave 2 or Wave A of B. The unfolding in the daily time frame suggest the probability of the former and start of a Primary Wave 3.
A weekly close above 13250 would increase the conviction of an impulse wave for probable levels where it could make swing highs along its path at approx 14300, 15000, 18000 & 20000.
Keep in mind where I have plotted Intermediate Wave 3 could also be an expanded Wave B. Therefore, keep an alternate count in hand till it gives more and more confirmation for bullishness.
I am going with the probability of this being a bullish structure as of now
All the best

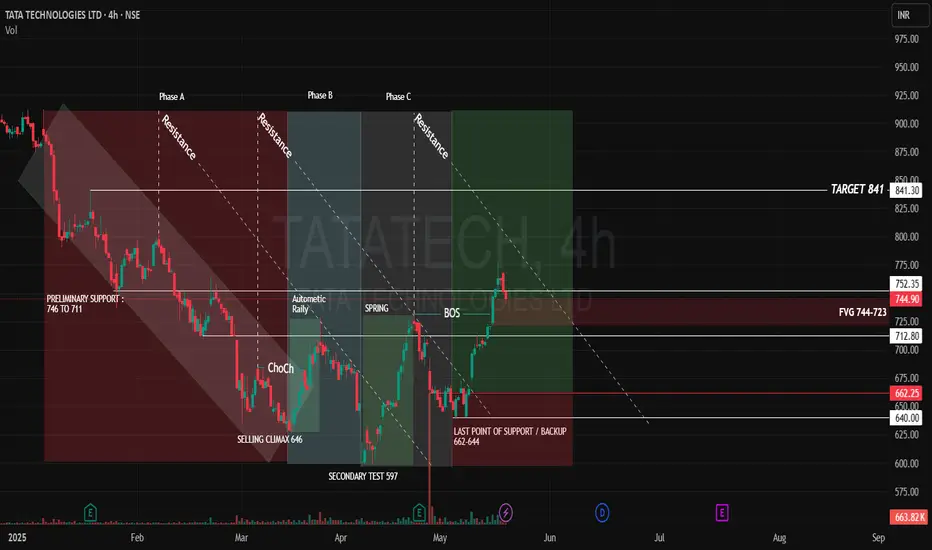
Tata Technologies – Wyckoff-Based Price ProjectionTata Technologies has shown a strong upward move from the Last Point of Support (LPS) near 640, in alignment with the Wyckoff Method. The price rallied up to 778, indicating strong bullish momentum.
The trend structure reveals Higher Highs (HH) and Higher Lows (HL), confirming a bullish market structure. A Bullish Fair Value Gap (FVG) has been identified between 723 and 744, which could offer a second entry opportunity if price revisits and mitigates this zone.
The downward resistance trendline, now plotted, may act as a key resistance zone. A breakout above this trendline would further confirm bullish strength.
The Break of Structure (BOS) around 731 supports the projection of a continued move toward the target of 841. Additionally, the Preliminary Support zone (746–711)—previously a base for accumulation—may now act as a strong resistance-turned-support zone upon a successful breakout.
Trade Projection
Partial Entry: Around CMP (757)
Final Entry Zone: If price revisits and mitigates the FVG at 723–744
Target: 841
Bullish Continuation: Look for future Bullish FVGs as signs of sustained momentum
Bearish Scenario – Selling Opportunity
If the FVG fails to hold and price breaks below 712, it would indicate a Change of Character (ChoCH) and invalidate the bullish setup. In that case, we could expect a decline toward the next support zone at 662.
Zones & Levels
FVG (Fair Value Gap): 744–723
Target: 841.30
Support Levels:
712.80
662.25
640.00
Disclaimer: lnkd.in
SARLAPOLY - Cup & Handle Breakout With Fibonacci Confluence📊 SARLAPOLY – Cup & Handle Breakout with Fibonacci Confluence
🕰️ Timeframe: 1D | 📐 Pattern: Cup Formation + Trendline Breakout
🔍 Technical Overview:
SARLAPOLY has completed a Cup pattern and given a strong breakout above the descending trendline resistance, accompanied by a massive volume spike.
The breakout aligns well with the 61.8% Fibonacci retracement level (~₹100.94), increasing confidence in the breakout's validity.
🔑 Key Technical Levels:
🔵 Resistance / Upside Targets:
₹117.88 (Fib 78.6%)
₹120.00
₹123.68
₹125.00
₹127.90
₹132.25 (100% Fib retracement)
🔴 Support Zones:
₹101.13 (recent breakout level / Fib 61.8%)
₹94.66 (previous resistance zone – now support)
₹91.27 (Fib 50%)
₹69.07 (23.6% Fib + structure support)
📊 Volume & Indicators:
📈 Breakout Volume Surge – Volume confirmation indicates institutional interest and breakout strength.
🧮 Fibonacci Retracement – Plotted from swing low (₹50.30) to swing high (₹132.25), gives clear confluence zones.
🔺 Trendline Breakout – Downward sloping trendline broken cleanly, confirming bullish intent.
☕ Cup Formation – Classic rounding bottom visible, suggesting accumulation phase is complete.
🧠 Bias: Bullish
📉 Watch for a retest around ₹100–₹101 zone as a potential re-entry point with SL below ₹94.66 for positional swing.
⚠️ Disclaimer: This is an educational analysis and not financial advice. Always do your own research before making investment decisions.
📈 Follow @PriceAction_Pulse for more price action setups, breakout alerts, and swing trade ideas!
💬 Comment below if you’re watching SARLAPOLY for the next leg up 📊

PREMEXPLN - Cup & Handle Breakout | Volume Surge📊 PREMEXPLN – Cup & Handle Breakout | Volume Surge + Key Fibonacci Confluence!
🕰️ Timeframe: 1D | 📐 Pattern: Cup & Handle | 📊 Momentum: Bullish
📈 Technical Chart Overview:
Premier Explosives has executed a clean breakout above a long-term descending trendline and a cup & handle base with a massive spike in volume, hinting at a powerful trend reversal.
Price surged nearly +19% intraday, confirming strength near the 61.8% Fibonacci retracement from the previous swing high at ₹910.30 to the swing low at ₹253.40.
🔍 Chart Highlights:
☕ Cup & Handle Pattern: Formed over several months, signaling accumulation and breakout
📐 Descending Trendline: Broken with strength and volume confirmation
📊 Volume Spike: Volume highest since April 2024 – strong buyer interest
🟢 Breakout Zone: ₹472.65–₹480.00 (key previous resistance)
🔴 RSI (14): At 67.72 – approaching overbought zone, suggesting strong momentum
🧱 Support & Resistance Levels:
Level Type Price (₹)
🔼 Resistance 1 504.10 (Fib 61.8%)
🔼 Resistance 2 581.10 (Fib 50%)
🔼 Resistance 3 659.90 (Fib 38.2%)
🔻 Support 1 440.00 (Breakout Retest Zone)
🔻 Support 2 308.75 (Horizontal demand zone)
🔻 Support 3 253.40 (100% Fib low)
🔧 Indicators Used:
Fibonacci Retracement – Plotted from ₹910.30 to ₹253.40
RSI (14) – Showing bullish divergence and breaking out of consolidation
Volume Bars – Confirming breakout with institutional strength
Bull/Bear Icons – Track momentum shifts visually over RSI
🧭 Trade Outlook:
✅ Bias: Bullish
🛒 Entry Zone: Retest near ₹472.65–₹480 (ideal pullback entry)
🎯 Targets: ₹504 → ₹581 → ₹660+
❌ Invalidation: Close below ₹440 with volume
💬 Summary:
PREMEXPLN looks strong on the daily chart after breaking a classic cup & handle pattern with volume confirmation. The breakout aligns perfectly with Fibonacci retracement zones, suggesting room for continued upside. Monitor for a potential retest entry.
⚠️ Disclaimer: This is a technical analysis chart for educational purposes only. Do your own research and consult a financial advisor before trading.
🔔 Follow @PriceAction_Pulse for more breakout charts, swing trades & price action insights!
💾 Save and share if PREMEXPLN is on your watchlist this week.

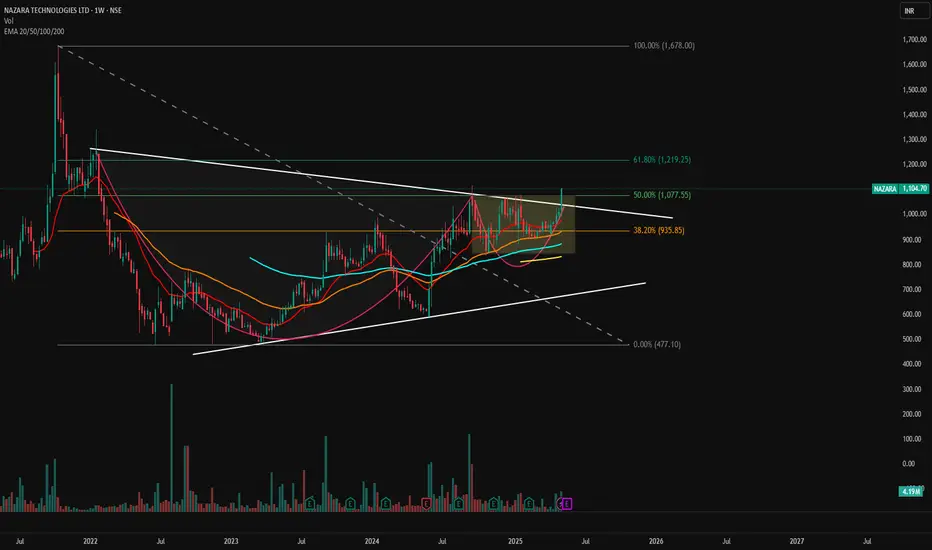
NAZARA - Breakout from Long-Term Falling Wedge📊 NAZARA – Breakout from Long-Term Falling Wedge | Strong Weekly Momentum
🕰️ Timeframe: Weekly | 💥 Pattern: Falling Wedge Breakout | 🔥 Sentiment: Bullish
📈 Chart Overview:
Nazara Technologies has broken out of a multi-year falling wedge on the weekly chart, with a strong green candle above key EMAs and Fibonacci confluence zones. Price closed the week above ₹1,100, indicating a shift in long-term momentum and a potential start of a fresh uptrend.
🔍 Technical Highlights:
📉 Falling Wedge Pattern: Multi-year consolidation now broken on strong volume
💥 Breakout Candle: Price closed above trendline resistance and key Fibonacci 50% level
🧠 Volume Surge: Volume confirmation signals institutional interest
📊 EMA Confluence: Price trading above 20/50/100/200 EMAs – bullish alignment
🧱 Support & Resistance Levels:
Level Type Price (₹)
🔼 Resistance 1 1,219.25 (Fib 61.8%)
🔼 Resistance 2 1,678.00 (Previous ATH / Fib 100%)
🔻 Support 1 1,077.55 (Fib 50% – breakout zone)
🔻 Support 2 935.85 (Fib 38.2% + EMA cluster)
🔻 Support 3 820–860 (multi-touch horizontal support & EMA 200)
🔧 Indicators Used:
Fibonacci Retracement – Plotted from swing low ₹477.10 to high ₹1,678.00
EMA 20/50/100/200 – Price is now above all EMAs, showing trend shift
Volume Bars – Confirming strong breakout
Chart Pattern – Falling wedge (typically bullish)
📌 Chart Sentiment & Setup:
✅ Bias: Strongly Bullish
📍 Breakout Level: ₹1,077
🎯 Upside Targets: ₹1,219 → ₹1,320 → ₹1,678
❌ Invalidation: Sustained close below ₹935 with volume
📢 Summary:
Nazara is showing signs of a structural breakout after prolonged downtrend and consolidation. The falling wedge breakout, confirmed by volume and EMA crossover, sets up a long-term bullish outlook. A retest of the ₹1,075–₹1,100 zone could offer a high-probability entry.
🧠 Pro Tip: Wait for a weekly candle close and minor pullback to the breakout level before entry.
⚠️ Disclaimer: This is a technical analysis post meant for educational purposes only. Please do your own research or consult a financial advisor before investing.
🔔 Follow @PriceAction_Pulse for more actionable swing setups, breakout alerts, and chart breakdowns!
Nifty Spot Eying 25300? Fibs and WavesCMP: 25990
TF: 30 minutes
I have plotted fib for the entire fall from 26277 to 21743 and the fib levels are marked herein.
As you can see, the price has been trading within Each Fib levels (taking support and resistance) and then moved up on to the next level.
The recent breakout of the important 61.8% level is of great significance and the price managed to stay above the 0.618 level (24545.5) successfully.
As the fibs, the next level is placed at 25307 (0.786) and we can expect the price to test the same.
The wave counts (including the subwaves of 15 minutes timeframe), suggests one final leg is due and we can expect 25300 or more (if it extends) in the coming sessions.
Disclaimer: I am not a SEBI registered Analyst and this is not a trading advise. Views are personal and for educational purpose only. Please consult your Financial Advisor for any investment decisions. Please consider my views only to get a different perspective (FOR or AGAINST your views). Please don't trade FNO based on my views. If you like my analysis and learnt something from it, please give a BOOST. Feel free to express your thoughts and questions in the comments section.

ECLERX | Ideal Retracement Zone Identified📉 White Lines — Multiple DTF trendlines, including the key falling counter-trendline (CT), were decisively broken. The breakout marks the end of a strong downward structure with excellent follow-through.
🟧 Orange Line — Major Monthly Time Frame (MTF) resistance lies just overhead.
🔍 Breakout Candle:
Exceptionally strong with a close near high.
Backed by 1.83M volume, showing strong institutional interest.
Pattern size is large — adding weight to the structural reversal.
⚠️ Caution: A large portion of the move seems to have already played out within one candle. Chasing here risks poor R:R due to limited space before overhead resistance.
📐 Strategy Setup:
Fibonacci Retracement plotted on the breakout candle.
Ideal entry zone highlighted in green between the 0.382 to 0.5 levels
This zone represents a healthy and probable pullback area, offering better risk-reward alignment for potential continuation.
🧭 Trade Idea: Avoid chasing. Instead, watch for a retracement to the green zone. If price reacts positively there, it could offer a technically strong R:R opportunity while staying aligned with the broader breakout narrative.

Nifty 120% upside Possible Targets 55000+ in next 4-5 Years.Nifty 120% upside Possible Targets 55000+ in next 4-5 Years.
Now That lot of uncertainties have settled down & we are about to break ATH in matter of 1 months time - Retailers might be worried what should be Next step they should execute - Below is the detailed description on Nifty to help them.
1. I have Plotted Nifty Quarterly Charts since Inception in 1991 - 34 Years Nifty has been following a constant channel irrespective of rough phases in Indian Economy during FY 1991-1999 where it can be seen consolidating sideways. Post that we had good Economy Growth phase from FY 2003 till 2010 highlighted with Circle & NIFTY was 5x during that Phase.
2. Post 2010 we can see Nifty has been consolidating again for 1 decade - sideway markets with minor gains.
3. Post COVID - 2021 onwards we can see Economy Growth has gain momentum & same reflecting in Nifty. Now we are in mid of Decade & Channel too ... So As per the Projections we can see Nifty goring 120% to 55000+ by end of this decade which is 5 Years from now.
4. What should Retailers do? - Retailers can start Accumulating good Quality stock at current Level because once Nifty breaches 26000 then market would look expensive. Be an Investor & Invest keeping 5-7 Years minimum Investment period to get 2x-3x-4x Returns from Quality stocks.
There should be no doubt at all that this Target won't come - India is one of the Leading Economy growing @8% GDP, Our domestic consumption is enough to drive economy at same speed, India is driving towards self dependency as seen in recent WAR scenario where Made in INDIA weapons has ditched all kachra weapons produced across world. Our Stable & Capable Government has got us respect around the world. INDIA is a brand now & next 20-30 Years belongs to INDIA to become Superpower.
Sectors to Invest for next 5-10 Years - Defense{still an infant stage so huge potential to grow} / Banking{Our Banking Industry is matured enough now & ready to takeoff soon with Quality Brand} / Auto{Huge opportunity for EV segment & Growing INDIA}.
So overall I would like to conclude Retailers don't Panic at anytime & use dips as opportunity for Investment - Wealth can be built over years & not in short term.
Happy Investment.

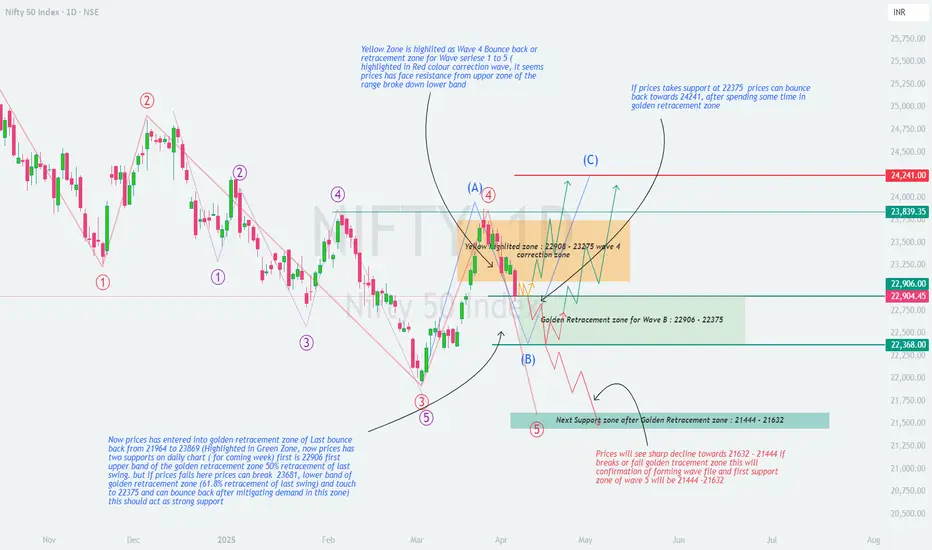
NIFTY : Weekly Analysis (07-Apr to 11-Apr)📊 NIFTY 50 Weekly Analysis – Elliott Wave & Retracement Outlook (April Week 2)
As per the latest Elliott Wave analysis and Fibonacci retracement zones plotted on the chart, NIFTY is currently at a critical juncture . Price action from here will define whether the market resumes upward correction or heads for a deeper fall.
🧠 Technical Structure Overview
The red-labelled impulse wave series 1 to 5 has completed, indicating a completed correction wave structure .
A corrective bounce has been observed post-Wave 5 in the form of Wave A .
Price is now moving in a Wave B correction and has entered a key Fibonacci retracement zone.
📍 Important Zones to Watch
🔶 Yellow Zone – Wave 4 Correction Resistance:
Range: 22,908 – 23,275
This was a previous bounce zone (Wave 4), now acting as a resistance range.
Price faced strong rejection here and reversed down into retracement territory.
🟩 Golden Fibonacci Retracement Zone for Wave B:
Range: 22,906 – 22,368
Price has entered this critical retracement zone.
This range corresponds to:
50% retracement = 22,906 (upper band)
61.8% retracement = 22,368 (lower band)
Implication: If NIFTY sustains within this zone and forms a base, it may initiate a move towards Wave C.
🧭 Scenarios for Coming Week
✅ Bullish Scenario:
If price sustains above 22,368 and reclaims 22,906, it can bounce back towards:
🎯 Target 1: 23,839
🎯 Target 2: 24,241 (Wave C projection)
Confluence: Wave A-B-C projection fits well within this move.
❌ Bearish Scenario:
If price breaks below 22,368 and fails to hold the golden zone:
Expect a sharp decline towards support zone: 21,444 – 21,632
This move would confirm the formation of another impulsive Wave 5 down .
🔍 Key Support and Resistance Levels
Resistance:
22,908
23,275
23,839
24,241
Support:
22,906 (Upper Golden Zone)
22,368 (Lower Golden Zone)
21,632 – 21,444 (Major Support Zone)
📌 Conclusion:
NIFTY is in a decisive zone. Whether we go for Wave C up or another Wave 5 down depends on price action within the 22,906 – 22,368 zone .
Traders should:
Watch for confirmation candles and volumes.
Use demand zone reactions to position accordingly.
Maintain strict risk management.
💬 Share your views in the comments – do you expect a bounce from here or a breakdown?
#NIFTY50 #ElliottWave #TechnicalAnalysis #TradingView #NIFTYAnalysis #Fibonacci #SwingTrading #PriceAction
How to Trade Nifty Using Demand & Supply ZonesWhen markets move sharply up or down, many traders often wonder “Where should I enter?” or “Where might a reversal happen?” — That’s where Demand and Supply zones become your best trading friends. Let’s decode this chart and see how you can trade Nifty smartly using this powerful concept.
🔎 A Smart Trader's Guide to Spotting High-Probability Reversals
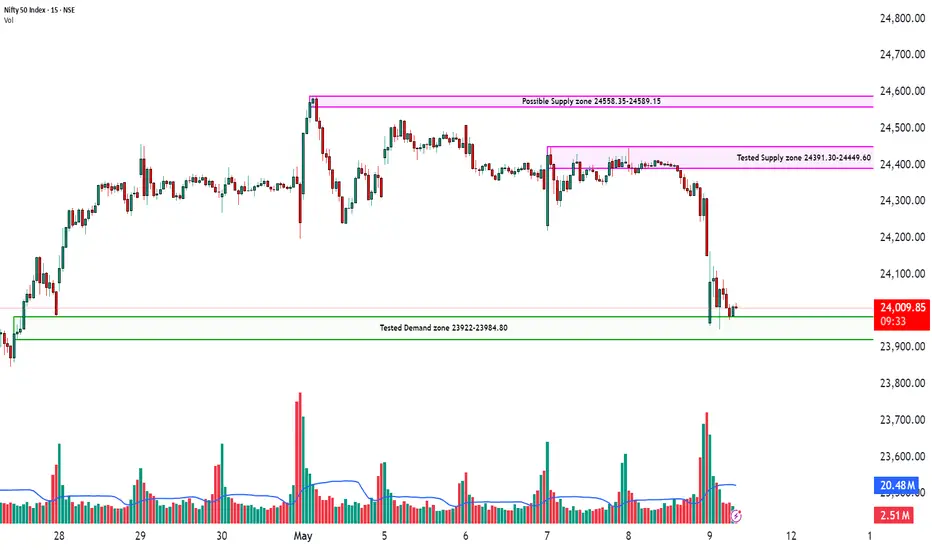
📍 Chart Timeframe: 15-Min | Index: Nifty 50
🖼️ Visuals Above: Key Demand & Supply Zones plotted with high-precision, backed by volume spikes and price rejection patterns.
🔍 What Are Demand & Supply Zones?
Think of demand and supply zones as institutional footprints.
Demand Zone = Where smart money is likely buying.
Supply Zone = Where smart money is likely selling.
These zones aren't random. They're created when large orders enter the market — and price reacts sharply. The idea is to follow where the "big boys" are placing their bets.
🧠 Why This Chart Matters:
In this Nifty 15-min chart, we’ve identified 3 key levels:
🟩 Tested Demand Zone: 23922 – 23984.80
This zone has already been tested and respected multiple times.
Price bounced cleanly from here again, showing active buying interest.
Volume confirms buyer presence — a sign that this zone still holds value.
🟥 Tested Supply Zone: 24391.30 – 24449.60
Sellers have defended this level previously.
It acted as a ceiling, pushing price back down.
If price returns here, be alert for shorting opportunities with bearish confirmation.
🟪 Possible Supply Zone (Untested): 24558.35 – 24589.15
This zone hasn’t been tested yet.
If price breaks above the first supply zone, this could be the next target or reversal point.
📈 How to Trade This Setup:
🟢 Long Trade Idea – Buy from Demand Zone
Entry: Near 23922–23984 (once price shows reversal candles or bullish volume)
Stop Loss: Just below 23922
Target: 24391–24449 (tested supply zone)
🔴 Short Trade Idea – Sell from Supply Zone
Entry: Near 24391–24449 (look for rejection wicks, volume drop)
Stop Loss: Slightly above 24449
Target: Demand zone near 23984
🔄 Breakout Opportunity
If price breaks above the tested supply zone with volume, watch for a quick move to the next supply zone near 24589.
Re-entry is possible on a retest of the broken zone.
🎯 Pro Trader Tip:
"Don’t chase price. Let it come to your zone. The highest probability trades happen when price enters a zone + confirms with volume."
⚠️ Disclaimer:
This analysis is for educational purposes only and does not constitute any investment advice or stock recommendation. Please consult with your financial advisor before taking any trading decisions. This post complies with SEBI regulations and is intended to promote financial literacy.
🗣️ Let's Discuss:
✅ Are you using supply & demand in your trading?
✅ Want help identifying zones on your favorite stocks?
👇 Drop your charts or questions in the comments — let’s grow together!
What Is a “Mind Indicator”?NSE:NIFTY NSE:BANKNIFTY BSE:SENSEX NSE:CNXFINANCE
A mind indicator is a structured, quantifiable measure of a trader’s emotional and cognitive state—treated much like any technical indicator on a chart. Instead of price, volume, or momentum, it tracks internal variables such as stress, confidence, impulsivity, and bias. By plotting these metrics over time, traders can visualize their mental “terrain” alongside market action.
---
Why Mind Indicators Matter
1. Visibility of the Invisible
Emotions and biases are inherently subjective and often go unnoticed in the moment. A mind indicator brings them into the light as data.
2. Objective Self-Awareness
Just as traders rely on objective rules for entries and exits, a mind indicator supplies an objective gauge of readiness, discipline, and mental clarity.
3. Early Warning System
Spikes in stress or greed metrics can preempt rule-breaking behavior—akin to an overbought oscillator signaling a potential price reversal.
4. Edge Preservation
Mechanical systems lose their statistical edge when executed emotionally. Mind indicators help ensure that trades are only taken when both the system and the trader’s psychology are aligned.
---
Key Components of Mind Indicators
Self-Rating Scales
Traders rate their current emotional state on a simple scale (e.g., 1–5 for calm to anxious).
Behavioral Counters
Tracking counts of rule violations, impulsive entries, or “revenge” trades within a session.
Session Metrics
Monitoring trade frequency, average hold time, and time since last break to reveal fatigue or overtrading.
Cognitive Bias Flags
Logging occurrences of known biases (anchors, confirmation bias, recency bias) to see how often they coincide with mistakes.
---
What Everyone Should Know About Mind Indicators
1. They Are Not “Soft”—They’re Data
By assigning numbers to feelings and behaviors, mind indicators convert fuzzy, emotional information into hard, analyzable data.
2. Alignment Is Crucial
The true benefit comes when a positive mind-indicator reading aligns with a valid technical setup; divergence signals caution.
3. They Require Honesty
Self-assessments only work if traders rate themselves truthfully. Over- or underestimating your state skews the indicator.
4. They Reveal Patterns Over Time
Consistent logging uncovers whether certain market conditions (e.g., high volatility) reliably spike stress or induce bias.
5. They Highlight Personal Vulnerabilities
Every trader has unique psychological pitfalls—mind indicators can pinpoint whether you’re more prone to fear, greed, overconfidence, or another bias.
6. They Are Platform-Agnostic
Whether through a spreadsheet, journal, or integrated chart overlay, the principle remains: make your mind visible.
---
Importance and Impact
Consistency Boost
Traders who monitor their mind indicators tend to stick more faithfully to their rules, leading to steadier performance.
Emotional Resilience
By recognizing stress or fatigue early, traders can avoid burnout and maintain long-term focus.
Bias Mitigation
Tracking biases quantitatively makes it easier to spot recurring cognitive traps and reduce their influence.
Process Transparency
Reviewing both market data and mind-indicator data in tandem offers a fuller picture during performance reviews, making “why” a trade went right or wrong much clearer.
---
Understanding mind indicators transforms trading from a purely external analysis of markets into a holistic practice that accounts for the trader’s own internal landscape. They turn mental factors—once hidden and erratic—into consistent, actionable data, making self-awareness a core part of any robust trading methodology.
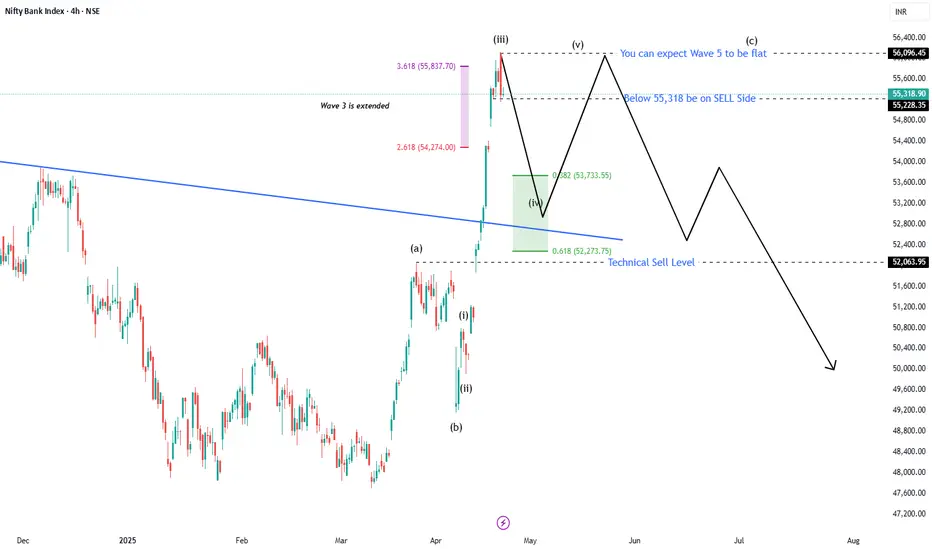
This Elliott Wave analysis on Bank Nifty (4H chart) This Elliott Wave analysis on Bank Nifty (4H chart) outlines a classic impulsive wave structure with an extended Wave 3 and projected movement into Wave 4 and Wave 5. Let’s break it down step-by-step:
🌀 Wave Structure Identified:
Wave (i) to (v) – This is the 5-wave impulsive move within Wave C of a larger corrective structure.
Wave 3 is extended – This is confirmed by the 2.618 and 3.618 Fibonacci extensions plotted, showing Wave 3 far exceeds Wave 1 in length.
You're currently in Wave 4, with potential completion near key Fib levels.
📉 Wave 4 Retracement Zone:
Wave 4 has retraced close to:
38.2% (~53,733.55)
61.8% (~52,273.75) of Wave 3
The shaded green box represents the Wave 4 retracement zone, typical for a corrective wave when Wave 3 is extended.
📊 Fibonacci Levels on the Chart:
3.618 ($5,837.70) – Extension of Wave 1, used to project the top of extended Wave 3.
Retracement levels – 0.382 and 0.618 of Wave 3 for Wave 4 correction.
These levels align with potential support areas where Wave 4 might end and Wave 5 may begin.
💡 Projection for Wave 5:
The note: “You can expect Wave 5 to be flat” implies a potential truncation or limited upside – common after an extended Wave 3.
Resistance level marked at 56,096.45 – Possible Wave 5 top or fake breakout zone.
🚨 Action Levels:
Below 55,318 – “Be on SELL Side” → Suggests if price breaks this level, bearish confirmation sets in.
Technical Sell Level: 52,063.95 – Key horizontal support; breach here may trigger stronger downside in a potential larger degree Wave C or corrective move.
🔍 Interpretation Summary:
Element Interpretation
Wave 3 Extended impulsive leg
Wave 4 Currently in progress, retracing into 38.2%-61.8% zone
Wave 5 Expected to be a flatter, possibly truncated move
Sell Triggers Below 55,318 and strong confirmation below 52,063.95
Bias Short-term correction, longer-term bearish if support breaks
Is the SPX500 Correction OVER ?Analysed 1Hr chart:
SPX 500 is correcting from around FEB 25th
It has has been correcting in complex ABC pattern
Within last Leg that is C, it has been doing W-X-Y correction.
Will it have one more Z leg ?
YES : If it retraces/does not cross previous high
When this structure will be invalid ?
When a hourly close is below 5096.
What is the road map if the current structure holds good ?
Wave-3 ~6000
Wave-4 Correction , back to 5500 ??
Wave-5 ~6200
Assumption: It follows plotted channel
Times/Shape of pattern will get extended if time correction follows.

XAUUSD Long
Gold Spot / USD (XAUUSD) — 4H timeframe
Tool Used: Supertrend Profitability Analyzer
Platform: OANDA
⚙️ Strategy Context
This idea showcases a deep profitability scan using 40+ Supertrend configurations, each combining different ATR Lengths and Multipliers to help identify which combinations yield optimal performance on the 4H Gold chart.
The tool visualizes buy/sell signals and plots net PnL for each Supertrend combo, making it easy to spot the best-performing setups.
🔎 What the Chart Shows
Current Trend: Bullish continuation with a mild pullback post a sharp uptrend.
Most Profitable Settings:
✅ ATR 28 / Factor 13.5 → Net PnL: 1196.49
✅ ATR 27 / Factor 13 → Net PnL: 961.09
✅ ATR 25 / Factor 12 → Net PnL: 1230.62
Least Profitable Settings (likely over-optimized or too sensitive):
❌ ATR 43 / Factor 21 → Net PnL: -540.43
❌ ATR 45 / Factor 22 → Net PnL: -218.1
📌 Key Observations
Supertrend with mid-range ATRs (25–30) and moderate multipliers (12–15) performs best during trending conditions.
Overly tight or overly loose settings (low/high ATRs or extreme multipliers) increase false signals or late entries, affecting profitability.
A dynamic Supertrend configuration scan like this is ideal for adaptive bot strategies, trailing stop optimization, or manual signal confirmation.
📈 Possible Next Steps
🔹 If price resumes the uptrend and breaks recent highs, monitor which Supertrend rows turn green in real time.
🔹 Consider using the most consistent performers (e.g., ATR 25–28) in your trading system as primary signal generators or filters.
🔹 Watch for reversal signs (Supertrend flips red) and test performance sensitivity across configs.
📖 Disclaimer
This is an educational idea and not financial advice. Always backtest any strategy before applying it in live trading. The Supertrend Profitability Analyzer is a performance visualization tool and does not guarantee future returns. Use in conjunction with proper risk management.
💬 Let me know your thoughts in the comments!
🧪 Want access to this analyzer? Search “Supertrend Profitability ” in the Indicators tab.
🟢 Follow for more data-driven tools and ideas.
