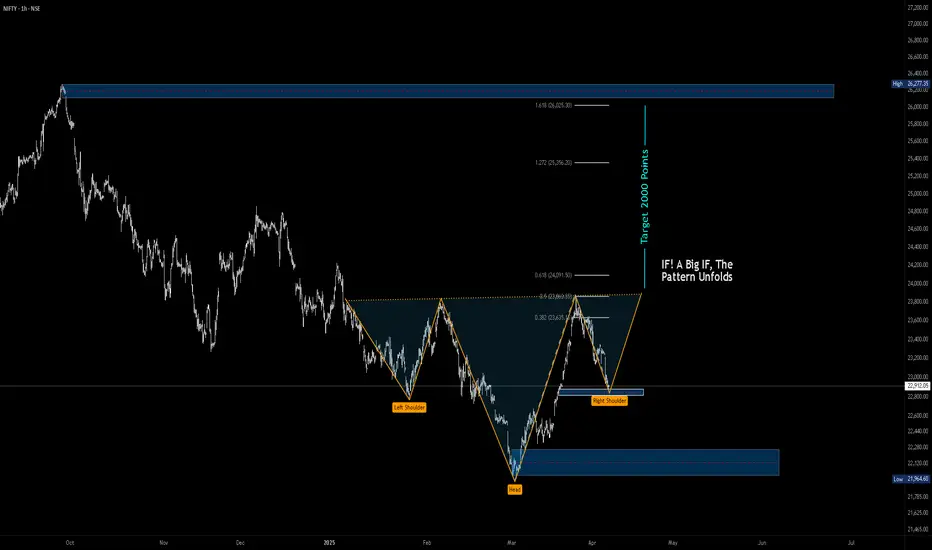
Nifty Prediction for coming days April 4th 2025A Big IF is because we are talking about probability here as the pattern is not yet shaped to its prime.
Lets Understand the Inverted Head and Shoulder Pattern
Left Shoulder : After a downtrend, the price of the respective asset makes a low and then rallies to a higher point, forming the left shoulder.
Head : Following the formation of the left shoulder, the price declines to a point lower than the left shoulder and then rallies again, forming the head.
Right Shoulder : Finally, the price declines again but not as low as the previous decline or the head, and then rallies one more time, forming the right shoulder. The right shoulder is typically roughly equal in depth to the left shoulder.
Neckline : A trendline is drawn connecting the high points (or "peaks") after the formation of each shoulder and the head. This line serves as a level of resistance that the price must break through to confirm the pattern.
Lets not get in to the Psychology part. you can find many around.
---------------------------------------------------------------
To Our analysis of nifty for the coming days we can see the same pattern on the chart above.
1st Trade : Advanced Users
If price takes support at around 22800 - 22750 and If you are good in reading volume find reversal to neck line and beyond if you can.
2nd Trade :
If You see price breaking the neck line with good volume (Volume greater than volume average and or greater than previous 3 or 4 candles in Daily Timeframe, Target Is shown on the Chart Nearly All time High.
-----------------------------------------------------------------
One can see that i have plotted FIb Ext on the chart, That clearly shows that the target of this Inverted H&S is absolutely at around 1.618 of FIb Ext.
One can even Consider this as Elliott Wave 3rd wave (I'm not a master in Elliott wave so correct me if i'm wrong)
Note.
A simple Yet powerful Patter so wait for the pattern to unfold for better results.
------------------------------------------------------------------
Monthly Nifty
In the above Picture You can see Monthly Nifty Chart. Which clearly shows that retracement is done and took support at Moving average. Formed a kicker pattern Which is my fav pattern for reversal. Now a retest of Last month candle Mid we can expect a reversal from there. That's where the market closed today. So rest you need work on your analysis. Good Day and Have a nice weekend
Search in ideas for "PLOT"
Nifty Crashes from Highs –Watch These Fibonacci Zones This Week Nifty50 Crashes from Highs – Watch These Fibonacci Zones This Week ⚠📉
Nifty50 recently broke down from the 23,870 highs and is now trading in a corrective phase. I’ve plotted the Fibonacci retracement zones using AutoFibGauge on the 4H chart to identify the key support levels for this week.
⸻
Updated Fibonacci Levels:
• 23,538 – 23.6% Fib
• 23,134 – 38.2% Fib (Being tested now)
• 22,820 – 50% retracement
• 22,506 – 61.8% Golden Zone 🟡
• 21,466 – 100% retracement (March low)
⸻
Outlook:
• As long as Nifty holds above 23,134, bulls may attempt a bounce.
• If it breaks below this zone, we could see a deeper drop toward 22,820 – 22,506, which is a high-probability bounce zone for swing traders.
• If 22,506 fails, then 21,466 becomes the key support to watch.
Using QMA helps track trend shifts within these levels — currently, momentum is bearish, so I’m watching the Golden Pocket closely for reaction.
⸻
Tap LIKE ❤ & FOLLOW ➕ for weekly Nifty outlooks and real strategy ideas.
⸻
#Nifty50 #Nifty #Fibonacci #AutoFibGauge #QMA #PriceAction #Correction #TechnicalAnalysis #IndexTrading #StockMarketIndia

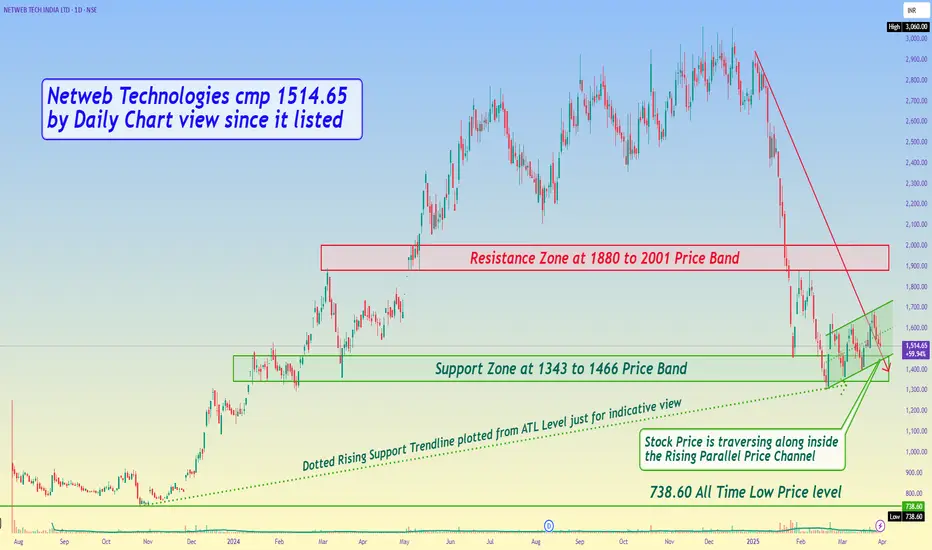
Netweb Technologies cmp 1514.65 by Daily Chart view since it lisNetweb Technologies cmp 1514.65 by Daily Chart view since it listed
- Support Zone at 1343 to 1466 Price Band
- Resistance Zone at 1880 to 2001 Price Band
- Stock Price is traversing along inside the Rising Parallel Price Channel
- Dotted Rising Support Trendline plotted from ATL Level just for indicative view
I Learned Something From This Chart !Hello fellow traders I hope you all are doing well so as we can see the market is not supporting any long position at the moment but the chart of Bajaj Finserv looks very attractive however I am not creating any trading position in it because the company is going to give it's financial figures tomorrow and it can be harmful for my trading position so all of you please also read this idea only for learning.
So through this chart we can learn that when price breaks 200 moving average, then a good fall or a good upside move comes. One pattern is formed which we call double bottom in which price after going above the swing low again comes near the old swing low and forms a double bottom and from where the price has come back is called the pattern neckline. Apart from this I have plotted a resistance zone where price took support for the first few days and later it became a resistance zone. This thing reminded me again about the theory of support and resistance.
So as I have told you, I will not create any trading position because tomorrow its financial result is due and that can harm my long position. But even if a long position is created after this resistance zone breakout then I will keep my target on the old swing high or all time low which was recently created by the stock a few days ago which was around 2000 keep that as my target and will keep my stop loss below the moving average of 200 days. If we look at the risk to reward then it is 1:2 risk reward ratio which is fine considering the current market perspective. I will not give any update for this idea because I am sharing this idea only for learning purpose. It does not seem to be a proper educational publication therefore i am not adding educational flag but adding long flag beacuse that is my current view.
I hope you like my work, Thanks in advance.
Best regards- Amit.

L&T Fin ->> Trade Cum InvestmentLTP 142
Traders:
SL CLB 120
Targets as per the Plotting in the Chart
Investors:
Buy on dips as per given levels
Pls dont miss to Boost 🚀 this idea
For more details -- Plz visit my profile
Rgds,
Naresh G
SEBI Reg. RA

Nifty weekly analysis for 17/03/2025Nifty is trading between 100 EMA (weekly) and 20 EMA (daily). A good support from the weekly moving average is there and resistance on the daily charts.
A continuous support from 22300 level is there as the market has remained in a range whole week.
If the market tried to breach the support level, the support of weekly 100 EMA can be the other support around 22030 else it will take support around 21800.
In case the market starts to recover from the bottom and creates a higher high higher low formation it has to take out the resistance of 22650 and 22758.
Major levels are plotted in the charts. Just wait for the price action to confirm the entry into a trade else another sideways market can be seen.
Inside candle formation on the daily charts is also there and break out/down can be traded accordingly. Different trading approaches can help in capturing a good trade.
Wait for the price action near the levels before entering the market.

Possible Elliott Waves Counts of BITCOINHello friends, today we're analyzing the Bitcoin chart based on Elliott Wave Theory. We're using a 4-hour chart, where we can clearly see that we've completed the intermediate degree 3rd, 4th, and 5th waves means the completion of the primary degree ((3)) wave marked in black. After that, we completed another primary degree ((4)) wave marked in black.
Currently, we're moving upwards, which should be the primary degree ((5)) wave, containing five sub-divisions marked in blue as (1), (2), (3), (4) and (5) We've almost completed the (1) sub-division and are nearing the completion of the (2) sub-division.
According to Elliott Wave Theory, if the recent low wave ((4)) at around $70,200 holds and doesn't break below, the price has the potential to reach new highs towards $110,000 to $120,000. This analysis is entirely based on Elliott Wave Theory and its structure.
In this study we used Elliott Wave Theory & Structures, here we have plotted possible wave counts on daily time frame chart of DXY Dollar Index, it involves multiple possibilities, and the analysis presented focuses on one potential scenario. The provided information is for educational purposes only, not trading advice. There's a risk of being completely wrong.
I am not Sebi registered analyst.
My studies are for educational purpose only.
Please Consult your financial advisor before trading or investing.
I am not responsible for any kinds of your profits and your losses.
Hope this post is helpful to community
Thanks
RK💕
Disclaimer and Risk Warning.
The analysis and discussion provided on in.tradingview.com/u/RK_Charts/ is intended for educational purposes only and should not be relied upon for trading decisions. RK_Charts is not an investment adviser and the information provided here should not be taken as professional investment advice. Before buying or selling any investments, securities, or precious metals, it is recommended that you conduct your own due diligence. RK_Charts does not share in your profits and will not take responsibility for any losses you may incur. So Please Consult your financial advisor before trading or investing.

TOTAL 1 Analysis and outlook Earlier this week i had called that the total 1 chart hit the previous ATH zone to pick up liqudity and shake out weak hands. If you follow total 1 you follow the market.
Outlook: Strong Bullish daily candle coming and can defintely send the market up, but im thinking we may see a retest back a bit to ensure takeoff. Average into your bags.
Plotted resistance lines are visible to see fib retracement respect

No Down Side Left In Nifty 50he Nifty Index, also known as the Nifty 50, is a stock market index representing 50 of the largest and most liquid companies listed on the National Stock Exchange (NSE) of India. It is one of the primary benchmarks for the Indian stock market and is widely used by investors to gauge the performance of the Indian equity market.
The Nifty 50 includes companies from various sectors, such as financial services, IT, energy, consumer goods, and more. The index is calculated using a free-float market capitalization weighted methodology, meaning that the weight of each company in the index is proportional to its market capitalization, adjusted for the shares available for trading.
It serves as a key indicator for the Indian economy and is often used for investment purposes, including the creation of exchange-traded funds (ETFs) and index funds
Volume Profile is a technical analysis tool that displays the distribution of trading volume at different price levels over a specific period. Unlike traditional volume analysis, which shows the total volume traded over a set period of time, the volume profile focuses on price levels, offering a more detailed view of where most of the trading activity occurred.
Here’s how the Volume Profile works and what it represents:
Key Components:
1. Price Levels: The horizontal axis represents price levels rather than time, and the vertical axis shows the volume traded at those levels.
2. Volume Bars: Volume is plotted as horizontal bars that extend across the price scale. These bars indicate the amount of trading activity at each price level.
3. Point of Control (POC): This is the price level with the highest traded volume during the specified period. It often acts as an area of high interest for traders and may indicate a fair value price.
4. Value Area (VA): This includes the price levels where a specified percentage (typically 70%) of the total volume traded during the period occurred. The Value Area can give traders an idea of the price range where the majority of transactions took place, which is considered significant for support and resistance levels.
5. High/Low Volume Nodes: High-volume nodes (or areas) show price levels where a significant amount of trading occurred, often acting as areas of support or resistance. Low-volume nodes are price areas with less trading activity, which can be areas of potential price breakouts.
Uses of Volume Profile:
1. Support and Resistance: The POC and the Value Area are critical in identifying key support and resistance zones. Traders often watch for price reactions around these levels.
2. Trend Confirmation: Volume Profile helps confirm trends. If the price moves toward a high-volume area and consolidates, it can signal strong support or resistance. Conversely, a low-volume area may indicate weak support or resistance and potential breakout zones.
3. Market Sentiment: Volume Profile can reveal where the market is most interested in trading, providing insights into the market's perceived value of a security at different price levels.
4. Breakouts and Reversals: Traders use Volume Profile to spot potential breakouts from low-volume zones or reversals at high-volume levels, providing actionable trade signals.
Overall, Volume Profile is a powerful tool for understanding market structure and price action in a more detailed and context-driven manner.

No More Down Side Left In Nifty 50 IndexThe Nifty Index, also known as the Nifty 50, is a stock market index representing 50 of the largest and most liquid companies listed on the National Stock Exchange (NSE) of India. It is one of the primary benchmarks for the Indian stock market and is widely used by investors to gauge the performance of the Indian equity market.
The Nifty 50 includes companies from various sectors, such as financial services, IT, energy, consumer goods, and more. The index is calculated using a free-float market capitalization weighted methodology, meaning that the weight of each company in the index is proportional to its market capitalization, adjusted for the shares available for trading.
It serves as a key indicator for the Indian economy and is often used for investment purposes, including the creation of exchange-traded funds (ETFs) and index funds.Volume Profile is a technical analysis tool that displays the distribution of trading volume at different price levels over a specific period. Unlike traditional volume analysis, which shows the total volume traded over a set period of time, the volume profile focuses on price levels, offering a more detailed view of where most of the trading activity occurred.
Here’s how the Volume Profile works and what it represents:
Key Components:
1. Price Levels: The horizontal axis represents price levels rather than time, and the vertical axis shows the volume traded at those levels.
2. Volume Bars: Volume is plotted as horizontal bars that extend across the price scale. These bars indicate the amount of trading activity at each price level.
3. Point of Control (POC): This is the price level with the highest traded volume during the specified period. It often acts as an area of high interest for traders and may indicate a fair value price.
4. Value Area (VA): This includes the price levels where a specified percentage (typically 70%) of the total volume traded during the period occurred. The Value Area can give traders an idea of the price range where the majority of transactions took place, which is considered significant for support and resistance levels.
5. High/Low Volume Nodes: High-volume nodes (or areas) show price levels where a significant amount of trading occurred, often acting as areas of support or resistance. Low-volume nodes are price areas with less trading activity, which can be areas of potential price breakouts.
Uses of Volume Profile:
1. Support and Resistance: The POC and the Value Area are critical in identifying key support and resistance zones. Traders often watch for price reactions around these levels.2. Trend Confirmation: Volume Profile helps confirm trends. If the price moves toward a high-volume area and consolidates, it can signal strong support or resistance. Conversely, a low-volume area may indicate weak support or resistance and potential breakout zones.
3. Market Sentiment: Volume Profile can reveal where the market is most interested in trading, providing insights into the market's perceived value of a security at different price levels.
4. Breakouts and Reversals: Traders use Volume Profile to spot potential breakouts from low-volume zones or reversals at high-volume levels, providing actionable trade signals.
Overall, Volume Profile is a powerful tool for understanding market structure and price action in a more detailed and context-driven manner.

Key Patterns, Observations, and Future ScenariosThe stock is trading within a well-defined ascending channel, which is indicative of an overall bullish trend. Over the past few years, the price has consistently respected both the upper and lower boundaries of this channel. This is a strong indication of systematic movement and healthy trends in the stock.
The price has recently bounced off a key support level near the lower boundary of the channel around ₹179, and it’s currently sitting at ₹202. This suggests that the stock might be gearing up for another move toward the upper boundary of the channel.
Fibonacci Levels and Price Action Observations:
The Fibonacci levels plotted on the chart act as critical support and resistance zones. Let’s break this down:
Support levels : ₹179 is a major support level, being close to the S1 level and the lower channel line. Below that, ₹160 and ₹136 also serve as significant supports if the stock witnesses a deeper correction.
Resistance levels: On the upside, ₹225 and ₹237 are immediate hurdles. The ₹225 level aligns with the pivot and has seen price rejection multiple times in the past. Beyond this, ₹263, which is the R3 level, coincides with the upper boundary of the channel and serves as a long-term resistance target.
The price action suggests the stock has been consolidating near the middle of the channel, but with a tendency to test higher levels after each consolidation phase. This is a healthy sign of accumulation and consistent bullish interest.
Momentum Indicators – MACD: T
he MACD (Moving Average Convergence Divergence) indicator below the chart is signaling early bullish momentum: We can see a potential bullish crossover where the MACD line (blue) is about to cross above the signal line (orange). This is a classic signal for potential upward movement in the near term.
Additionally, the MACD histogram is beginning to turn positive, though it’s still in the early stages of a bullish signal. This suggests that while momentum is building, we need to wait for confirmation.
If the price breaks above the ₹225 resistance level with strong volume, it could lead to a rally toward ₹237, which is the next major resistance based on Fibonacci and channel projections.
If the bullish momentum sustains, the price might even target ₹263, the upper channel boundary. This move would signify a continuation of the long-term bullish trend.
It’s also possible that the stock might continue oscillating within the channel boundaries for some time, respecting the key Fibonacci levels for support and resistance. In such a case, we might see the price consolidating between ₹179 and ₹225 before making a decisive move.
I would consider entering long positions near the ₹179 support level or on a breakout above ₹225. The first target for this trade would be ₹237, followed by ₹263, depending on momentum and market conditions. Stop-loss for this trade could be placed slightly below ₹160 to manage risk effectively.

XAUUSD TRADE Idea for Thursday and Friday Session'sGold seems like some Range bound and little confusing but looking at each different TF we've got some levels for it to get trades near minor support is 2911 if it breaks then next major support zone is 2906 - 2909 may be we can see some ranging market from these level but if it breaks then next level's we can see is 2890 alternative scenario is if price goes upward then 2918 - 2920 is resistance if price crossed this level and sustained then it will go 2930 - 2933 level easily but also look for reversal patterns at these level it can work good in this instrument, all level's and zone plotted in the chart from there you can grab it .

Nifty 50 Index (1D, NSE) with several scenarioThe chart shows Nifty 50 Index (1D, NSE) with several plotted trendlines, channels, and support/resistance levels. Here's an analysis based on the drawings:
1. Trendlines & Channels
A major uptrend line (blue) has been drawn from the 2022 lows, acting as long-term support.
A falling wedge (blue channel) in the recent downtrend suggests a potential breakout if price moves above the upper boundary.
A similar falling wedge pattern from 2022 led to a strong breakout and rally, implying a similar scenario might play out.
2. Key Support & Resistance Levels
Master Breakout Level (Red, ~23,536.40) → Critical resistance, price needs to break above this for bullish confirmation.
Master Breakdown Level (Green, ~22,733.25) → Key support; if broken, it may lead to further downside.
Support Levels (~22,554.00 & 21,884.45) → Strong demand zones, possible bounce points.
Open GAP Support Levels (~20,409.75 & 19,291.45) → Unfilled gaps, which could act as magnets if the market corrects further.
3. Market Outlook
Bullish Scenario: If Nifty breaks above 23,536.40 with strong volume, it could lead to a new uptrend.
Bearish Scenario: A breakdown below 22,733.25 might trigger a decline toward 21,884 or lower.
The falling wedge breakout potential suggests a bullish bias unless the price loses support.

Nifty - Elliot Wave Date : 15.02.2025
Nifty Spot
Timeframe : Day chart
Nifty is under corrective phase & i have plotted internal waves for people's learning & understanding.
Regards,
Ankur

Axis Bank Outlook For SwingHello friends hope you all are doing well and trading well, so let's talk about the weekly chart of Axis Bank today which is not a trading idea but if you want to take a trade in it then maybe you can get some help from the view I am sharing.
So first of all I would like to tell you that in the last working day we saw a big fall in the share price due to the quarterly results presented by the company but if we talk about the technical setup here then as you can see that the price has almost come to the demand zone so in such a situation we can expect a bounce from here and for this we all should follow our respective time frames and our respective setups. I have also plotted Fibonacci retracement and 200 day moving average on this chart which is an important level supporting the support zone, both are free indicators provided by Tradingview you can use in your trades too.
If there is confirmation of bounce on any setup then we can keep a target of 10 to 15 percent for this bounce and can also set our stop loss accordingly. So I will share my trade active target and stop loss in the next update.
Best Regards- Amit.

Tata Power Date 05.02.2025
Tata Power
Timeframe : Day Chart
Remarks :
1 Forming bearish pole & flag pattern
2 Forming descending triangle flag
3 Pole & flag is supported by 5-3-5-3-5 wave pattern
4 Enter "shorts" moment price exits from flag
5 Keep targets as per extension drawn/plotted on charts for you all
6 Ideally wait for price to exit form descending flag, don't enter short in anticipation in advance
Regards,
Ankur

DELTA CORP LTD - READY TO GAMBLE? :)Hello, Everyone I hope you all will be doing well in your life and your investing AND YOUR GAMBLING :) as well. Here I have brought a stock that looks at bottom and ready to change trend. Delta Corp Ltd is the name of the stock. CMP is 128. Strong support at 110. It made low of 104.45 in June 24. If it breaks 110 by chance than it may touch 80 to 85. That looks slightly doubtful but anything can happen in Stock Market. Its difficult to predict. I know it’s tough but still I’m trying 😊. Upside target as per Fibbo 180, 225, 260, 290, 340, 400.
Just an assumption. Please do you research. Not a suggestion of buying. As I told This is Stock Market.
Source: Screener.in
Delta Corp Ltd
About
Delta Corp is currently operates in the Gaming, Hospitality and online skill gaming segment.(Source : 202003-01 Annual Report Page No:113)
Key Points
Business Mix
1) Casino Gaming (80% in Q1 FY25 vs 71% in FY22): The company has a major market share in Goa, with a net capacity of 2,000 gaming positions. It owns 3 of the 6 offshore gaming licenses issued in Goa, 2 land-based casinos in Goa, and one in Sikkim, including Deltin Royale and Deltin JAQK, among the country’s 2 largest offshore casinos. The segment gross revenue grew by 50% between FY22 and FY24. The YoY growth in FY24 was flattish due to the divestment of a casino in Nepal, and dry docking of a casino vessel for nearly 5 weeks.
2) Online Gaming (15% in Q1 FY25 vs 21% in FY22): The company owns and operates the online poker site Adda52.com. The segment gross revenue declined by 9% YoY between FY22 and FY24, due to a substantial increase in GST, since October 2023.
3) Hospitality (5% in Q1 FY25 vs 8% in FY22): The company owns and operates 2 hotels including Deltin Suites, a 106-room, all-suite hotel with a casino in Goa, and The Deltin, a 176-room, a five-star integrated resort spread over more than 10 acres at Daman. This segment's revenue declined by 17% between FY22 and FY24.
GST Demand: The GST authorities issued a notice to Delta Corporation and its subsidiaries demanding tax on the entire "betting value" rather than on the net gaming revenue (i.e., the commission or fee that the casino earns). The tax authorities argue that the total face value of bets placed by players should be taxed at 28%.
Tax Base Dispute: Delta Corporation contends that only the gross gaming revenue (GGR) or the rake (i.e., the commission earned by the company) should be subject to GST, not the entire value of bets placed. The difference between taxing the total betting value and the rake is substantial and has led to 23,200 Crs of Contingent Liability.
Entry into Real Estate
The company has formed a strategic partnership with Alpha Alternatives Fund Advisors LLP and Peninsula Land for real estate development. This Real Estate Fund will invest Rs. 765 Cr in residential redevelopment projects, land parceling in the MMR region, and plotted developments around Mumbai, Alibaug, Khopoli, Karjat, and Pune. The company’s contribution to the real estate platform is up to Rs. 90 Cr.
Expansion
The company has planned a capex of Rs. 350 Cr, in the casino business, it is replacing its “Kings Casino” with a new vessel, which will double its gaming positions to 4,000, it is projected to start commercial operations in Q4 FY25.
It is also constructing a 450-room hotel in Goa, with a capex of Rs. 450 Cr, and is likely to start operations by Q4 FY26.
Integrated Resort Project
The company plans to build an integrated resort on 100 acres in Dhargalim, Goa, near the new Mopa airport. The resort will include a 5-star hotel, electronic casino, theme park, mall, gaming zones, and recreational areas. Although all approvals are in place, the project is on hold due to GST issues. By January 2024, the company had invested around Rs. 170-180 Cr in the project.
Divestment
The company has divested its stake in Deltin Casino International in Nepal by the sale of a 100% stake in Caravella Entertainment Pvt Ltd, for an enterprise value of Rs. 80 Cr.
IPO of Subsidiary
Delta Tech Gaming Limited, a WOS of the company, had filed a draft red herring prospectus in June 2022. This IPO has been put on hold due to ambiguity.
Delta corp Demerger: How many shares will investors receive?
The company revised its demerger scheme, transferring the Dhargal project to Deltin Hotel & Resorts and other hospitality and real estate businesses to Delta Penland, maintaining a 1:1 share entitlement ratio.
A significant corporate restructuring is set to reshape the landscape of a hospitality and real estate enterprise in the gaming industry. The strategic demerger promises to unlock value for investors by strategically separating core business segments into distinct entities.
Investors are poised to witness a transformative corporate move that will redistribute assets and create focused operational streams.
Share Price Movement
The share price of Delta Corp Limited went up by 2.2 percent to Rs. 125.42 per share on Monday, an increase from its previous close of Rs. 122.65 per share. The market capitalisation now stands at approximately Rs. 3,314 crore as of December 09, 2024.
What happened
The revision of the Composite Scheme of Arrangement involves the demerger of Delta Corp Limited’s Hospitality and Real Estate Business into Delta Penland Private Limited (DPPL). This includes the Dhargal Project in Goa. The project will require significant capital investment and will be managed as a separate legal entity. The share entitlement ratio remains 1:1, with DPPL issuing one new equity share for each existing Delta Corp. share held. The revised scheme is subject to regulatory approvals.
Q2 Financial Highlights
According to its recent filing, in the quarter ending September 2024, Delta Corp’s consolidated revenue from operations has declined by 27.9 percent YOY from Rs. 261 crore in Q2 FY24 to Rs. 188 crore in Q2 FY25 and increased by 3.86 percent QoQ from Rs. 181 crore in Q4 FY24.
The company’s consolidated net profit has declined by 60.8 percent, from Rs. 69 crore in Q2 FY24 to Rs. 27 crore in Q2 FY25. As compared to the last quarter of 2025, the company’s net profit has increased by 22.7 percent QoQ from Rs. 22 crore.
Market Outlook
The casino industry in India, particularly in Goa and Sikkim, is expanding, boosting local economies and tourism. Goa, known for its vibrant casino culture, and Sikkim, with its growing gaming facilities, contribute significantly to state revenues through taxes and tourism spending. Despite challenges like social responsibility.
The industry is set for growth due to rising income levels, technological advancements, and changing regulations. Online gaming, a key growth driver, has also seen a substantial rise, with millions of new users and increased revenue from casual and transaction-based games.
Shareholding Pattern
As of the December 2024 shareholding pattern, Delta Corp Limited is primarily held by the promoters at 33.26 percent, foreign institutional investors hold 1.25 percent, and the public with 56.87 percent.
About Company
Delta Corp Limited is a key player in the Indian gaming industry, spanning casino, online gaming, and hospitality sectors. Founded in 1990 as a textiles and real estate consultancy, Delta Corp. has diversified its business portfolio significantly. Headquartered in Mumbai, it is the only publicly listed company in India that specialises in live electronic and online casino gaming, solidifying its leadership in the organised gaming sector.
Delta Corp. operates through three main divisions. In casino gaming, it manages several major offshore casinos like Deltin Royale and Deltin JAQK, along with land-based options such as Deltin Suites in Goa. In online skill gaming, Delta Corp oversees popular platforms including Adda52.com, Adda52Rummy.com, and Adda.games. In the hospitality space, it owns luxury hotels such as The Deltin in Daman and Deltin Suites in Goa. Delta Corp remains committed to innovation and customer experience, aiming to sustain its leadership in the Indian gaming industry.
This is just to boost my confidence. No Suggestions for buying.
Disclosure: I am not SEBI registered. The information provided here is for educational purposes only. I will not be responsible for any of your profit/loss with these suggestions. Consult your financial advisor before making any decisions.

Next Possible Gold (XAUUSD) Movement 28-JAN.Fundamental effect on gold :
• Gold Price Movement:
o Gold remained steady around $2,730 per ounce on Tuesday, following a recent decline.
o Traders are anticipating the Federal Reserve’s two-day policy meeting starting later today.
• Federal Reserve Expectations:
o The Fed is expected to leave interest rates unchanged.
o Market focus will be on Fed Chair Jerome Powell’s speech for guidance on future policy.
o Attention also on the Fed's response to President Trump’s calls for interest rate cuts.
• Impact of Inflation and Policy:
o Trump’s inflationary policies could lead the Fed to maintain higher rates.
o Higher rates may reduce gold’s appeal as an inflation hedge.
• U.S. Dollar Influence:
o A stronger U.S. dollar added additional pressure on gold prices.
o Dollar strength was driven by market reactions to Trump’s latest tariff threats
Key Observations
1. Chart Patterns: The Head and Shoulders pattern (third chart) signals a potential bearish reversal. The neckline has been broken, which could indicate further downside. The price has pulled back to retest the neckline area at 2748–2753, aligning with the Golden Fibonacci level (0.618). A confirmation is needed through candlestick patterns for the next move.
2. Fibonacci Retracement Levels (first chart):
The retracement levels plotted suggest:
0.382 level at 2746.67
0.5 level at 2751.61
0.618 level at 2755.83
These are key areas to watch for price rejection or continuation.
3. Trendline and Channel (second chart):
o The price has broken out of the ascending channel, confirming a bearish bias.
o The POI (Point of Interest) level around 2730 aligns with key support.
4. Dynamic Support:
o The 200-period Moving Average acts as dynamic support around 2733.
Support Zones:
1. 2733–2735:
o Near the 200-MA and aligns with previous consolidation. Likely to act as immediate support.
2. 2730–2720:
o A strong support zone reinforced by Fibonacci extension levels and day support.
3. 2704–2700:
o The next major support level if the bearish move continues. Watch for a potential reversal or price reaction here.
Resistance Zones:
1. 2748–2753: Retest zone of the neckline and Fibonacci 0.618 level. Price may face selling pressure here.
2. 2755–2760: Fibonacci cluster and prior resistance zone.
3. 2770–2780: Top of the previous range and the upper boundary of the broken ascending channel.
Actionable Insights:
• Bullish Scenario:
• If the price breaks above 2753 with strong candlestick confirmation, it may target 2760–2770.
• Bearish Scenario:
• A rejection at 2748–2753 or failure to hold 2730 could push the price toward 2700.
• Neutral Strategy:
• Wait for confirmation at the neckline retest zone (2748–2753) to determine direction.
• Monitor candlestick formations, such as engulfing or pin bars, near support and resistance levels.
Summary:
• Support: 2733–2735, 2730–2720, 2704–2700
• Resistance: 2748–2753, 2755–2760, 2770–2780
• The bearish trend remains intact unless the price reclaims 2753 convincingly. For now, focus on the retest zone and confirm the trend direction before entering a trade.
Stay tuned for updates once the confirmations are in place!
Please support me with your likes and comments to motivate me to share more
analysis with you and share your opinion about the possible trend of this chart
with me !
Best Regards , Silver Wolf Traders Community
Disclaimer: This is for educational purposes only. Always trade responsibly and
manage your risk effectively

Possible Wave Counts on Daily Time Frame Chart of DXYMost investors treat trading as a hobby because they have a full-time job doing something else.
However, If you treat trading like a business, it will pay you like a business.
If you treat like a hobby, hobbies don't pay, they cost you...!
In this study we used Elliott Wave Theory & Structures, here we have plotted possible wave counts on daily time frame chart of DXY Dollar Index, it involves multiple possibilities, and the analysis presented focuses on one potential scenario. The provided information is for educational purposes only, not trading advice. There's a risk of being completely wrong.
I am not Sebi registered analyst.
My studies are for educational purpose only.
Please Consult your financial advisor before trading or investing.
I am not responsible for any kinds of your profits and your losses.
Hope this post is helpful to community
Thanks
RK💕
Disclaimer and Risk Warning.
The analysis and discussion provided on in.tradingview.com/u/RK_Charts/ is intended for educational purposes only and should not be relied upon for trading decisions. RK_Charts is not an investment adviser and the information provided here should not be taken as professional investment advice. Before buying or selling any investments, securities, or precious metals, it is recommended that you conduct your own due diligence. RK_Charts does not share in your profits and will not take responsibility for any losses you may incur. So Please Consult your financial advisor before trading or investing.

IRCTC falling wedge pattern price near supportIRCTC has formed a falling wedge pattern.
Price trading near support zone.
Pattern base range target and Stop loss plotted on chart.
Volume also dried, showing selling is minimal.
Disclaimer : chart share here is education purpose only. not buy and sell recommendation give on stock.

USDJPYThe chart shows the USD/JPY exchange rate over time. The data shows a slight upward trend from September to February, with some fluctuations. Two dashed trendlines are plotted on the chart, suggesting a potential upward channel. The volume is shown at the top left, indicating trading activity. The current bid price is 156.552 and the ask price is 156.563. The high for the period shown is 158.874 and the low is 139.576. The chart uses candlestick patterns to represent price movements over various time intervals.

Power and transformer sector trend in IndiaAs demand for power (renewable energy) demand keeps increasing, due to surging power demand domestic and industrial, with go green initiative and new sectors like data centers and EV's. keep an eye on major players in transmission and transformer sector, As India tends to invest heavy in transmission and EPC sector, I have plotted some major stocks that still have gas to go to moon. keep an eye on TARIL & SHILCHAR. this is one year performance in this high growth sector.

ADANIPORTS Analysis: Breakout Potential and Key LevelsIndicators:
MACD is plotted, showing divergence and momentum.
Fibonacci Pivot levels (S1, S2, S3, R1, R2, R3) are visible.
Trend: The price appears to be in a descending channel (blue trendlines), indicating a bearish trend within the broader price movements.
Current Price: Approximately 550.25 INR.
Breakout Potential: The price seems to be approaching the upper boundary of the descending channel, hinting at a potential breakout.
Key Levels:
Support Levels (Fibonacci): S1 (near 450 INR), S2 (around 300 INR), S3 (below 200 INR).
Resistance Levels (Fibonacci): R1 (near 700 INR), R2 (around 850 INR), R3 (above 1,000 INR).
Next Potential Target if Breakout Occurs: A breakout from the channel might target R1 (~700 INR), which is also aligned with the previous resistance zone.
MACD Analysis:
The MACD histogram shows a reduction in bearish momentum.
A potential bullish crossover might occur, signaling a shift towards an uptrend.
Next Stop Loss and Target:
Stop Loss: Place it just below the current support level, around S1 (~450 INR).
Immediate Target: If a breakout occurs, the next target is R1 (~700 INR).
Further Target (if momentum sustains): R2 (~850 INR).
Key Risks:
If the breakout fails, the stock might retest lower Fibonacci levels (e.g., S2 at ~300 INR).
Confirm volume and broader market trends before assuming a breakout.
Summary:
Breakout Potential: High near the upper boundary of the descending channel.
Next Stop Loss: Around 450 INR.
Immediate Target: 700 INR.
Further Target: 850 INR if the momentum sustains.
Bearish Breakdown Risk: Below 450 INR, look for support near 300 INR
