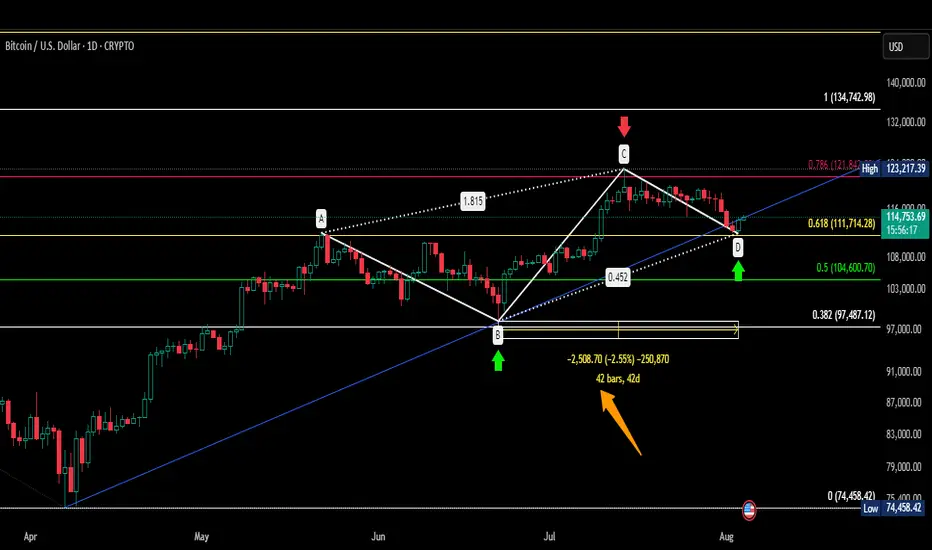
BTC TAKEN REVERSAL AS GANN TIMEAs per gann time rule BTC trying to reverse but there is not necessary that this reversal may sustain because time can vary.
1 sustainabily will depend on this low should not break for next 5 days as per my knowledge.
2. Here is a trend line in blue colur which may work as support.
3 If you see this chart there is a pattern ploted in which D is almost 50% of BC.
4 In this pattern A is previous swing high working as support .
5 You can see orrange arrow which is time taken to form this pattern.
remember this is not my buy/sell call.
Search in ideas for "PLOT"
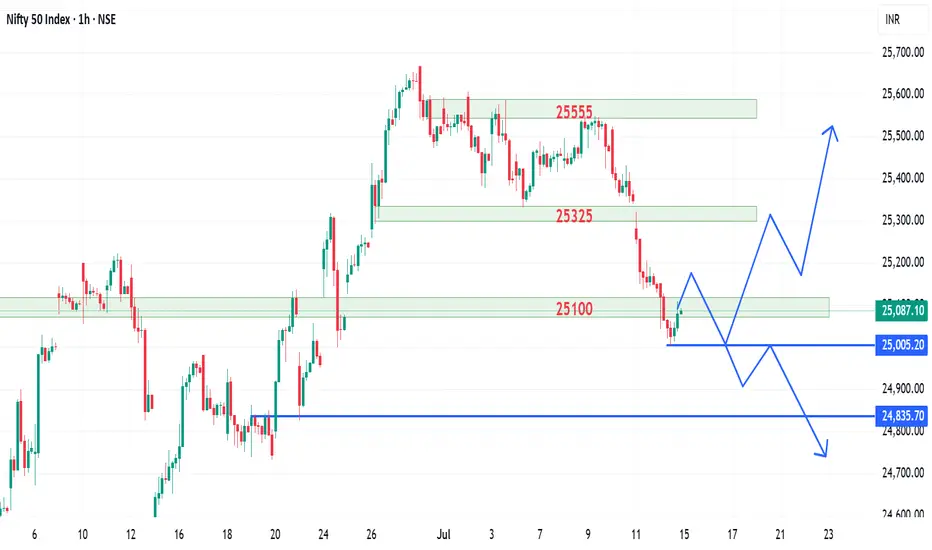
Nifty possible movement for the upcoming trading session.Nifty closed around the support zone forming a long lower tail showing some bullishness today.
Though the market has moved after a long time and can move on the either side.
Levels are marked and possible movements are also plotted.
Wait for the price action and trade accordingly.
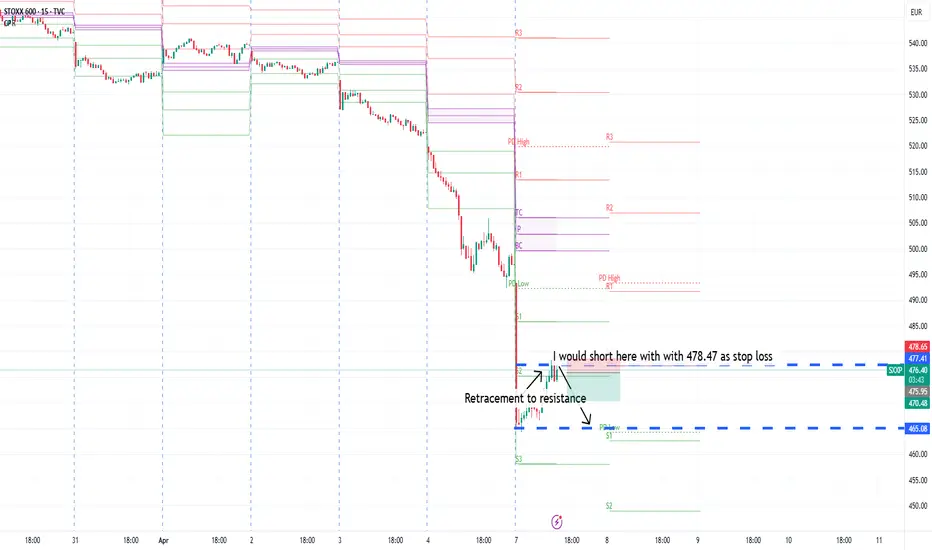
SXXP (Europe Market) Intraday 07/04/2025Chart reading and plotting is an universal concept that remains the same irrespective of index. All trades are to be considered as a probability and not a definitive move. Hence stop loss is important.
If you want to learn plotting support and resistance lines, just don't practise on Nifty charts.....go and explore the other markets too. Your learning curve will be exponential. You will eventually understand that technical/price analysis is universal and not local.
Trading psychology:
Stock market is not a place to showcase your emotions. No revenge trading.....PERIOD!
Regards,
Uday
CHALET - LONGSupport and Resistance Zone:
The yellow highlighted area represents a key resistance zone around ₹800.
Price recently broke above this resistance, which now acts as support — a bullish breakout signal.
Measured Move Target:
The chart shows a measured move of approximately ₹149.70 (22.27% gain) from the breakout point.
The target from this breakout is marked at ₹971.55 (18.20% above the breakout zone).
Moving Averages:
A short-term EMA (red) and a medium-term EMA (green) are plotted.
The price is trading above both EMAs, confirming an uptrend.
Volume:
A significant increase in volume on the breakout candle — confirming strong buying interest.
Entry and Exit Strategy:
✅ Entry:
Ideal entry was on the breakout above ₹800, confirmed by a strong green candle with high volume.
A pullback to the breakout zone (~₹800–810) can provide a secondary entry opportunity.
🚀 Target:
First target = ₹971.55 (measured move projection).
You can also trail your stop-loss to ride further upside if momentum continues.
❌ Stop-Loss:
Place a stop-loss below the breakout zone at around ₹780 to ₹790.
A close below this level would invalidate the breakout.
Projection:
The projected path (black line) shows a possible pullback before further upward movement — suggesting a bullish continuation pattern.
This analysis is for educational purposes only and should not be considered financial advice. Trading involves significant risk, and past performance does not guarantee future results. You are responsible for your trading decisions—always manage your risk carefully.

LUPINThe chart shows the daily price action of Lupin Ltd on the NSE, with 10-day, 20-day, and 200-day exponential moving averages (EMAs) plotted. The price had been in a downtrend since January 2025, as indicated by the descending trendline connecting the series of lower highs. Currently, the price is testing this trendline, suggesting that it is at a key resistance level. The 10-day and 20-day EMAs have recently turned upward, indicating that short-term momentum is improving. The price has also crossed above both the 10-day and 20-day EMAs, which signals growing bullish strength. Moreover, the price is now trading near the 200-day EMA, which acts as a major dynamic resistance level. A successful breakout above the trendline and the 200-day EMA with strong volume could confirm a bullish trend reversal. However, if the price fails to break the trendline and the 200-day EMA, it may face selling pressure, leading to a continuation of the existing downtrend. The rising volume over the past few sessions supports the possibility of a breakout, but confirmation would require sustained price action above the trendline and the 200-day EMA.
Long trade setup:
Entry: A breakout above the trendline and 200-day EMA, ideally above 2070 with strong volume confirmation.
Target 1: 2140 (previous swing high).
Target 2: 2200 (psychological resistance).
Target 3: 2250 (major resistance zone).
Stop-loss: Below 1980 (recent low and 20-day EMA).
Short trade setup:
Entry: If the price gets rejected at the trendline and starts reversing below 2000.
Target 1: 1950 (support from recent consolidation).
Target 2: 1880 (previous swing low).
Stop-loss: Above 2075 (trendline and 200-day EMA breakout point).
Volume has been increasing, which supports the potential for a strong breakout. Waiting for a decisive close above the trendline with increased volume would improve the odds of a successful long trade. Conversely, if the price faces rejection and shows weakness near the trendline, a short trade could offer a favorable risk-reward ratio.
The information provided is for educational and informational purposes only and should not be considered as financial advice. Trading and investing in financial markets involve risk, and past performance is not indicative of future results. Always conduct your own research and consult with a qualified financial advisor before making any trading or investment decisions. The author is not responsible for any losses incurred as a result of using the information presented.

EICHERMOT Breakdown TREND LINE 17/02/2025Timefram : Daily , Exchange : NSE India ,Symbol : EICHERMOT last year continue up trend higher high ploted . Today breakdown this trend line . Next down side support is 4270

Campus Activewear Buy 315 Tgt 350 Observation: Bullish Pattern observed on 1 day interval chart plot. CUP Handle formation, breakout above resistance, volume spike.
A strong bullish reversal indicator, suggesting potential upward movement. The stock has broken out above resistance, confirming the bullish pattern. Additionally, the volume spike supports the upward breakout, indicating buying interest.

#banknifty breakout!! - 4th December NSE:BANKNIFTY NSE:BANKNIFTY1!
This chart represents the Bank Nifty index on an hourly timeframe. It provides a technical analysis of price movements with a focus on key levels and trends.
1. Key Levels:
The chart highlights resistance levels such as 52,811.25 and 53,117.75, where the price may
face selling pressure.
• Support levels like 52,308.55 and 52,109.00 indicate areas where buying interest could
emerge, helping to prevent the price from falling further.
2. Trendlines:
• Two trendlines are plotted. One shows an upward trend (a support line) that connects lower
price points, while the other represents a resistance trendline that connects the highs of the
price movement.
3. Price Breakout :
The note on the chart highlights that Bank Nifty has closed above 52,575.75 on the daily
timeframe, marking a potential breakout. This suggests bullish momentum and possibly
further upward movement.
4. Possible Scenarios:
The chart suggests that Bank Nifty could continue to rise, testing resistance at higher levels.
Alternatively, it might pull back to retest support before moving higher again.
This analysis shows a positive outlook for Bank Nifty, with the breakout above key resistance
indicating potential upward movement. Traders should watch for confirmation of further price action and consider the support and resistance zones.
Note: not SEBI Registere.

DCM Shriram rounding base patternDCM Shriram has formed a rounding base pattern
If stock breaks resistance it will move upside.
Pattern base target plotted.
Disclaimer :
Chart shared here is for education purpose only, no any buy and sell recommendation given on stock.

BANKNIFTY Intraday Trade Setup For 3 Oct 2024BANKNIFTY Intraday Trade Setup For 3 Oct 2024
Bullish-Above 53250
Invalid-Below 53140
T- 53850
Bearish-Below 52800
Invalid-Above 52910
T- 52200
BANKNIFTY has closed on a slight bearish note last day with 0.1% cut. Index may give a bounce only if there is a gap up and 10 o'clock range breaks in the upside or else it will be a sell on rise market. Best trade looks in the downside below 52800 on a flat opening. Next important confluence looks near 52170-200 zone as per ABCD plotted.
Coming to Thursday's trade setup, if index opens flat and a 15 Min candle closes above 53250 then we will long for the target of 53850.
For selling we need a 15 Min candle close below 52800. T- 52200.
In case of a big gap up/down, wait till 10 o'clock and mark the high and low of the trading range (5MIN). Trade on this range breakout.
==========
I am Not SEBI Registered
This is my personal analysis for my personal trading. Kindly consult your financial advisor before taking any actions based on this.

Bajaj AutoImportant points ploted in the chart.
*Investments in security market are subjected to market risk do own research before investing.

NHPC LTDImportant points ploted in the chat.
*Investing in security market is subjected to market risk do own research before investing.

NIFTY Intraday Trade Setup For 9 Jul 2024NIFTY Intraday Trade Setup For 9 Jul 2024
Bullish-Above 24350
Invalid-Below 24300
T- 24550
Bearish-Below 24230
Invalid-Above 24280
T- 24030
NIFTY has closed on a flat note today, complete rangebound session within 100 points range. It has formed a Pinbar candle in daily TF. Above today's high there can be a good upside move towards 24550 as per 1.618 extension plotted. Since the daily candle is a price rejection candle and represents bullishness, below its low 24230 there can panic selling move towards 24k zone. Sentiment is bullish till it closes above PDL.
Coming to Tuesday's trade setup, if index opens flat and a 15 min candle closes above 24350 then we will long for the target of 24550.
For selling we need a 15 Min candle close below 24230. T- 24030.
In case of a big gap up/down, wait till 10 o'clock and mark the high and low of the trading range (5MIN). Trade on this range breakout.
==========
I am Not SEBI Registered
This is my personal analysis for my personal trading. Kindly consult your financial advisor before taking any actions based on this.

BANKNIFTY Intraday Trade Setup For 02 Feb 2024BANKNIFTY Intraday Trade Setup For 02 Feb 2024
Bullish-Above 46320
Invalid-Below 46210
T- 46826 47315
Bearish-Below 45650
Invalid-Above 45760
T- 45050 44390
BANKNIFTY has closed on a on bullish note with 0.42% gain. It was sideways to bullish, complete sideways after 12 PM. Premiums crashed like anything due to VIX crashing nearly 10%. No big moves seen on event day. It has closed near day high so above 46320 tomorrow there can be good upside move till 46826 as per ABCD plotted. In case it breaks 45650 is broken then there can be good selling.
Coming to Friday's trade setup, if index opens flat and a 15 Min candle close above 46320 then we will long for the target of 46826 and 47315.
For selling we need a 15 Min candle close below 45650. T- 45045 and 44390.
In case of a big gap up/down, wait till 10 o'clock and mark the high and low of the trading range (5MIN). Trade on this range breakout.
==========
I am Not SEBI Registered
This is my personal analysis for my personal trading. Kindly consult your financial advisor before taking any actions based on this.

profitable
Certainly! However, it's important to note that writing a profitable trading strategy requires careful consideration, testing, and validation. Pine Script is the scripting language used in TradingView for creating custom indicators and strategies. Here's a simple example of a Moving Average Crossover strategy in Pine Script:
pinescript
Copy code
//@version=5
strategy("Moving Average Crossover", overlay=true)
// Define input parameters
fastLength = input(9, title="Fast MA Length")
slowLength = input(21, title="Slow MA Length")
src = close
// Calculate moving averages
fastMA = sma(src, fastLength)
slowMA = sma(src, slowLength)
// Plot moving averages
plot(fastMA, color=color.blue, title="Fast MA")
plot(slowMA, color=color.red, title="Slow MA")
// Strategy logic
longCondition = crossover(fastMA, slowMA)
shortCondition = crossunder(fastMA, slowMA)
// Execute strategy
strategy.entry("Long", strategy.long, when=longCondition)
strategy.entry("Short", strategy.short, when=shortCondition)
This script defines a simple moving average crossover strategy. When the fast moving average (blue line) crosses above the slow moving average (red line), it triggers a long entry, and when the fast moving average crosses below the slow moving average, it triggers a short entry. This is a basic example, and you should thoroughly backtest and optimize any strategy before considering it for live trading.
Remember, trading involves risk, and no strategy can guarantee profits. Always practice good risk management and consider seeking advice from financial professionals before engaging in live trading.

BANKNIFTY Intraday Trade Setup For 22 Dec 2023BANKNIFTY Intraday Trade Setup For 22 Dec 2023
Bullish-Above 47950
Invalid-Below 47840
T- 48335 48750
Bearish-Below 47330
Invalid-Above 47440
T- 46915 46485
BANKNIFTY has closed on a bullish note with 0.83% gain today. Yesterday it was said that there is a probability of pullback which happened very effectively. Only problem was the gap down opening and sell triggered which hit sl. However 10 o'clock range was to be used and range broke upside above 47250 and reached till yesterday's half bat plotted. As the Vix has shot up the volatility is insane in the last 2-3 days. 47950 and 47330 are important levels for tomorrow's session.
Coming to Friday's trade setup, if index opens flat and a 15 Min candle closes above 47950 then we will long for the target of 48335 and 48750.
For selling we need a 15 Min candle close below 47330. T- 46915 and 46485.
In case of a big gap up/down, wait till 10 o'clock and mark the high and low of the trading range (5MIN). Trade on this range breakout.
==========
I am Not SEBI Registered
This is my personal analysis for my personal trading. Kindly consult your financial advisor before taking any actions based on this.

DIVISLABDivis laboratories is forming inverted head and shoulder. Currently in right shoulder plotting. Now Price is too cheap. Price have good movement Safe trader wait for 3810 level close. Or Enter here also. Target is 4450.

Navkar corp -Multi year Cup and Handle FormationNavkar Corporation formed a multi year cup and handle formation.
Stop loss and targets are plotted.
Educational content. Not a recommendation

Investment Opportunity after a healthy correctionI have been tracking Nifty since months, to exploit investment opportunity. It is always better to invest (in the market) after a correction. You get competitive prices which results in potentially more upside (returns).
The indicator ploted here is Bollinger bands in weekly time frame. You may see that every time Nifty hit lower Bollinger bands, eventually it bounced back up. So, there is a high probability that "history will repeat itself".
So, if you were waiting for right time to invest in, this is the time (only when Nifty touches lower Bollinger bands).
Pickup the fundamentally strong companies (at least 10 companies) and invest "equal amount" in each of them. Or you can consider buying any Nifty 50 ETF (if you are very conservative/not an experienced).
It may also happen that the Nifty will correct (19% from the highs, somewhat around 15090). So, please be ready for this.
Remember, the market will "not jump as soon as you buy a stock". It may "fall even more" and/or consolidate for some weeks/months. It "does not mean sell". STAY INVESTED.
Disclaimer: I am not a SEBI certified investment advisor. The facts and suggestion given in the above article is based on my understanding and experience in the markets. Please consult your financial advisor before investing.

Bank Nifty trade plan for 23 NOV 2023Bank Nifty trade plan for 23 NOV 2023
Nifty is structurally bearishly aligned for the day and is expected to within the yesterday's range with a small gap up.
In case Bank Nifty fails to break out the upper resistance band on morning session then we can anticipate bank Nifty to trade in a range for the day and can expect to test out lower band as plotted.
Any resistance from Previous day close will be opportunity to short for previous day low.

Nifty trade plan for 23 NOV 2023Nifty trade plan for 23 NOV 2023
Nifty is structurally moderately bullishly aligned for the day and is expected to within the yesterday's range with a small gap up.
In case Nifty fails to break out the upper resistance band on morning session then we can anticipate Nifty to trade in a range for the day and can expect to test out lower band as plotted.

BANKNIFTY Intraday Trade Setup For 15 Nov 2023BANKNIFTY Intraday Trade Setup For 15 Nov 2023
Bullish-Above 44060
Invalid-Below 43950
T- 44287 44530
Bearish-Below 43680
Invalid-Above 43790
T- 43475 43260
BANKNIFTY has closed with a slight cut of 0.24% last day. In the weekend pullback scenario was discussed and half bat was plotted. Monday view matched and scenario turned into reality. Although it has closed with a slight cut but in daily TF it has formed a Pinbar candle so above 43980 it will have bullish stance. Below 43680 trendy downside move may initiate. 44287-300 is first resistance for tomorrow's session.
Coming to Wednesday's trade setup, if index opens flat and a 15 min candle closes above 44060 then we will long for the target of 44287-300 and 44530.
For selling we need a 15 Min candle close below 43680. T- 43475 and 43260.
In case of a big gap up/down, wait till 10 o'clock and mark the high and low of the trading range (5MIN). Trade on this range breakout.
==========
I am Not SEBI Registered
This is my personal analysis for my personal trading. Kindly consult your financial advisor before taking any actions based on this.

BANKNIFTY November 09, 2023Descending Triangle Pattern Emerging in Bank Nifty 15-Minute Chart
The trading session for the NSE:BANKNIFTY commenced with a bearish sentiment, and the ongoing tug-of-war between bulls and bears has resulted in the formation of a descending triangle pattern. This pattern is typically associated with bearish tendencies. However, it can also signal a period of consolidation where the support is too strong, potentially leading to a trend reversal.
To assist in identifying potential trading opportunities, key support and resistance levels have been plotted. It is crucial to exercise caution and only enter positions once the trend becomes evident.
Please consider liking and following for further technical analysis insights.
