GBPUSD – Medium-Term H1/H4 Technical Outlook
Overview: GBPUSD has recently broken below its ascending trendline/channel after failing to sustain momentum near the 1.3530–1.3575 supply zone. At present, price is testing the 0.618 retracement (~1.3366), while the RSI (5) is heavily oversold (~13–14). This signals the possibility of a short-term bounce before the broader bearish bias resumes.
For Indian traders who follow GBPUSD closely, the focus should remain on selling rallies into resistance while being open to buying intraday dips at clearly defined liquidity levels.
Market Structure & Key Observations
Trendline Break: The bullish channel has been violated, shifting momentum to a “sell-the-rally” strategy.
Resistance Zones: 1.3537 and 1.3453–1.3428 (strong supply levels).
Support Zones: Initial support at 1.3366 (Fib 0.618) and 1.3319; major demand lies at 1.3143–1.3093.
Momentum Check: Deep oversold RSI could trigger corrective recoveries, making intraday scalps attractive.
Trading Plan
Sell the Rally – Primary Bias
Entry: 1.3500 – 1.3510
Stop Loss: 1.3550
Take Profit: 1.3480 – 1.3466 – 1.3445 – 1.3430
📌 Idea: Short entries on retest of broken structure. Only invalid if we see a 4H close above 1.3550.
Buy the Dip – Intraday Scalping
Entry: 1.3310 – 1.3330
Stop Loss: 1.3290
Take Profit: 1.3355 – 1.3368 – 1.3390 – 1.3410
📌 Idea: Quick long trades from liquidity near 1.3319, targeting minor resistance.
Buy Deeper Liquidity Sweep – Swing Setup
Entry: 1.3090 – 1.3110
Stop Loss: 1.3050
Take Profit: 1.3135 – 1.3160 – 1.3200 – 1.3240
📌 Idea: If the market flushes into the 1.3143–1.3093 demand zone, expect stronger bounce potential.
Risk Management & Invalidation
Above 1.3550 (4H close) → Bearish bias invalidated.
Strong breakdown below 1.3310 → Skip scalps, focus on deeper buy zones.
Partial profit booking at each target is recommended to protect capital.
Search in ideas for "SCALP"

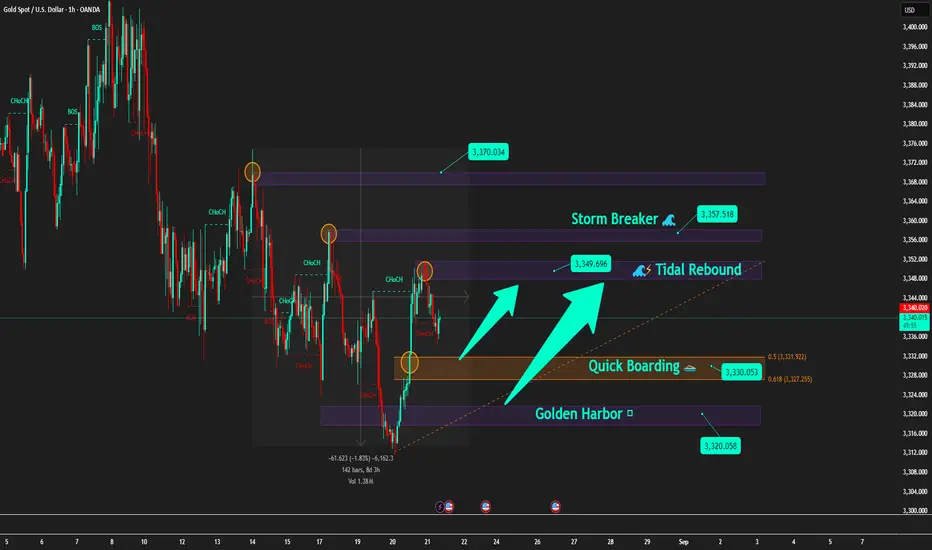
Gold after FOMC: Just a pullback or the start of a new wave?[Background
After the early morning FOMC session , Gold is showing signs of a sell-side pullback to gain momentum.
On higher timeframes (H4–D1), the structure remains bearish with lower highs .
However, consistent buying pressure around 3320 – 3330 keeps this zone as the key battlefield .
🪙 Key Levels Today
🔹 Storm Breaker 🌊 (Sell Zone 3357 – 3355)
SL: 3362
TP: 3350 → 3345 → 3340 → 33xx
🔹 Tidal Rebound 🌊⚡ (Sell Scalp 3349 – 3347)
SL: 3353
TP: 3345 → 3340 → 3335 → 33xx
🔹 Quick Boarding 🚤 (Buy Scalp 3330 – 3328)
SL: 3322
TP: 3335 → 3337 → 3339 → 3341
🔹 Golden Harbor 🏝️ (Buy Zone 3320)
SL: 3313
TP: 3325 → 3330 → extend further
📌 Trading Scenarios
After FOMC, the market may show rebound waves .
During Asia–Europe, price may consolidate between 3345 – 3357 .
If price tests Storm Breaker 🌊 → Prioritise Sell setups in line with the main bearish trend.
If price drops to Quick Boarding 🚤 or Golden Harbor 🏝️ → Short-term Buy scalps on pullback moves.
📰 Market Context
FED remains dovish leaning , with high probability of a rate cut in September (~82%, CME FedWatch) .
Geopolitical variables (Trump–Putin, Ukraine) remain unpredictable and may spark sudden volatility.
⚓ Captain’s Note
"Let Storm Breaker 🌊 test the buyers’ strength. Those who board at Golden Harbor 🏝️ will be lifted by the waves, but those who drift into the storm will soon feel the sea’s fury."
Gold – ABC Correction Wave in Play (July 24)Gold – ABC Correction Wave in Play (July 24)
📉 Technical Analysis
Following yesterday’s sharp drop, gold reacted well around the 3375–3377 zone, which was our scalping buy area, producing a bounce of over 10 dollars. However, this level is more likely a temporary resistance, potentially forming Wave B of an ABC correction, and is not suitable for long-term buys at this stage.
After breaking below the H4 trendline, price has re-entered the zone, showing clear signs of retracement momentum. This supports the view that gold is entering a correction phase, with the 333x zone likely to act as the next downside target.
🎯 Trading Plan – July 24
🔻 Sell Setups (aligning with the current correction):
Scalping Sell:
▶️ Entry: 3388 – 3390
▶️ SL: 3395
▶️ TP: 3380 – 3368 – 3355
Primary Sell Zone:
▶️ Entry: 3416 – 3418
▶️ SL: 3422
▶️ TP: 3400 – 3388 – 3380 – 3368 – 3355
🔹 Buy Setups (short-term retracement):
Buy Zone 1:
▶️ Entry: 3350 – 3352
▶️ SL: 3345
▶️ TP: 3360 – 3368 – 3380 – 3388 – 3405
Buy Zone 2:
▶️ Entry: 3336 – 3338
▶️ SL: 3331
▶️ TP: 3350 – 3368 – 3380 – 3394 – 3405
✅ Note: Stay closely tuned to the signals — I’ll provide updates as entries are triggered or key levels shift.
📌 Follow for daily gold technical insights, trade zones, and execution strategies tailored to London and NY sessions.
#XAUUSD #GoldAnalysis #ABCWave #CorrectionInGold #ForexTrading #ScalpingSetup #VolumeProfile #TechnicalStrategy #TradingPlan #LondonSession #GoldUpdate #TradingViewUK

[AI] Advanced MTF Dashboard Pro █ 9 Timeframes + Signals# 🚀 Advanced MTF Dashboard Pro █ 9 Timeframes + Signals
## The Ultimate Multi-Timeframe Analysis Dashboard - See Everything at a Glance!
Transform your trading with the most comprehensive MTF dashboard on TradingView. This professional-grade tool analyzes 9 timeframes simultaneously, giving you instant market insights that would normally require multiple charts and hours of analysis.
---
## ⚡ KEY FEATURES
### 📊 **9-Timeframe Analysis**
✅ **Complete Coverage** - 1m, 5m, 15m, 30m, 1H, 4H, Daily, Weekly, Monthly
✅ **Toggle Control** - Show only the timeframes you need
✅ **Real-Time Updates** - All data refreshes automatically
✅ **Clean Organization** - Professional table layout
✅ **Smart Positioning** - Place dashboard anywhere on chart
### 🎯 **Multi-Indicator Analysis Per Timeframe**
✅ **Trend Direction** - EMA cross-based trend detection
✅ **RSI Momentum** - Overbought/oversold conditions
✅ **MACD Signals** - Histogram direction and strength
✅ **Volume Analysis** - Above/below average volume
✅ **Confluence Score** - Combined signal strength rating
### 💎 **Advanced Signal System**
✅ **Visual Status Indicators**
- ⬆⬆ Strong Bullish
- ⬆ Bullish
- ➡ Neutral
- ⬇ Bearish
- ⬇⬇ Strong Bearish
✅ **Confluence Ratings**
- ★★★★★ Excellent Setup
- ★★★★☆ Strong Setup
- ★★★☆☆ Good Setup
- ★★☆☆☆ Fair Setup
- ★☆☆☆☆ Weak Setup
### 📈 **Market Analysis Dashboard**
✅ **Overall Market Bias** - Instant bullish/bearish/neutral assessment
✅ **Bias Strength %** - Quantified market direction strength
✅ **Confluence Score** - Overall setup quality rating
✅ **Trend Alignment** - See when multiple timeframes agree
✅ **Smart Filtering** - Focus on high-probability setups
### 🔔 **Professional Alert System**
✅ **Strong Signal Alerts** - When confluence is extremely high
✅ **Bias Change Alerts** - Market direction shifts
✅ **Custom Messages** - Detailed alert descriptions
✅ **Multi-Timeframe Alerts** - Know which timeframes triggered
✅ **Smart Frequency** - No alert spam
### 🎨 **Customization Options**
✅ **4 Color Schemes** - Professional, Classic, Vibrant, Dark
✅ **6 Table Positions** - Top/Bottom/Middle + Left/Right
✅ **4 Text Sizes** - Tiny to Large
✅ **Toggle Features** - Show/hide any component
✅ **Visual Preferences** - Background colors, signals, etc.
---
## 🎯 PERFECT FOR
• **Multi-Timeframe Traders** - See all timeframes without switching
• **Confluence Traders** - Find high-probability aligned setups
• **Day Traders** - Quick market assessment for entries
• **Swing Traders** - Identify major trend alignments
• **Scalpers** - Spot micro-trends within larger trends
---
## 📱 WORKS ON ALL MARKETS
✅ **Forex** - All currency pairs
✅ **Crypto** - Bitcoin, Ethereum, all altcoins
✅ **Stocks** - Individual stocks and ETFs
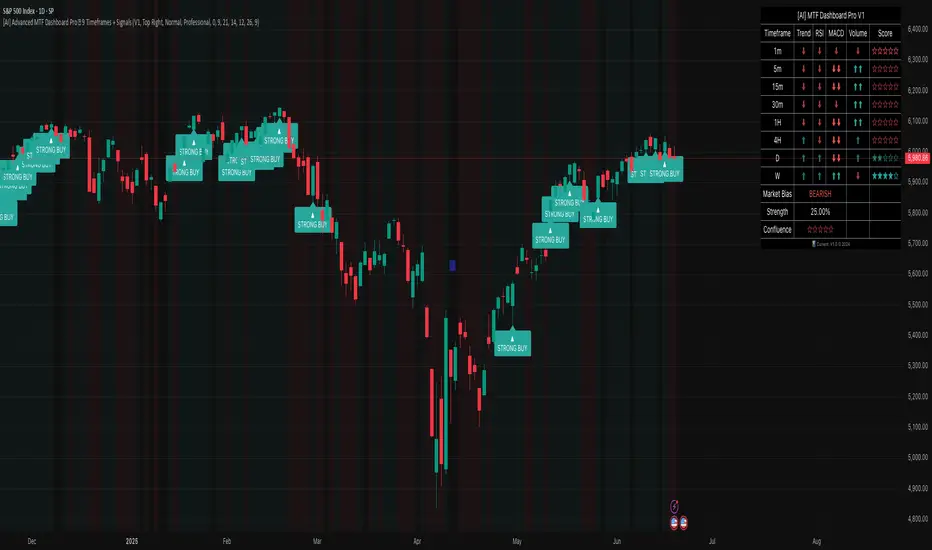
✅ **Indices** - S&P 500, NASDAQ, etc.
✅ **Commodities** - Gold, Oil, Silver
✅ **Futures** - All futures contracts
---
## ⚙️ QUICK START GUIDE
### 1️⃣ **Add to Chart**
Click "Add to Favorites" and apply to any chart
### 2️⃣ **Configure Timeframes**
- Toggle ON the timeframes you trade
- Toggle OFF timeframes you don't need
### 3️⃣ **Customize Appearance**
- Choose your color scheme
- Select table position
- Adjust text size for your screen
### 4️⃣ **Interpret Signals**
- **Green rows** = Bullish timeframes
- **Red rows** = Bearish timeframes
- **More arrows** = Stronger signals
- **More stars** = Better confluence
### 5️⃣ **Set Alerts**
Right-click indicator → "Add Alert" → Choose conditions
---
## 📚 TRADING STRATEGIES
### **Strategy 1: Confluence Trading**
1. Wait for 70%+ timeframes to align (same direction)
2. Enter when confluence score shows ★★★★ or better
3. Use lower timeframe for precise entry
4. Higher timeframes for trend direction
### **Strategy 2: Timeframe Divergence**
1. Look for lower TFs turning while higher TFs trend
2. Potential reversal when multiple TFs flip
3. Confirm with volume increase
4. Best at major support/resistance
### **Strategy 3: Momentum Alignment**
1. All momentum indicators (RSI/MACD) align
2. Volume confirms direction
3. Enter on pullback to moving average
4. Exit when momentum diverges
---
## 🛠️ INDICATOR SETTINGS EXPLAINED
### **Timeframe Selection**
Each timeframe can be toggled on/off. Only active timeframes:
- Appear in the dashboard
- Count toward confluence
- Trigger alerts
### **Indicator Parameters**
- **Fast/Slow EMA**: Trend detection sensitivity (9/21 default)
- **RSI Length**: Momentum period (14 default)
- **MACD Settings**: Signal generation (12/26/9 default)
### **Visual Settings**
- **Table Position**: Where dashboard appears
- **Text Size**: Readability adjustment
- **Color Scheme**: Match your chart theme
### **Signal Settings**
- **Show Trend Strength**: Display trend indicators
- **Show Momentum**: RSI/MACD columns
- **Show Volume**: Volume analysis column
- **Show Confluence**: Star rating column
---
## 🌟 WHY CHOOSE ADVANCED MTF DASHBOARD PRO?
### **🤖 AI-Enhanced Analysis**
Our algorithms intelligently weight signals based on timeframe importance and market conditions, providing more accurate confluence scores than simple averaging.
### **⚡ Lightning Fast**
Optimized code ensures smooth performance even with all 9 timeframes active. No lag, no delays, just instant insights.
### **👁️ See Everything**
Stop switching between charts. One glance shows you everything you need to make informed trading decisions.
### **🎯 Precision Timing**
Identify the exact moment when multiple timeframes align for the highest probability trades.
### **📈 Proven Results**
Based on professional trading techniques used by institutional traders, now accessible to everyone.
---
## 💡 PRO TIPS
1. **Higher Timeframes = Stronger Trends** - Give more weight to 4H/Daily/Weekly
2. **Confluence is Key** - Best trades have 80%+ timeframe agreement
3. **Volume Confirms** - Look for volume spikes with signal alignment
4. **Patience Pays** - Wait for ★★★★★ setups for best results
5. **Risk Management** - Even perfect setups can fail, always use stops
---
## 🎯 ADVANCED USAGE
### **For Scalpers**
- Focus on 1m, 5m, 15m
- Quick confluence checks
- Rapid signal changes
### **For Day Traders**
- Use 5m to 1H primarily
- 4H for overall bias
- Balance speed with reliability
### **For Swing Traders**
- Emphasize 4H, Daily, Weekly
- Monthly for major trend
- Slower but more reliable signals
---
## 📞 SUPPORT & COMMUNITY
- 💬 **Comments Section** - Ask questions below
---
## ⚠️ RISK DISCLAIMER
Trading involves substantial risk of loss. Past performance does not guarantee future results. This indicator is for educational purposes and should not be considered financial advice. Always do your own research and use proper risk management.
---
## 🔄 VERSION HISTORY
**v1.0** (Current)
- Initial release
- 9 timeframe analysis
- 4 indicators per timeframe
- Confluence scoring system
- Full alert integration
- 4 color schemes
---
## 🙏 CREDITS
Inspired by institutional multi-timeframe analysis techniques
---
**🏷️ TAGS**
#MTF #MultiTimeframe #Dashboard #Confluence #TrendAnalysis #Momentum #RSI #MACD #Volume #DayTrading #SwingTrading #Scalping #Forex #Crypto #Stocks #TechnicalAnalysis #TradingDashboard #MarketAnalysis #AI #Signals
---
### ⭐ If this dashboard helps your trading, please leave a like and share your experience in the comments!
### 🚀 Click "Add to Favorites" to start seeing the market like never before!
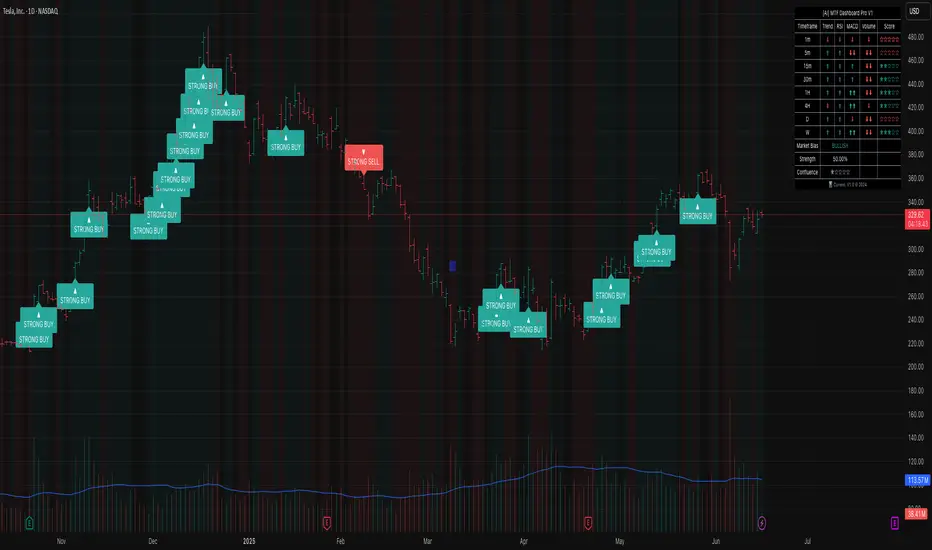
Tesla Strong Advanced MTF Dashboard Pro █ 9 Timeframes + Signals# 🚀 Advanced MTF Dashboard Pro █ 9 Timeframes + Signals
## The Ultimate Multi-Timeframe Analysis Dashboard - See Everything at a Glance!
Transform your trading with the most comprehensive MTF dashboard on TradingView. This professional-grade tool analyzes 9 timeframes simultaneously, giving you instant market insights that would normally require multiple charts and hours of analysis.
---
## ⚡ KEY FEATURES
### 📊 **9-Timeframe Analysis**
✅ **Complete Coverage** - 1m, 5m, 15m, 30m, 1H, 4H, Daily, Weekly, Monthly
✅ **Toggle Control** - Show only the timeframes you need
✅ **Real-Time Updates** - All data refreshes automatically
✅ **Clean Organization** - Professional table layout
✅ **Smart Positioning** - Place dashboard anywhere on chart
### 🎯 **Multi-Indicator Analysis Per Timeframe**
✅ **Trend Direction** - EMA cross-based trend detection
✅ **RSI Momentum** - Overbought/oversold conditions
✅ **MACD Signals** - Histogram direction and strength
✅ **Volume Analysis** - Above/below average volume
✅ **Confluence Score** - Combined signal strength rating
### 💎 **Advanced Signal System**
✅ **Visual Status Indicators**
- ⬆⬆ Strong Bullish
- ⬆ Bullish
- ➡ Neutral
- ⬇ Bearish
- ⬇⬇ Strong Bearish
✅ **Confluence Ratings**
- ★★★★★ Excellent Setup
- ★★★★☆ Strong Setup
- ★★★☆☆ Good Setup
- ★★☆☆☆ Fair Setup
- ★☆☆☆☆ Weak Setup
### 📈 **Market Analysis Dashboard**
✅ **Overall Market Bias** - Instant bullish/bearish/neutral assessment
✅ **Bias Strength %** - Quantified market direction strength
✅ **Confluence Score** - Overall setup quality rating
✅ **Trend Alignment** - See when multiple timeframes agree
✅ **Smart Filtering** - Focus on high-probability setups
### 🔔 **Professional Alert System**
✅ **Strong Signal Alerts** - When confluence is extremely high
✅ **Bias Change Alerts** - Market direction shifts
✅ **Custom Messages** - Detailed alert descriptions
✅ **Multi-Timeframe Alerts** - Know which timeframes triggered
✅ **Smart Frequency** - No alert spam
### 🎨 **Customization Options**
✅ **4 Color Schemes** - Professional, Classic, Vibrant, Dark
✅ **6 Table Positions** - Top/Bottom/Middle + Left/Right
✅ **4 Text Sizes** - Tiny to Large
✅ **Toggle Features** - Show/hide any component
✅ **Visual Preferences** - Background colors, signals, etc.
---
## 🎯 PERFECT FOR
• **Multi-Timeframe Traders** - See all timeframes without switching
• **Confluence Traders** - Find high-probability aligned setups
• **Day Traders** - Quick market assessment for entries
• **Swing Traders** - Identify major trend alignments
• **Scalpers** - Spot micro-trends within larger trends
---
## 📱 WORKS ON ALL MARKETS
✅ **Forex** - All currency pairs
✅ **Crypto** - Bitcoin, Ethereum, all altcoins
✅ **Stocks** - Individual stocks and ETFs
✅ **Indices** - S&P 500, NASDAQ, etc.
✅ **Commodities** - Gold, Oil, Silver
✅ **Futures** - All futures contracts
---
## ⚙️ QUICK START GUIDE
### 1️⃣ **Add to Chart**
Click "Add to Favorites" and apply to any chart
### 2️⃣ **Configure Timeframes**
- Toggle ON the timeframes you trade
- Toggle OFF timeframes you don't need
### 3️⃣ **Customize Appearance**
- Choose your color scheme
- Select table position
- Adjust text size for your screen
### 4️⃣ **Interpret Signals**
- **Green rows** = Bullish timeframes
- **Red rows** = Bearish timeframes
- **More arrows** = Stronger signals
- **More stars** = Better confluence
### 5️⃣ **Set Alerts**
Right-click indicator → "Add Alert" → Choose conditions
---
## 📚 TRADING STRATEGIES
### **Strategy 1: Confluence Trading**
1. Wait for 70%+ timeframes to align (same direction)
2. Enter when confluence score shows ★★★★ or better
3. Use lower timeframe for precise entry
4. Higher timeframes for trend direction
### **Strategy 2: Timeframe Divergence**
1. Look for lower TFs turning while higher TFs trend
2. Potential reversal when multiple TFs flip
3. Confirm with volume increase
4. Best at major support/resistance
### **Strategy 3: Momentum Alignment**
1. All momentum indicators (RSI/MACD) align
2. Volume confirms direction
3. Enter on pullback to moving average
4. Exit when momentum diverges
---
## 🛠️ INDICATOR SETTINGS EXPLAINED
### **Timeframe Selection**
Each timeframe can be toggled on/off. Only active timeframes:
- Appear in the dashboard
- Count toward confluence
- Trigger alerts
### **Indicator Parameters**
- **Fast/Slow EMA**: Trend detection sensitivity (9/21 default)
- **RSI Length**: Momentum period (14 default)
- **MACD Settings**: Signal generation (12/26/9 default)
### **Visual Settings**
- **Table Position**: Where dashboard appears
- **Text Size**: Readability adjustment
- **Color Scheme**: Match your chart theme
### **Signal Settings**
- **Show Trend Strength**: Display trend indicators
- **Show Momentum**: RSI/MACD columns
- **Show Volume**: Volume analysis column
- **Show Confluence**: Star rating column
---
## 🌟 WHY CHOOSE ADVANCED MTF DASHBOARD PRO?
### **🤖 AI-Enhanced Analysis**
Our algorithms intelligently weight signals based on timeframe importance and market conditions, providing more accurate confluence scores than simple averaging.
### **⚡ Lightning Fast**
Optimized code ensures smooth performance even with all 9 timeframes active. No lag, no delays, just instant insights.
### **👁️ See Everything**
Stop switching between charts. One glance shows you everything you need to make informed trading decisions.
### **🎯 Precision Timing**
Identify the exact moment when multiple timeframes align for the highest probability trades.
### **📈 Proven Results**
Based on professional trading techniques used by institutional traders, now accessible to everyone.
---
## 💡 PRO TIPS
1. **Higher Timeframes = Stronger Trends** - Give more weight to 4H/Daily/Weekly
2. **Confluence is Key** - Best trades have 80%+ timeframe agreement
3. **Volume Confirms** - Look for volume spikes with signal alignment
4. **Patience Pays** - Wait for ★★★★★ setups for best results
5. **Risk Management** - Even perfect setups can fail, always use stops
---
## 🎯 ADVANCED USAGE
### **For Scalpers**
- Focus on 1m, 5m, 15m
- Quick confluence checks
- Rapid signal changes
### **For Day Traders**
- Use 5m to 1H primarily
- 4H for overall bias
- Balance speed with reliability
### **For Swing Traders**
- Emphasize 4H, Daily, Weekly
- Monthly for major trend
- Slower but more reliable signals
---
## 📞 SUPPORT & COMMUNITY
- 💬 **Comments Section** - Ask questions below
---
## ⚠️ RISK DISCLAIMER
Trading involves substantial risk of loss. Past performance does not guarantee future results. This indicator is for educational purposes and should not be considered financial advice. Always do your own research and use proper risk management.
---
## 🔄 VERSION HISTORY
**v1.0** (Current)
- Initial release
- 9 timeframe analysis
- 4 indicators per timeframe
- Confluence scoring system
- Full alert integration
- 4 color schemes
---
## 🙏 CREDITS
Developed by
Inspired by institutional multi-timeframe analysis techniques
---
**🏷️ TAGS**
#MTF #MultiTimeframe #Dashboard #Confluence #TrendAnalysis #Momentum #RSI #MACD #Volume #DayTrading #SwingTrading #Scalping #Forex #Crypto #Stocks #TechnicalAnalysis #TradingDashboard #MarketAnalysis #AI #Signals
---
### ⭐ If this dashboard helps your trading, please leave a like and share your experience in the comments!
### 🚀 Click "Add to Favorites" to start seeing the market like never before!
Protected script
This script is published as closed-source. However, you can use it freely and without any limitations – learn more here.
SpeedEdge_Securities
Also on:
Disclaimer
The information and publications are not meant to be, and do not constitute, financial, investment, trading, or other types of advice or recommendations supplied or endorsed by TradingView. Read more in the Terms of Use.
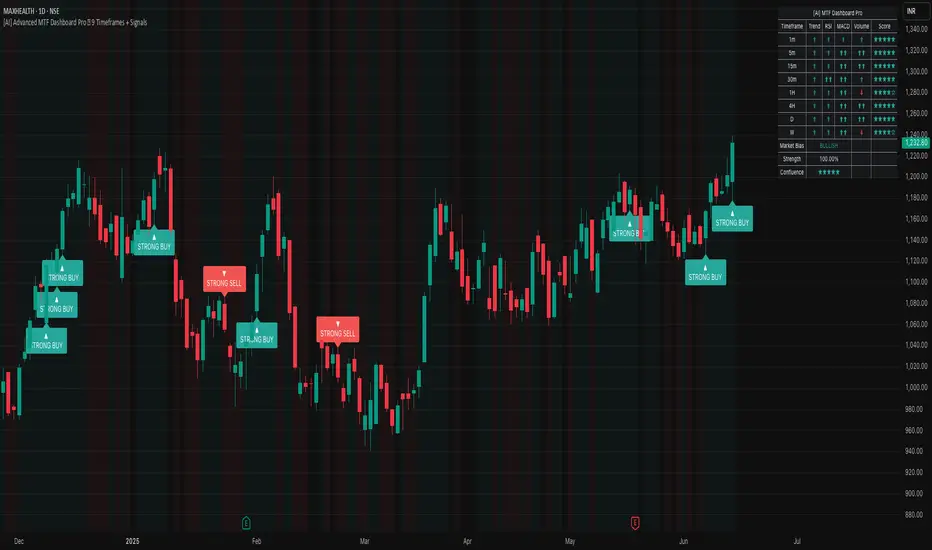
[AI] Advanced MTF Dashboard Pro 9 Timeframes + Signals# 🚀 Advanced MTF Dashboard Pro █ 9 Timeframes + Signals
## The Ultimate Multi-Timeframe Analysis Dashboard - See Everything at a Glance!
Transform your trading with the most comprehensive MTF dashboard on TradingView. This professional-grade tool analyzes 9 timeframes simultaneously, giving you instant market insights that would normally require multiple charts and hours of analysis.
---
## ⚡ KEY FEATURES
### 📊 **9-Timeframe Analysis**
✅ **Complete Coverage** - 1m, 5m, 15m, 30m, 1H, 4H, Daily, Weekly, Monthly
✅ **Toggle Control** - Show only the timeframes you need
✅ **Real-Time Updates** - All data refreshes automatically
✅ **Clean Organization** - Professional table layout
✅ **Smart Positioning** - Place dashboard anywhere on chart
### 🎯 **Multi-Indicator Analysis Per Timeframe**
✅ **Trend Direction** - EMA cross-based trend detection
✅ **RSI Momentum** - Overbought/oversold conditions
✅ **MACD Signals** - Histogram direction and strength
✅ **Volume Analysis** - Above/below average volume
✅ **Confluence Score** - Combined signal strength rating
### 💎 **Advanced Signal System**
✅ **Visual Status Indicators**
- ⬆⬆ Strong Bullish
- ⬆ Bullish
- ➡ Neutral
- ⬇ Bearish
- ⬇⬇ Strong Bearish
✅ **Confluence Ratings**
- ★★★★★ Excellent Setup
- ★★★★☆ Strong Setup
- ★★★☆☆ Good Setup
- ★★☆☆☆ Fair Setup
- ★☆☆☆☆ Weak Setup
### 📈 **Market Analysis Dashboard**
✅ **Overall Market Bias** - Instant bullish/bearish/neutral assessment
✅ **Bias Strength %** - Quantified market direction strength
✅ **Confluence Score** - Overall setup quality rating
✅ **Trend Alignment** - See when multiple timeframes agree
✅ **Smart Filtering** - Focus on high-probability setups
### 🔔 **Professional Alert System**
✅ **Strong Signal Alerts** - When confluence is extremely high
✅ **Bias Change Alerts** - Market direction shifts
✅ **Custom Messages** - Detailed alert descriptions
✅ **Multi-Timeframe Alerts** - Know which timeframes triggered
✅ **Smart Frequency** - No alert spam
### 🎨 **Customization Options**
✅ **4 Color Schemes** - Professional, Classic, Vibrant, Dark
✅ **6 Table Positions** - Top/Bottom/Middle + Left/Right
✅ **4 Text Sizes** - Tiny to Large
✅ **Toggle Features** - Show/hide any component
✅ **Visual Preferences** - Background colors, signals, etc.
---
## 🎯 PERFECT FOR
• **Multi-Timeframe Traders** - See all timeframes without switching
• **Confluence Traders** - Find high-probability aligned setups
• **Day Traders** - Quick market assessment for entries
• **Swing Traders** - Identify major trend alignments
• **Scalpers** - Spot micro-trends within larger trends
---
## 📱 WORKS ON ALL MARKETS
✅ **Forex** - All currency pairs
✅ **Crypto** - Bitcoin, Ethereum, all altcoins
✅ **Stocks** - Individual stocks and ETFs
✅ **Indices** - S&P 500, NASDAQ, etc.
✅ **Commodities** - Gold, Oil, Silver
✅ **Futures** - All futures contracts
---
## ⚙️ QUICK START GUIDE
### 1️⃣ **Add to Chart**
Click "Add to Favorites" and apply to any chart
### 2️⃣ **Configure Timeframes**
- Toggle ON the timeframes you trade
- Toggle OFF timeframes you don't need
### 3️⃣ **Customize Appearance**
- Choose your color scheme
- Select table position
- Adjust text size for your screen
### 4️⃣ **Interpret Signals**
- **Green rows** = Bullish timeframes
- **Red rows** = Bearish timeframes
- **More arrows** = Stronger signals
- **More stars** = Better confluence
### 5️⃣ **Set Alerts**
Right-click indicator → "Add Alert" → Choose conditions
---
## 📚 TRADING STRATEGIES
### **Strategy 1: Confluence Trading**
1. Wait for 70%+ timeframes to align (same direction)
2. Enter when confluence score shows ★★★★ or better
3. Use lower timeframe for precise entry
4. Higher timeframes for trend direction
### **Strategy 2: Timeframe Divergence**
1. Look for lower TFs turning while higher TFs trend
2. Potential reversal when multiple TFs flip
3. Confirm with volume increase
4. Best at major support/resistance
### **Strategy 3: Momentum Alignment**
1. All momentum indicators (RSI/MACD) align
2. Volume confirms direction
3. Enter on pullback to moving average
4. Exit when momentum diverges
---
## 🛠️ INDICATOR SETTINGS EXPLAINED
### **Timeframe Selection**
Each timeframe can be toggled on/off. Only active timeframes:
- Appear in the dashboard
- Count toward confluence
- Trigger alerts
### **Indicator Parameters**
- **Fast/Slow EMA**: Trend detection sensitivity (9/21 default)
- **RSI Length**: Momentum period (14 default)
- **MACD Settings**: Signal generation (12/26/9 default)
### **Visual Settings**
- **Table Position**: Where dashboard appears
- **Text Size**: Readability adjustment
- **Color Scheme**: Match your chart theme
### **Signal Settings**
- **Show Trend Strength**: Display trend indicators
- **Show Momentum**: RSI/MACD columns
- **Show Volume**: Volume analysis column
- **Show Confluence**: Star rating column
---
## 🌟 WHY CHOOSE ADVANCED MTF DASHBOARD PRO?
### **🤖 AI-Enhanced Analysis**
Our algorithms intelligently weight signals based on timeframe importance and market conditions, providing more accurate confluence scores than simple averaging.
### **⚡ Lightning Fast**
Optimized code ensures smooth performance even with all 9 timeframes active. No lag, no delays, just instant insights.
### **👁️ See Everything**
Stop switching between charts. One glance shows you everything you need to make informed trading decisions.
### **🎯 Precision Timing**
Identify the exact moment when multiple timeframes align for the highest probability trades.
### **📈 Proven Results**
Based on professional trading techniques used by institutional traders, now accessible to everyone.
---
## 💡 PRO TIPS
1. **Higher Timeframes = Stronger Trends** - Give more weight to 4H/Daily/Weekly
2. **Confluence is Key** - Best trades have 80%+ timeframe agreement
3. **Volume Confirms** - Look for volume spikes with signal alignment
4. **Patience Pays** - Wait for ★★★★★ setups for best results
5. **Risk Management** - Even perfect setups can fail, always use stops
---
## 🎯 ADVANCED USAGE
### **For Scalpers**
- Focus on 1m, 5m, 15m
- Quick confluence checks
- Rapid signal changes
### **For Day Traders**
- Use 5m to 1H primarily
- 4H for overall bias
- Balance speed with reliability
### **For Swing Traders**
- Emphasize 4H, Daily, Weekly
- Monthly for major trend
- Slower but more reliable signals
---
## 📞 SUPPORT & COMMUNITY
- 💬 **Comments Section** - Ask questions below
---
## ⚠️ RISK DISCLAIMER
Trading involves substantial risk of loss. Past performance does not guarantee future results. This indicator is for educational purposes and should not be considered financial advice. Always do your own research and use proper risk management.
---
## 🔄 VERSION HISTORY
**v1.0** (Current)
- Initial release
- 9 timeframe analysis
- 4 indicators per timeframe
- Confluence scoring system
- Full alert integration
- 4 color schemes
---
---
**🏷️ TAGS**
#MTF #MultiTimeframe #Dashboard #Confluence #TrendAnalysis #Momentum #RSI #MACD #Volume #DayTrading #SwingTrading #Scalping #Forex #Crypto #Stocks #TechnicalAnalysis #TradingDashboard #MarketAnalysis #AI #Signals
---
### ⭐ If this dashboard helps your trading, please leave a like and share your experience in the comments!
### 🚀 Click "Add to Favorites" to start seeing the market like never before!
Gold Next Move 3100?4-Hour Chart (Mid-Term View)
🔑 Key Observations:
Uptrend Remains Intact:
Price is still above the 50 EMA, indicating continued bullish strength.
Key Resistance at $3,038:
A break above this level could trigger further upside momentum.
Support Levels:
$3,011 and $3,007: First support zone.
$2,983: Stronger support.
Potential Scenario:
Bullish Breakout: If price breaks above $3,038 , the next target would be $3,048 and beyond.
🔸 Failure to Breakout : If rejected at resistance, price might retrace to $3,011 or lower.
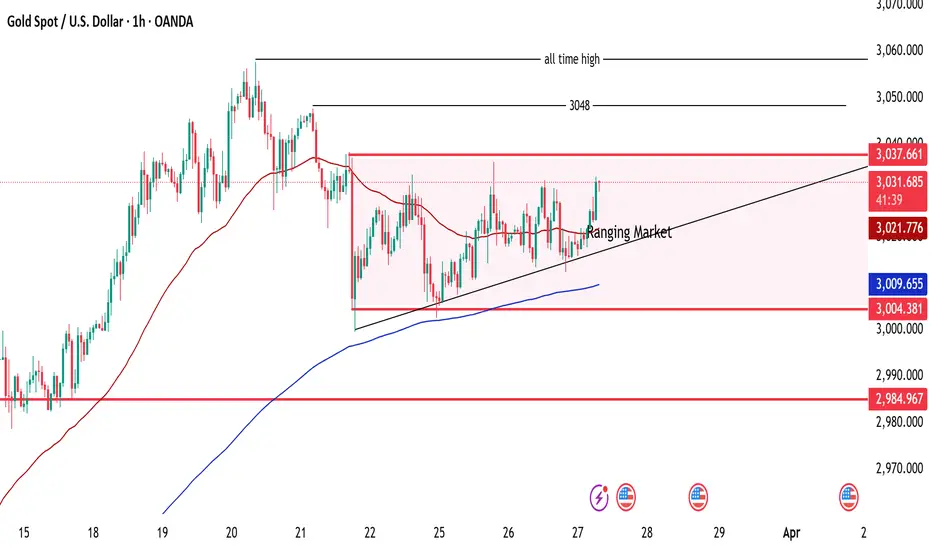
1-Hour Chart (Short-Term View)
🔑Key Observations:
✅ Ranging Market: Gold is consolidating within a horizontal range between $3,009 and $3,037, forming a sideways movement.
✅ Ascending Trendline : The price is gradually increasing with a rising trendline acting as dynamic support.
🔸Key Resistance Levels:
$3,037-$3,048: Strong resistance zone.
All-Time High Above $3,057.5: Major resistance if the price breaks above $3,048.
✅Support Levels:
🔹$3,021 - 3,009: Key intraday support zone.
🔹$3,004 and $2,985: Stronger support zones below.
Moving Averages:
Price is above the 50 EMA (red line), indicating bullish strength.
The 200 EMA (blue line) is far below, showing overall long-term bullish sentiment.
💡 Potential Trade Setup:
🔹Breakout Strategy: A breakout above $3,037-$3,048 could lead to new highs.
Range Trading: If the price remains within the range, traders can buy near support ($3,009) and sell near resistance ($3,037-$3,048).
15-Minute Chart (Intraday/Scalping View)
🔑Key Observations:
Recent Breakout Attempt: Price has tested the $3,030-$3,038 resistance zone.
200 EMA & 50 EMA Cross:
The red (50 EMA) is above the blue (200 EMA), signaling bullish sentiment.
Support Zone Identified (~$3,007-$3,022):
Price reacted strongly from this level, indicating strong buyer demand.
Trade Plan for Scalpers:
✅ Long Entrie s: Look for pullbacks near $3,022 with stop-loss below $3,007.
✅ Short Entries : If price rejects $3,038, look for short trades targeting $3,022 or lower.
🌟 Final Conclusion & Trading Plan:
📌 Bullish Scenario:
🔹A break above $3,038 will confirm a bullish breakout.
🔹Potential target = $3,048, then all-time high $3,060+.
🔹Best strategy: Buy the breakout with proper stop-loss below $3,022.
📌 Bearish Scenario:
If price fails to break $3,038, expect a pullback to $3,011 - $3,007.
Possible short opportunities below $3,007 targeting $2,983.
📌 Neutral/Ranging Market:
Until price breaks $3,038 or drops below $3,007, expect sideways movement.
🔹 Recommended Trading Approach:
✅ Breakout traders: Watch for a confirmed break and retest above $3,038.
✅ Range traders: Buy near $3,009-$3,022 and sell near $3,038.
✅ Scalpers: Look for quick trades within the range of $3,007 - $3,037.
📉 Risk Management:
🔸 Keep a stop-loss below $3,007 if buying.
🔸 Keep a stop-loss above $3,038 if shorting.
👉 Always follow TP/SL to protect your capital and maximize profits!
Stay tuned for updates once the confirmations are in place!
Please support me with your likes and comments to motivate me to share more analysis with you and share your opinion about the possible trend of this chart with me !
📢Best Regards , Silver Wolf Traders Community
Disclaimer: This is for educational purposes only.
Always trade responsibly and manage your risk effectively
Banknifty Tradesetup for 28-08-2023Banknifty important levels to watch are as follows
#Support: 44138
Sell below: 44138 only on 15 minute candle closure below the level. scalpers may short below 44200 only for scalping.
Target 1: 44000
Target 2: 43880
Target 3: 43780
#Resistance: 44356
Buy Above: 44356 only on 15 minute candle closure Above the level.
Target 1: 44490
Target 2: 44670
#Demand Zone: 43950-44000 may act as a immediate buying zone, and price may bounce from the region marked in green on the chart.
#Supply Zone: 44300-44350 may act as an immediate selling zone, and price may reject from the region marked in red on the chart.
#Remember each level will act as a support and resistance individually so there is a probability of reversal on either side. Please do your own research before initiating any trade. Always keep stoploss in order to protect your capital.
Follow us for more such information and educational ideas. Give it a like if you appreciate the idea. Queries will be answered in comment section.

Nifty's Structure For September seriesHello everyone, hope you're safe and doing good.
Today I'm going to share my analysis on Nifty Futures based on price action + Dynamic trend lines, for the coming days in the september series.
Hope it helps in your decision making while trading!
As on Sep 17th 2022, here are the observations, and let's listen to what the market is trying to say:
1. Nifty formed a strong bearish candle (almost a Marubozu candle) on the day chart and confirming the the strong volume candles. It is back into the long term channel which is coming from Oct '2021.
2. It broke the midway of the temporary bullish channel drawn based on the jun-aug 2022 rally in the index. Any break below this is a strong confirmation
that bears are officially back in the market.
3. The price on Sep 16th 2022, closed below the 20 Day EMA and also the 200 Hourly EMA, which are significant moving averages for intraday players.
(Tip: Priority of Moving averages. Weekly >> Daily > Hourly > 15min > 5min. Very important for an intraday option players. Especially option buyers.)
4. The levels of support for nifty Futures is as Follows:
1. 17509, first level of Support.
2. 17430 - 17439, second level of support.
3. 17390, 3rd level of support. Very key support.
4. 17308 - 17336, 4th level of support. Very strong support zone, as it's based on D-chart price action + 50 Day EMA is in that zone.
5. As we all know, volume and price action plays a very important parameters in intraday trading, please bear in mind that
the same above mentioned levels can act as support - when volumes on 5min chart are low; or as a breakdown trades - when volumes exceed 200k on 5min charts.
6. Please check the intraday open interest, US DOW Futures, the India VIX and other parameters, before entering a trade on the above mentioned levels.
As I'm an option scalper, all these levels would be very helpful for scalping.
Stay safe, maintain a calm and composed mindset, follow your discipline and please protect your capital while trading.

Gold Hits $394x! New ATH: Fed & BoJ Drive the Rally.Hello, traders!
Gold (XAU/USD) has just delivered a massive breakthrough in the Asian session, setting a New ATH around $394x after comfortably breaching that $3900 level. This strength, bhai, is getting serious support from two big monetary policy moves: Fed rate cut expectations and the likelihood of the BoJ (Bank of Japan) delaying rate hikes due to the new PM. Paisa hi paisa!
Fundamentals & Technical Caution: Mind the FOMO
Dual Drivers: Market sentiment is clear—the Fed is expected to cut rates two more times, and the dovish BoJ outlook only adds more fuel, creating a rock-solid foundation for Gold.
Safe-Haven: The continuous US Shutdown drama and geopolitical tensions are keeping that safe-haven bid strong.
FOMO Warning: The momentum is fierce, but you must avoid buying the high. Prioritize Buying on pullbacks to FVG (Fair Value Gaps) to secure a safer entry point. Discipline is key, boss.
Key Price Levels:
Resistance: $3954, $3963
Support: $3910, $3895, $3883, $3870
Trading Strategy (Absolute Risk Management):
BUY SCALP: $3910 - $3908
SL: $3904
TPs: $3918, $3928, $3938, $3948, $3958
BUY ZONE (FVG): $3895 - $3893
SL: $3885
TPs: $3903, $3913, $3923, $3933, $3943
SELL ZONE (High Risk): $3964 - $3966
SL: $3974
TPs: $3956, $3946, $3936, $3926, $3916
Are you placing your bets on a $4000 target this week? Let me know your plan! 👇
#Gold #XAUUSD #ATH #Fed #BoJ #Shutdown #TradingView #MarketAnalysis #GoldFever

Gold Correction: Fed Warning vs. Massive Safe-Haven Flows Hello, traders!
Gold pulled back to $3,845.78/oz after Dallas Fed President Lorie Logan called for caution regarding further rate cuts.
Fundamentals: Fed Warns, But the Buying Wave is Unstoppable
The market stands at a crossroads:
Downward Pressure: The caution signal from Fed's Logan.
Upward Momentum: Government shutdown (increases instability, delays jobs report), weak private sector jobs data (down 32k), and SPDR Gold Trust ETF holdings rising to the highest level since 2022.
Conclusion: Political instability and weak economic data continue to reinforce the likelihood of a Fed rate cut. Massive safe-haven capital is flowing into Gold.
Technical Analysis & Strategy
Gold retreated to the FIBO 0.618 - 0.5 zone, indicating a healthy technical correction after the sharp rally. Priority remains Buy if the price holds above $3861. Be cautious of Stop Loss hunting.
Resistance: $3870, $3884, $3894
Support: $3855, $3833, $3798
Trading Strategy (Tight SL):
BUY SCALP: $3838 - $3836 / SL: $3832 / TP: $3846 - $3857
BUY ZONE: $3798 - $3796 / SL: $3788 / TP: $3816 - $3836
SELL ZONE: $3888 - $3890 / SL: $3898 / TP: $3870 - $3850
Do you think the Fed's warning is strong enough to reverse this trend? 👇
#Gold #XAUUSD #Fed #GovernmentShutdown #TradingView #PhânTíchVàng #ETF

Gold 30/09 - Safe-haven flows surge | Gold sails toward new ATH 🟡 XAU/USD – 30/09 | Captain Vincent ⚓
🔎 Captain’s Log – Context & News
US Politics : Meeting between Trump and bipartisan leaders ended without agreement → growing risk of a US government shutdown by Wednesday.
Conflict : Democrats demand concessions, Republicans fiercely oppose → wide gap remains, both sides blaming each other.
Market : Investors watch JOLTS data and speeches from 3 FED members, but political risks are the strongest catalyst for Gold.
Trend : Safe-haven flows keep pouring into Gold → increasing likelihood of testing new ATH.
⏩ Captain’s Summary : US political seas are stormy, Gold becomes the fortress of safety. The voyage toward ATH is widening.
📈 Captain’s Chart – Technical Analysis (H1)
EMA : EMA 34 (yellow) > EMA 89 (red) → bullish trend clearly dominant.
Golden Harbor (Support / Buy Zone)
Big Volume Dock: 3,827
Storm Breaker (Resistance / Sell Zone)
ATH test: 3,916 – 3,917
Market Structure : Gold broke out strongly, now trading around 3,870. Main trend remains bullish, with 3,842 – 3,827 as key anchor zones.
🎯 Captain’s Map – Trade Plan
✅ Buy (main priority)
Buy Zone 2 – Big Volume
Entry: 3,827 – 3,824
SL: 3,815
TP: 3,870 – 3,899 – 3,916
⚡ Sell (short scalp – high risk)
Sell Zone – ATH test
Entry: 3,917 – 3,920
SL: 3,925
TP: 3,899 – 3,870 – 3,856
⚓ Captain’s Note
“The Golden sails are filled by safe-haven winds, pushing the ship close to ATH. Golden Harbor 🏝️ (3,842 – 3,827) is the ideal dock for sailors to position Buys. Storm Breaker 🌊 (3,916 – 3,920) may unleash violent waves, suitable only for short Quick Boarding 🚤 scalps. If the political storm from Washington breaks out, Gold’s voyage could surpass the peak and expand its horizon.”
📢 If you find the Captain’s Log useful, don’t forget to Follow for the earliest updates.
💬 What’s your view, crew? Will Gold conquer ATH around 3,917 this week?

LiamTrading – XAUUSD IN-DEPTH ANALYSIS OF CURRENT TRENDLiamTrading – XAUUSD Scenario Today: Opportunities at Key Price Levels
Gold continues its strong upward momentum, currently fluctuating around the 376x–377x range after a series of breakthroughs. The technical structure on the H1 chart shows the market is forming clear resistance and support zones, suitable for short-term trading plans.
Technical Analysis
RSI is cooling off from high levels, indicating the possibility of a short-term correction.
The upper price range around 3818–3821 is a strong confluence of resistance, coinciding with wave peaks and Fibonacci extensions, making it prone to selling reactions.
Conversely, the support zones at 373x and 370x exhibit dense liquidity, serving as potential buying points when prices adjust.
The short-term Dow structure still leans towards an uptrend, but attention is needed for the sell confirmation zone if gold fails at the peak.
Reference Trading Plan
Sell Zone: 3818 – 3821, SL 3828, TP 3805 – 3785 – 3760 – 3732 – 3650
Buy Scalping: 3728 – 3731, SL 3723, TP 3750 – 3777 – 3790
Buy Zone: 3706 – 3709, SL 3700, TP 3725 – 3738 – 3750 – 3777 – 3790
In summary, the main trend still leans towards an increase, but with gold approaching strong resistance zones, the likelihood of a correction is very high. Traders need to patiently wait for reactions at the marked zones for optimal entries, while managing risk tightly.
This is my personal view on XAUUSD. If you're interested in gold scenarios, follow me for the fastest updates.

GOLD TREND TODAY - Support and Resistance - Simple Analysis📈 Trend & Market Structure
XAUUSD
Gold is still in a clear uptrend, respecting higher highs and higher lows on H4.
Recent breakout structures (BOS) confirm bullish order flow, but price is approaching a liquidity zone near $3,800.
On the downside, unmitigated Fair Value Gaps (FVG) and Order Blocks (OB) remain potential buy zones if price retraces.
🔑 Key Levels
Resistance: 3800 – 3830
Support: 3765 – 3760 – 3755
Liquidity Buy Zone: 3715 – 3712
📌 Trade Ideas
🔴 SELL Setup (Countertrend / Scalping)
Entry: 3855 – 3858
Stop Loss: 3863
Take Profit:
TP1: 3850
TP2: 3840
TP3: 3820
TP4: 3800
Open TP: 3780
🟢 BUY Setup (Trend-following / SMC zones)
Entry: 3715 – 3712 (Liquidity + Strong OB)
Stop Loss: 3705
Take Profit:
TP1: 3725
TP2: 3735
TP3: 3755
TP4: 3775
Open TP: 3800
🎯 Strategy Note
Main bias: Look for buys on retracements in line with the uptrend.
Shorts at 3855 – 3858 are countertrend scalps only; use tight stops.
Apply scalping entries once price reacts at the defined S/R levels with confirmation (candlestick rejection, BOS, or volume shift).
Always use SL/TP for risk management.
⚡ Gold remains bullish overall; the plan favors buy opportunities from demand zones, while countertrend shorts should be quick and managed tightly.

Gold hits record 3,759 | Safe-haven flows surge back🟡 XAU/USD – 23/09 | Captain Vincent ⚓
🔎 Captain’s Log – Context & News
Today Gold surged nearly +2% , hitting a record $3,759/oz .
Geopolitical tensions : Israel launched missiles into Lebanon, killing 5 (including 4 US citizens) → safe-haven demand rushed back into Gold.
USD weakened , capital flowed out of stocks & bonds → strong support for precious metals.
ETFs & speculators : heavy buying amplified the rally.
Silver : jumped to its highest level in 14 years, reinforcing strength in the precious metals sector.
⏩ Captain’s Summary : Gold is fueled by geopolitics, macro factors, and safe-haven demand. But after a hot rally, the big question: continue breaking highs or face sharp swings if the FED shifts tone?
📈 Captain’s Chart – Technical Analysis (H45)
Storm Breaker (Resistance / Sell Zone)
3,771 – 3,787 (Fibo 0.5–0.618 confluence, ATH test zone)
Golden Harbor (Support / Buy Zone)
Near support: 3,740 (previous high turned support)
OB Dock: 3,717 – 3,723
Breakout Harbor: 3,689 – 3,691
Market Structure
Gold broke out to Higher High around 3,755 – 3,759.
Main trend remains bullish, but prone to volatility / pullback after a hot rally.
🎯 Captain’s Map – Trade Plan
✅ Buy (trend-follow priority)
Buy Zone 1 (OB)
Entry: 3,717 – 3,723
SL: 3,707
TP: 3,725 – 3,730 – 3,735 – 3,740 – 3,750
Buy Zone 2 (Breakout Retest)
Entry: 3,689 – 3,691
SL: 3,678
TP: 3,699 – 3,710 – 3,7xx
⚡ Sell (short-term scalp if overbought)
Sell Zone (ATH test)
Entry: 3,783 – 3,785
SL: 3,795
TP: 3,759 – 3,740 – 3,717
⚓ Captain’s Note
“The geopolitical storm pushed the Golden sails past 3,759. Golden Harbor 🏝️ (3,717 – 3,689) is the safe dock for sailors to board the northbound trend. Storm Breaker 🌊 (3,771 – 3,787) may raise heavy waves, suitable for short Quick Boarding 🚤 scalps. The main voyage remains bullish, but after a hot rally, sailors must keep a firm hand on the helm to avoid being thrown off by choppy swings.”

Gold Sets New Record: Rate Hopes Driving Price HigherHello, traders!
Gold surged to a record high of $3,726.19/oz on September 22, fuelled by growing investor expectations for a clearer Fed rate-cutting path. Traders are now betting on two more rate cuts this year with a very high probability.
The growth drivers have shifted from being primarily central bank and Asian demand to now include strong buying from Western investors, as shown by increased holdings in gold ETFs. Upcoming speeches from Fed officials and the core PCE inflation data this week will be key in determining the market's next direction.
Technical Analysis & Strategy
Gold is in a strong uptrend and is continuously setting new highs. While there was a minor correction, the bullish momentum remains intact. Shorting near resistance levels is highly risky.
Outlook: Continue to prioritize Buy positions if gold holds above $370x.
Resistance: $3785, $3794, $3804
Support: $3774, $3764, $3754
Suggested Trading Strategy:
Buy Scalp: Zone $3765 - $3763, SL $3759
Buy Zone: Zone $3754 - $3752, SL $3744
Sell Zone: Zone $3800 - $3802, SL $3810
The market is highly volatile. Do you think gold can hit the $3,800 mark this week? Share your thoughts! 👇
#Gold #XAUUSD #Fed #GoldAnalysis #TradingView #InterestRates #Inflation #ATH

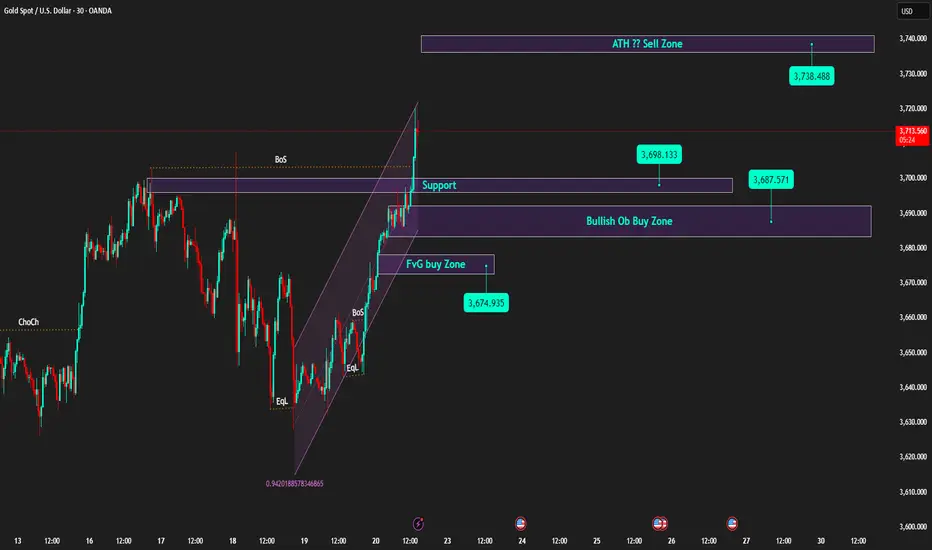
Weekly Candle Closes High | Prioritise Buying on Pullback to Sup🟡 XAU/USD – 22/09 | Captain Vincent ⚓
🔎 Captain’s Log – Quick Overview
Last week, gold closed around 3,685, paving the way for further advancement and a new ATH.
After the FED cut 25bps, Powell's 'brake' remarks slowed the rise, but the larger trend remains bullish.
This morning, prices surged to 3,697.xx, now slightly adjusting around 3,692 – 3,690 → a sensible strategy: wait for a pullback to continue Buying.
⏩ Captain’s Summary: The gold voyage still heads North, Buying remains the main choice, but wait for a pullback to board.
📈 Captain’s Chart – Technical Analysis
Golden Harbor (Support / Buy Zone):
Thin support: ~3,698 (recently broken old range top).
OB Dock: 3,687 – 3,690.
FVG Dock: 3,672 – 3,676 (liquidity check on deep pullback).
Storm Breaker (Resistance / Sell Zone):
3,714 – 3,720 (supply cluster / old ATH – likely to react).
Price Structure:
Continuous BoS series, price breaks short-term up channel and creates higher highs → bullish remains the main trend.
🎯 Captain’s Map – Trading Plan (before US session)
✅ Buy (trend priority)
Buy Zone 1
Entry: 3,698 – 3,701
SL: 3,688
TP: 3,706 – 3,714 – 3,720+
Buy Zone 2 (OB)
Entry: 3,687 – 3,690
SL: 3,680
TP: 3,698 – 3,706 – 3,714 – 3,72x
Buy Zone 3 (FVG)
Entry: 3,672 – 3,676
SL: 3,664
TP: 3,687 – 3,706 – 3,714
⚡ Sell (only scalp when overbought)
Sell Zone (ATH test)
Entry: 3,740 – 3,738
SL: 3,750
TP: 3,730 – 3,690 – 3,695
Captain’s Note ⚓
“The new week kicks off with a high-closing candle, the gold vessel continues its bullish course. Golden Harbor 🏝️ (3,690 – 3,672) is a safe anchorage for the crew to watch for Buys. Storm Breaker 🌊 (3,714 – 3,720) is the wave crest where winds may rise, suitable for Quick Boarding 🚤 short scalps. Before the US session, the seas might get choppy – hold the helm tight and manage volume wisely.”
FED countdown | Buy at support, Sell at resistanceXAU/USD – 17/09 | Captain Vincent ⚓
🔎 Captain’s Log – News Context
18/09, 01:00 (US time): FED rate decision + Dot Plot → policy outlook for upcoming meetings
01:30: Powell’s speech – the key market focus
Market consensus: FED almost certain to cut -25bps. However, the -50bps scenario still exists → if it happens, it will be a “big boost” for Gold
During Asia–Europe session, Gold faced early profit-taking, dropping quickly to 3,677 – 3,675, reflecting caution ahead of the FED
⏩ Captain’s Summary
Gold is making a technical pullback before the FED.
Medium-term trend remains bullish, but patience is needed to wait for better Buy entries.
📈 Captain’s Chart – Technical Analysis
Storm Breaker (Resistance / Sell Zone)
Nearby OB: 3,693 – 3,695 (short scalp)
ATH Zone: 3,717 – 3,720 (strong resistance, potential heavy selling)
Golden Harbor (Support / Buy Zone)
Shallow Dock: 3,656 – 3,657 (short-term)
Main Harbor: 3,629 – 3,630 (trendline confluence + old BoS)
Market Structure
Multiple BoS confirm bullish trend
Price retracing to support, likely to bounce back and test 3,693 – 3,717
Break above 3,720 → confirms new ATH
🎯 Captain’s Map – Trade Plan
✅ Buy (priority)
Buy Zone 1
Entry: 3,656 – 3,657
SL: 3,648
TP: 3,675 – 3,693 – 3,717
Buy Zone 2
Entry: 3,629 – 3,630
SL: 3,618
TP: 3,656 – 3,690 – 3,717
⚡ Sell (only at resistance)
Sell Zone OB
Entry: 3,693 – 3,695
SL: 3,705
TP: 3,690 – 3,685 - 3680 - 368x - 36xx
Sell Zone ATH
Entry: 3,717 – 3,720
SL: 3,727
TP: 3,715 – 3,710 – 3,705 - 37xx
⚓ Captain’s Note
“Before the FED countdown, profit-taking waves pulled the Golden ship toward Golden Harbor 🏝️ (3,656 – 3,629) .
Yet the main current still flows north, the bullish trend remains intact.
Storm Breaker 🌊 (3,693 – 3,720) is the big wave, suitable for short Quick Boarding 🚤 scalps.
Sailors must stay patient – the FED wind could be the force to propel Gold to new peaks.”

Gold 4H Outlook – Buy the Dip or Fade the Drop?On the 4H timeframe, Gold is consolidating just below 3,600 after a strong bullish rally. The current structure shows price pausing near premium levels, with liquidity building both above 3,600 and below 3,530. This indicates engineered sweeps are likely before the next major move.
📌 Key Structure & Liquidity Zones (4H):
🔼 Buy Zone 3,572 – 3,574 (SL 3,565): Fresh demand zone at intraday discount; potential continuation level.
🔽 Sell Scalp Zone 3,530 – 3,526 (SL 3,537): Short-term supply/pivot area; scalp opportunity if rejection happens.
📍 Liquidity Magnet 3,603 – 3,605: Upside imbalance area likely to get filled.
📊 Trading Ideas (Scenario-Based):
🔺 Buy Setup – Demand Zone Reaction
Entry: 3,572 – 3,574
Stop Loss: 3,565
Take Profits:
TP1: 3,585
TP2: 3,595
TP3: 3,605
👉 Demand block in line with bullish order flow. Watch for a liquidity sweep and rejection to fuel trend continuation.
🔻 Sell Scalp Setup – Short-Term Reaction
Entry: 3,530 – 3,528
Stop Loss: 3,537
Take Profits:
TP1: 3,520
TP2: 3,510
TP3: 3,500
👉 Intraday supply/pivot area. Best suited for quick scalp trades against the trend, targeting downside liquidity.
🔑 Strategy Note
Overall bias stays bullish, but intraday shorts can work for scalping purposes. The cleaner setup is to buy from 3,572–3,574 for continuation towards 3,600+. Smart money may attempt a liquidity sweep at 3,530 before pushing higher.

XAUUSD – Breakout Confirmed & Macro Outlook📊 Market Context & Macro View
Gold (XAUUSD) has broken out above its short-term descending trendline, signalling renewed bullish momentum after several sessions of consolidation. This breakout aligns with traders pricing in slower US inflation and growing confidence that the Federal Reserve may pause or ease monetary policy in the coming months.
🔹 Macro Drivers Supporting Gold:
Soft US CPI & PPI → Cooling inflation strengthens expectations for stable or lower rates.
Steady Treasury yields and a weaker USD continue to fuel gold’s upside.
Geopolitical tensions and central bank accumulation remain long-term bullish factors.
⚠ Risk: Liquidity sweeps remain possible before the Fed meeting—watch for fakeouts or sharp reversals.
🔑 Key Technical Levels (H1)
Immediate Resistance: 3,654.17 (React Zone FIB)
OBS Sell Zone: 3,664.52
Upper Liquidity Target: 3,679.31
Major Sell Liquidity: 3,709.85
Supports / Buy Liquidity Zones:
• 3,637.91 – Breakout Retest
• 3,631.63 – CP Support
• 3,622.41 – Deeper Liquidity Layer
• 3,584.78 – END Liquidity BUY ZONE
📈 Scenario & Outlook
London Session: Possible retest at 3,638–3,632 for liquidity collection before the next leg higher.
A clean break through 3,654 → 3,664 could spark strong buying toward 3,679–3,709.
Losing 3,622 would expose 3,584 as the next major support.
📌 Trading Plan
🔵 BUY ZONE 1: 3,635 – 3,633
SL: 3,629
TP: 3,640 → 3,645 → 3,650 → 3,660 → 3,670 → ???
🔵 BUY ZONE 2: 3,621 – 3,619
SL: 3,615
TP: 3,625 → 3,630 → 3,635 → 3,640 → 3,650 → 3,660 → ???
🔴 SELL ZONE: 3,708 – 3,710
SL: 3,715
TP: 3,704 → 3,700 → 3,695 → 3,690 → 3,680 → ???
🔴 SELL SCALP: 3,679 – 3,681
SL: 3,685
TP: 3,675 → 3,670 → 3,665 → 3,660 → ???
✅ Summary
Gold is maintaining its breakout, supported by softer US inflation and a weaker USD. While liquidity sweeps may occur, the overall trend remains bullish above 3,622.
👉 Follow MMFLOW TRADING for real-time updates, liquidity plays, and BIGWIN setups as gold reacts to key macro drivers and price zones.

XAUUSD – CPI Today: Liquidity Sweep & Trading Plan📊 Market View
Gold (XAUUSD) is moving under short-term resistance (descending trendline), indicating sellers still dominate in the short term. On the M30 chart, buy-side liquidity zones are clearly stacked at 3,624 → 3,612 → 3,599 → 3,586.
👉 During the European session, expect a breakdown liquidity sweep toward these support zones before any bullish reaction.
📈 CPI View – US Session
Soft CPI (below expectations) → Weaker USD, lower yields → Gold could bounce sharply from 3,612 / 3,599 / 3,586 and retest trendline/resistance.
Hot CPI (above expectations) → Stronger USD, higher yields → Gold may break 3,612, sweep deeper to 3,599 or 3,586, then recover.
⚠️ High risk of news traps: the first reaction can reverse quickly—wait for retests + confirmation candles before entering.
🔑 Key Levels
Dynamic Resistance (trendline): 3,643 – 3,646
React Zone FIB: 3,650 – 3,654
OBS Sell Zone: 3,665
Support / Liquidity Zones:
3,624.36 (Key Zone Support BUY)
3,612.60 (CP/React FIB)
3,599.31 (BUY ZONE)
3,586.49 (END LIQUIDITY – BUY ZONE)
📌 Trading Plan
🔴 SELL ZONE: 3,646 – 3,648
SL: 3,652
TP: 3,640 → 3,635 → 3,630 → 3,620 → 3,610 → ???
🔵 BUY SCALP: 3,612 – 3,610
SL: 3,605
TP: 3,616 → 3,620 → 3,625 → 3,630 → ???
🔵 BUY ZONE (Primary): 3,600 – 3,598
SL: 3,592
TP: 3,605 → 3,610 → 3,615 → 3,620 → 3,630 → 3,640 → ???
🛡️ Backup BUY: (If liquidity sweep deepens) 3,58x
Hard SL: 3,578
❗ If 3,578 breaks, don’t re-enter immediately—CPI volatility can extend the move further.
⚠️ Notes & Risk
Reduce position size near the CPI release.
Wait for confirmation (pin bar / engulfing / retest) before entering trades.
Use staggered TPs to lock in profits early.
An M30 close above 3,654 invalidates near-term shorts and opens 3,665.
✅ Summary
Gold may sweep liquidity into the buy zones before bouncing. Trade the reaction: SELL at 3,646–48 on rejection, BUY at 3,612/3,600 on a clean bounce, and hold a backup BUY at 3,58x with tight risk.
👉 Follow MMFLOW TRADING for real-time updates and BIGWIN setups during CPI volatility.

Gold 1H – Buy the Dip, Watch 3,687 Premium SupplyOn the 1-hour chart, Gold is trading above 3,650 after a clear break of structure. Price has created demand footprints near 3,636 and deeper at 3,594, while resistance is seen around 3,670 and premium supply is at 3,687–3,689. This indicates a possible engineered retracement into discount demand zones before a move towards liquidity above 3,688.
📌 Key Structure & Liquidity Zones (1H):
• 🔼 Buy Zone 3,636 – 3,634 (SL 3,630): Fresh demand block in line with bullish flow.
• 🔼 Buy Zone 3,594 – 3,592 (SL 3,587): Deeper discount demand, strong base for buyers.
• 🔽 Sell Zone 3,687 – 3,689 (SL 3,694): Premium supply zone, possible liquidity sweep.
📊 Trading Ideas (Scenario-Based):
🔺 Buy Setup – Demand Block Reaction
• Entry: 3,636 – 3,634
• Stop Loss: 3,630
• Take Profits:
TP1: 3,650
TP2: 3,665
TP3: 3,680+
👉 Expect retracement into discount demand before price continues bullish.
🔺 Buy Setup – Deeper Demand Test
• Entry: 3,594 – 3,592
• Stop Loss: 3,587
• Take Profits:
TP1: 3,610
TP2: 3,625
TP3: 3,640+
👉 Best for swing buyers seeking higher risk-reward on a deeper liquidity grab.
🔻 Sell Setup – Premium Rejection
• Entry: 3,687 – 3,689
• Stop Loss: 3,694
• Take Profits:
TP1: 3,670
TP2: 3,655
TP3: 3,640
👉 Short-term liquidity grab at premium levels, good only for scalping with strict risk.
🔑 Strategy Note
Overall bias remains bullish, but smart money may push price into 3,636 or even 3,594 demand zones before expanding higher. Safer setups are buying dips; short positions at 3,687 should be treated only as quick scalps.

GOLD crosses $3500! What’s next for Indian traders?Gold (XAUUSD) has shown massive momentum, moving nearly 50–60 points daily. Price is now reacting at an important FIBO extension level. Sellers are stepping in, but so far there is no strong confirmation on higher timeframes (H1–H2).
📊 MMFLOW VIEW
Sideways consolidation → Breakout → New ATHs every day.
Liquidity & FVG zones are still favoring the BUY side.
SELL is only safe when higher timeframe volume confirms.
For now: Focus on BUY entries from liquidity zones.
🔑 KEY LEVELS
Resistance: 3440–3446 (ATH) | 3564 | 3576 | 3586 | 3595
Support: 3528 | 3508 | 3494 | 3480 | 3468
🎯 MMFLOW PLAN
✅ BUY ZONE: 3481 – 3479
SL: 3474
TP: 3486 – 3490 – 3495 – 3500 – 3510 – 3520 – 3530 – ???
✅ BUY SCALP: 3496 – 3494
SL: 3490
TP: 3500 – 3510 – 3520 – 3530 – 3540 – ???
❌ SELL ZONE: 3576 – 3578
SL: 3584
TP: 3570 – 3565 – 3560 – 3555 – 3550 – 3540 – 3530 – 3520 – 3510 – 3500
⚠️ Important for Indian traders: GOLD is extremely volatile right now. Don’t rush into trades.
👉 Wait for confirmation at Key Levels, use proper Risk Management, and target smart entries for maximum profit.
🔥 This is the MMFLOW TRADING PLAN – Follow us on TradingView for daily GOLD strategies and never miss the next big move!
