Bitcoin scalping Scalping study with vwap,cpr and ema.
Based on this study can backtest for FnO trades swing trades.
Search in ideas for "SCALP"


Gold scalp buyingScalp buying to 1790.
P S am still learning the charts don't follow blindly ,suggestions are always welcome.


HDFC LIFE Buying opportunity for quick scalpScalp long HDFCLIFE
Retest of all time highs soon
Mid Term holders can keep it for further growth toward new highs


Bajaj Finance Scalping Opportunity Scalping opportunities in Bajaj Finance. Chart is a combination of multiple TFs. Look on daily, 4 hourly and hourly!


Gold Plan 18/08 – Captain VincentBackground
For the past two days, Gold has repeatedly tested the 3332 – 3334 zone and slipped down to 3323, showing that buyers at this level are losing strength.
The broader trend still leans bullish, but the market is heavily influenced by geopolitics and news events:
📰 US–Russia preparing for a new round of Ukraine talks (15 Aug, Alaska).
🌐 Trump’s tariff stance remains unclear, adding volatility to Gold.
💵 Fed is likely to cut 25bps in September, keeping Gold in “defensive but ready to break out” mode.
➡ With this backdrop, today’s plan requires flexibility: Buy with trend, Sell scalp at key resistances.
1. Buy Scalp – Quick Boarding 🚤
Entry: 3324 – 3326
SL: 3320
TP: 3328 → 3332 → 3336 → 33xx
Note: Only suitable for quick scalps, avoid holding longer.
2. Main Buy Zone – Safe Harbor ⚓
Entry: 3313 – 3311
SL: 3304
TP: 3314 → 3319 → 3325 → 3330
Meaning: This is the main launchpad for buyers if price corrects deeper.
3. Sell Scalp Zone – Storm Breaker 🌊
Entry: 3366 – 3377
SL: 3383
TP: 3362 → 3355 → 33xx
Meaning: Short-term resistance, ideal for quick reaction sells.
4. Main Sell Zone – Watchtower ⛩
Entry: 3396 – 3394
SL: 3402
TP: 3390 → 3385 → 3380 → 33xx
Meaning: Strong resistance zone, highly likely to trigger a bearish reaction.
If broken, Gold may extend further into 34xx.
Today’s Scenarios
If price dips to 3324 – 3326 → Quick Buy Scalp.
If price drops deeper → Prefer to Buy at Safe Harbor (3313 – 3311).
If price rises to 3366 – 3377 → Short-term Sell Scalp.
If price tests 3396 – 3394 → Stronger Sell, this is the main resistance.
Captain’s Note:
"The Gold ship still sails North ⚓ today, but each time it hits Storm Breaker 🌊 or Watchtower ⛩, the sails will drop for a quick strike before retreating. Waves from Trump–Putin headlines and the Fed’s next move may stir up rough seas. Remember, mates: better to miss one trade than let the waves sink the ship." 🏴☠️

Indicators for ScalpingIndicators for Scalping
There are various methods used for making a profit in intraday trading. One such method, often known only to experienced traders, is scalping.
This involves making numerous trades throughout the day to capture small price movements. Scalping requires precision and quick decision-making, distinguishing it from other trading approaches.
This article explores the essential indicators that can assist scalpers in maximizing their results while using this fast-paced style of trading.
What is Scalping?
Scalping can be defined as a trading method in which traders try to capitalize on small price changes normally after executing a trade and becoming profitable.
For instance, multiple traders within a 5-minute or 10-minute timeframe.
Most of these traders have a well-defined exit strategy regarding their trades because they know that a loss could easily wipe out all those smaller gains obtained through hard work.
To be able to successfully do scalping, many traders use scalping indicators, which we will cover next.
Top Scalping Indicators
Traders aiming to excel in scalping should familiarize themselves with the top five scalping strategy indicators. These are:
1. The SMA Indicator
A Simple Moving Average (SMA) Indicator is one of the key tools commonly used by traders to build their trading strategies.
It calculates the average price of an asset over a set period, assisting traders in determining if the prices of their securities, commodities, or currencies are going up or down.
Essentially, SMA assists in identifying price trends by finding a mean of past closing prices and dividing this summation by the number of periods.
SMA is also known as the arithmetic moving average. It provides a clear view of the asset's price direction, making it a key indicator for trend analysis.
2. The EMA Indicator
The Exponential Moving Average (EMA) is another valuable tool for traders, offering a way to prioritize recent prices more heavily compared to the Simple Moving Average (SMA), which treats all prices equally.
The EMA is particularly favored in scalping strategies because it reacts more swiftly to recent price movements.
Traders commonly use the EMA to generate buy and sell signals based on crossovers and divergences between historical averages.
3. The MACD Indicator
Another widely used scalping indicator among traders is the Moving Average Convergence Divergence (MACD) indicator. It's versatile and suitable for various trading styles.
The MACD helps traders gauge momentum and track trends effectively. It illustrates the relationship between two moving averages of a security’s price.
To calculate the MACD, traders subtract the 26-day Exponential Moving Average (EMA) from the 12-day EMA. The 9-day EMA, known as the signal line, is used as the default setting to identify buying and selling signals.
4. The Parabolic SAR indicator
The Parabolic Stop and Reverse (SAR) indicator is another valuable tool for traders, providing insights into price action trends.
During an uptrend, the SAR indicator plots points below the price, while in a downtrend, it places points above the price. This helps traders identify potential price reversals.
The SAR indicator aids in assessing short-term momentum and deciding on stop-loss placements. It is most effective when markets exhibit consistent trends.
5. The Stochastic Oscillator indicator
The Stochastic Oscillator is popular among traders. It operates on the principle that momentum leads to price changes.
Traders rely on this scalping indicator to get early signals of price movements before they happen. The Stochastic Oscillator is based on the idea that an asset's closing price tends to be near the higher end of its price range for the day.
Despite its complexity, many traders find the Stochastic Oscillator to be a dependable tool for making buy and sell decisions.
6. Volume Weighted Average Price (VWAP)
The Volume Weighted Average Price (VWAP) calculates the average price at which a security has traded throughout the day, taking into account both its trading volume and price. It is calculated by taking the total dollar amount traded for the security and dividing it by the total volume traded.
VWAP is particularly useful for scalpers as it helps them understand the true average price of a security, allowing them to make more informed trading decisions. By comparing the current price to the VWAP, traders can determine if the price is above or below the average, indicating potential buying or selling opportunities.
This indicator is often used in conjunction with other technical analysis tools to enhance trading strategies.
7. Relative Strength Index (RSI)
The Relative Strength Index (RSI) is a momentum oscillator that measures the speed and change of price movements to identify overbought or oversold conditions in a market. It ranges from 0 to 100 and is typically used to determine if a security is being overbought (above 70) or oversold (below 30).
When the RSI crosses these thresholds, it can signal potential reversal points, helping traders make informed decisions about entering or exiting trades.
Analyzing the RSI helps scalpers gauge the strength of a trend and anticipate possible price corrections, enhancing their ability to capitalize on short-term price movements.
Conclusion
Scalping is a useful but demanding trading method that involves making quick decisions to profit from small price changes. Using the right tools can help traders find the best times to buy and sell.
Although it takes practice and a good understanding of market trends, learning about scalping indicators can help traders earn a profit.

Gold Plan 26/08 – Captain VincentXAU/USD – Trump’s surprise move sparks a Gold rally. What’s the next scenario?
1. News Wave 🌍
Trump unexpectedly dismissed FED Governor L. Cook , citing “irresponsible recent financial decisions.”
👉 A political–monetary shock that pushed Gold up by more than 30 points from the 3,350 – 3,352 zone, as investors feared internal instability at the FED could weaken the USD.
Safe-haven demand has been activated, but Gold is unlikely to “fly in a straight line.” The market often requires a pullback to fill liquidity gaps before a clear trend develops.
2. Technical Outlook ⚙️
Price bounced sharply from Golden Harbor 🏝️ (Buy Zone 3350 – 3342) – a key support area.
Currently, Gold is testing Storm Breaker 🌊 (Resistance 3384 – 3400) , a liquidity cluster → potential for profit-taking sell orders.
On H1, multiple FVGs formed around 3363 and 3355 → price may retrace to “fill the gap” before continuing.
👉 Intraday bias: Prioritise Sell at resistance, but watch for short Buy Scalp setups at Quick Boarding 🚤 (3342 – 3340) .
3. Captain Vincent’s Map – Key Levels 🪙
Storm Breaker 🌊 (Main Resistance): 3384 – 3400
Quick Boarding 🚤 (Buy Scalp): 3342 – 3340 | SL 3333 | TP: 3345 → 3347 → 3350 → 33xx
Golden Harbor 🏝️ (Buy Zone): 3350 – 3342
FVG Zones: Around 3363 & 3355 (short-term price magnets)
4. Trade Scenarios 📌
🔻 SELL at Storm Breaker 🌊 (Priority)
Entry: 3400 – 3402
SL: 3408
TP: 3395 → 3390 → 33xx
🔺 BUY Scalp – Quick Boarding 🚤
Entry: 3342 – 3340
SL: 3333
TP: 3345 → 3347 → 3350 → 33xx
5. Captain’s Note ⚓
"Trump’s news wave pushed Gold like an unexpected headwind. But Storm Breaker 🌊 ahead may unleash rough seas. The wise will anchor at Golden Harbor 🏝️ , while the bold may ride Quick Boarding 🚤 for fast scalps. And remember: today’s golden sea depends on the sharks at the helm."

Gold Plan 13/08 – Captain VincentGold Plan 13/08 – Captain Vincent ⚓
News Background
📊 Gold is holding steady near $3,350/oz after the US July CPI release.
Headline CPI : 2.7% (below forecast of 2.8%) 📉
Core CPI: 3.1% (up from 2.9%) 📈
➡ This cools down inflation fears from tariffs and increases the probability of a 25 bps Fed rate cut in September , which is bullish for Gold.
Key factors to watch:
💼 Market awaiting more data: PPI, jobless claims, retail sales.
🔍 Tariff drama: Trump says no tariffs, but US Customs just listed 1kg & 100oz gold bars under taxable imports.
🌐 US extends the trade truce with China for another 90 days.
🕊 US–Russia talks on Ukraine scheduled for 15 Aug in Alaska.
News conclusion:
Lower-than-expected CPI + higher Fed cut chances = Gold remains positive.
But tariff and geopolitical risks must be tracked closely.
Yesterday’s Action (12/08)
Gold tapped the Buy Scalp – Quick Boarding 🚤 zone and bounced ~290 pips .
However, it failed to break decisively above the zone and moved sideways around support.
Technical Plan – 13/08
1. Sell Scalp – Quick Boarding Reverse ⚓
Entry: 3,374 – 3,376
SL: 3,382
TP: 3,368 → 3,362 → 3,355 → 3,3xx
Reason: Short-term resistance, suitable for quick sell scalps when price retests higher.
2. Sell Zone – Storm Breaker 🌊
Entry: 3,405 – 3,406
SL: 3,411
TP: 3,395 → 3,385 → 3,375 → 3,365
Reason: Major resistance zone aligned with previous highs and trend channel.
Scenarios:
Price likely to rise from current sideways range to test either Sell Scalp or Storm Breaker.
Priority: Sell if reversal signals (pin bar, engulfing) appear on M15/H1 at these zones.
If price breaks above Storm Breaker and holds above 3,411 → cancel sell plan, wait for new structure.
Captain’s Note:
"The CPI wave has anchored the Gold ship near 3,350. Today, the crew is ready to set sail towards Sell Scalp and Storm Breaker, waiting for the winds to shift for a profitable turn." ⚓🌊

Gold preparing for correction under FED & geopolitic - Vincent🟡 Gold Plan 25/08 – Captain Vincent ⚓
1. Market Context 🌍
Russia – Ukraine: Trump puts pressure on Putin to negotiate within 2 weeks. This looks positive for peace, but also carries escalation risks → Gold keeps its safe-haven role .
FED – Powell at Jackson Hole: Hawkish tone reduced expectations of a September rate cut from 3 to 2. USD strengthened → short-term downside pressure on Gold .
👉 Mix of political support vs FED pressure → Sideways market, Gold may need a pullback to absorb liquidity before showing clear direction.
2. Technical Outlook ⚙️
H4 candle closed bearish → Buying momentum weakens , sellers may return.
Recent FVG created after sharp bounce → Likely pullback for liquidity grab .
Bias of the day: Prioritise Sell, but short Buy Scalp setups possible at support.
3. Key Levels – Captain Vincent’s Map 🪙
Resistance:
Storm Breaker 🌊 (Sell Zone 3398 – 3400)
3376 (intermediate resistance – watch reaction)
Support:
Quick Boarding 🚤 (Buy Scalp 3340 – 3342)
SL: 3333
TP: 3345 → 3349 → 3353 → 3357 → 33xx
Golden Harbor 🏝️ (Buy Zone 3328 – 3326)
SL: 3318
TP: 3332 → 3336 → 3339 → 33xx
Higher Low – 3323
Anchor point of the trend → If broken, need to reassess all Buy setups.
4. Trade Scenarios 📌
🔻 Sell at Storm Breaker 🌊
Entry: 3398 – 3400
SL: 3408
TP: 3395 → 3390 → 3387 → 3384 → 33xx
🚤 Buy Scalp at Quick Boarding
Entry: 3340 – 3342
SL: 3333
TP: 3345 → 3349 → 3353 → 3357 → 33xx
🏝️ Buy at Golden Harbor (3328 – 3326)
SL: 3318
TP: 3332 → 3336 → 3339 → 33xx
5. Captain’s Note ⚓
"Today, the golden sea is full of undercurrents: FED winds blow against, politics push along. Those who pick Storm Breaker 🌊 may ride the wave safely; those who patiently wait at Golden Harbor 🏝️ will find peace. Quick Boarding 🚤 is for sailors seeking fast scalps in narrow waters."

GOLD 16/07 Minor Pullback Before PPI? Bears May Reclaim Control!GOLD 16/07 – Minor Pullback Before PPI? Bears May Reclaim Control!
🌍 Market Overview: Inflation Softens, But Risk Remains
Gold is currently trading around $3,334 after a sharp correction earlier this week. While core US CPI data for June came in lower than expected, institutions like BlackRock are signaling concerns:
The impact of new tariffs is only starting to show.
Consumer prices on appliances and electronics are rising.
As inventories shrink, businesses may pass on costs directly to consumers.
➡️ This reinforces Gold’s long-term value as a safe-haven asset, especially with rising macroeconomic risks and uncertainty around the Fed's next move.
📉 Technical Insight: Pullback or Trend Continuation?
Yesterday’s CPI release triggered a sharp drop, pushing price back to the 332x zone.
This created a Fair Value Gap (FVG) on the H1 chart.
Around the 3347–3349 level, we see a Continuation Pattern (CP) forming, hinting that the main downtrend might resume after a temporary bounce.
💡 If price returns to the 334x–336x supply zones during the London or New York session, these will be critical SELL zones. Expect price to potentially target the FVG liquidity area below 329x if bears regain control.
📊 Key Trade Setups
🔵 BUY ZONE: 3,296 – 3,294 (Liquidity Trap Zone)
SL: 3,290
TP: 3,300 → 3,304 → 3,308 → 3,312 → 3,316 → 3,320 → 3,330
🔴 SELL SCALP: 3,347 – 3,349 (CP Reaction Area)
SL: 3,353
TP: 3,343 → 3,340 → 3,336 → 3,330 → 3,325 → 3,320 → 3,310 → 3,300
🚨 SELL ZONE: 3,358 – 3,360 (VPOC Zone)
SL: 3,364
TP: 3,354 → 3,350 → 3,346 → 3,340 → 3,330 → 3,320 → 3,300
⚠️ Strategy Note:
With the PPI data release expected to move markets today, price may spike upward in early sessions. Watch closely for bearish rejection candles around CP and VPOC zones before entering. Use proper SL and TP levels to protect capital.
💬 What’s Your Outlook Today?
Do you see gold breaking below 329x to fill deeper liquidity, or will macro risks support a fresh rally?
👇 Drop your thoughts and let’s discuss trade ideas in the comments!

Is a Pullback Coming or Will the Bulls Continue?Gold Faces Resistance at 3300 – Is a Pullback Coming or Will the Bulls Continue?
Market Overview: USD Gains Pressure Gold as Trade Deals Unfold
Gold has been under pressure recently due to the strong recovery of the US dollar. Positive developments in global trade talks and agreements between major nations, including the US, have been a key driver for the USD, which in turn has weighed on gold.
US inflation data continues to show signs of easing, providing the Fed more room to hold off on rate hikes, strengthening the USD.
FOMC meeting minutes due this week will provide further insight into the Fed’s approach to interest rates.
With geopolitical tensions easing and trade deals stabilizing, the demand for safe-haven assets like gold is slightly reduced.
In the short-term, the market is testing crucial levels, and while gold remains bullish in the long run, the current market conditions suggest potential for a pullback before further upside.
Technical Analysis: Gold in a Range-Bound Market
Looking at the H1 timeframe, gold has formed a clear downward channel between 3360 and 3290, which could signal further corrective action if the price remains within this range. If gold fails to break above resistance at 3360, a dip to 3250 might occur, especially if the USD strength continues to put pressure on gold.
However, waiting for confirmation patterns before entering a trade is key. False breakouts can be a risk when price moves quickly through key levels without sustaining momentum.
Buy Bias in Short-Term with Caution on Bearish Moves
Given the current market structure, there is more room for buy opportunities than for selling at the moment. Watch out for a potential bounce back in the 3320-3325 region as gold might test these levels before continuing its rise. The rejection wick on yesterday's D1 candle shows that the sellers are losing control, and buying pressure is starting to build again.
In the M30 chart, there's a continuation pattern forming around the 16-14 zone, which could be an ideal place to enter a buy position if it holds.
Resistance and Support Levels:
Key Resistance Levels: 3302 – 3310 – 3324 – 3335 – 3361
Key Support Levels: 3275 – 3259 – 3248
Trading Strategy – Buy and Sell Zones
BUY ZONE:
3250 – 3248
Stop Loss: 3244
Take Profit: 3254 → 3258 → 3262 → 3266 → 3270 → 3280 → ????
SELL SCALP:
3303 – 3305
Stop Loss: 3310
Take Profit: 3298 → 3294 → 3290 → 3286 → 3280 → 3270 → 3260
SELL ZONE:
3334 – 3336
Stop Loss: 3340
Take Profit: 3330 → 3326 → 3320 → 3315 → 3310 → 3305 → 3300 → ????
Key Updates to Watch: FOMC and Trade Policy News
With FOMC minutes due and trade policy developments on the horizon, it’s crucial to stay alert for any shifts in market sentiment. Ensure you stick to TP/SL levels to protect your account from any unexpected volatility.

XAUUSD – Market Stays Flat Despite Trump’s Super BillXAUUSD – Market Stays Flat Despite Trump’s Super Bill, Is Gold Quietly Building Momentum?
Gold has entered a narrow consolidation phase after a series of strong macroeconomic catalysts — including the passing of Trump’s Super Bill by the U.S. House of Representatives. But instead of rallying immediately, gold remains flat... and that silence could be louder than it seems.
📰 Macro Recap – Good for USD, Bad for Gold?
The approved Super Bill may weaken the U.S. dollar in the medium term due to rising fiscal deficits. But for now, the market is skeptical, and gold is not reacting as expected.
Meanwhile, the NFP and Unemployment Rate (UR) data came in surprisingly strong last night, reinforcing the possibility that Fed rate cuts may be delayed → A short-term bearish pressure on gold.
With the U.S. Independence Day holiday, market liquidity will likely remain low today, increasing the risk of fake breakouts or stop-hunting volatility.
❗ “No immediate rally doesn’t mean no rally at all.” A retracement to the 3.2xx zone could offer an ideal entry for medium-term longs.
📉 Technical Outlook – XAUUSD
Price has broken above the recent short-term downtrend line and is now testing a critical supply zone around 3344–3345, which may determine today’s intraday direction.
🔍 Key Levels
Major Resistance: 3345 – 3362 – 3374 – 3388 – 3390
Major Support: 3330 – 3312 – 3304 – 3302 – 3298
🟢 Bullish Strategies (Buy Setups)
🔹 BUY Scalp Zone:
3313 – 3311
SL: 3307
TP: 3316 – 3320 – 3325 – 3330 – 3335 – 3340 – 3345 – 3350
🔹 Deep BUY Zone:
3304 – 3302
SL: 3298
TP: 3308 – 3312 – 3316 – 3320 – 3330 – 3340
These zones align with EMA confluence and potential FVG retracements – a solid setup for trend continuation.
🔴 Bearish Strategies (Short-Term Only)
🔹 SELL Scalp Zone:
3362 – 3364
SL: 3368
TP: 3358 – 3354 – 3350 – 3346 – 3340 – 3335 – 3330
🔹 Upper SELL Zone:
3388 – 3390
SL: 3394
TP: 3384 – 3380 – 3376 – 3370 – 3365 – 3360
Consider shorting only with confirmation patterns or bearish signals from lower timeframes.
🧠 Market Sentiment Today
The market seems to be in a wait-and-see mode, consolidating between 3320 – 3340 as traders digest recent macro data. A breakout is likely after the U.S. holiday ends.
Primary Scenario: Look to BUY on deeper pullbacks into support zones.
Alternate Scenario: SELL only for intraday scalps when price rejects key resistance.
💬 What’s Your Take?
Is gold silently accumulating strength for a breakout above 3390?
Or are we about to witness a deeper correction in the coming sessions?
👇 Share your thoughts in the comments and let's discuss it together!

Retracement probability on MOTHER SUMI..In past 6 working days MOTHERSUMI almost gained 30%. Now expect a good retracement.
If MOTHERSUMI giving a gap up opening tomorrow, can expect a high volume of profit booking and obviously scalpers will also comes to market for shorting. That's why am expecting a high retracement !!!!

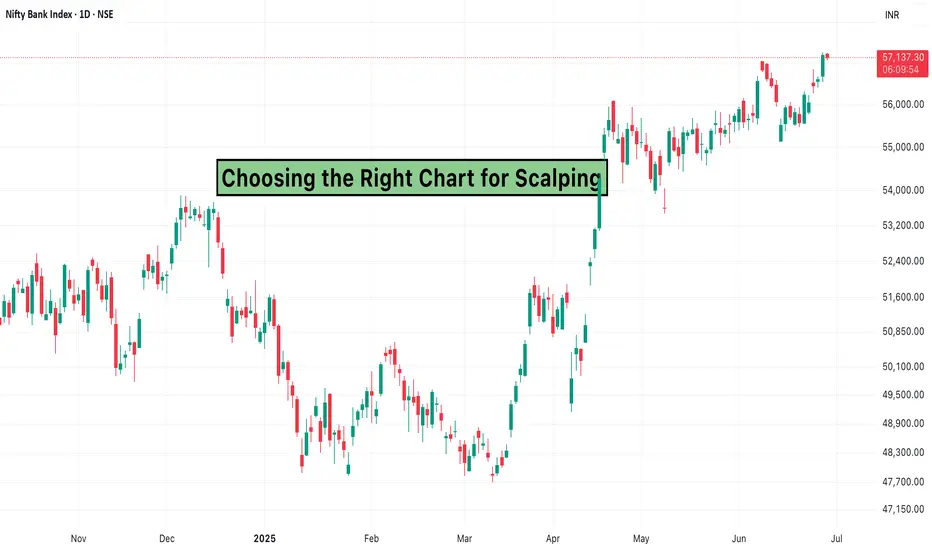
Choosing the Right Chart for ScalpingIf you're into scalping, you already know how important timing is. One of the most common questions that pops up among scalpers is—should I use a 1-minute chart or a 5-minute chart?
While both charts are designed for short-term trading, the experience of using them is quite different.
The 1-minute chart is all about speed. It shows price action in real-time, updating with every tick. This is great if you’re looking to capitalize on even the smallest moves in the market. But with speed comes noise plenty of it.
You’ll see a lot of whipsaws and minor fluctuations that can trigger false entries if you’re not careful.
The 5-minute chart, on the other hand, provides more clarity. It filters out some of that noise and helps you focus on more meaningful price patterns. This is especially useful if you like confirmation before pulling the trigger. You may not catch every quick scalp, but you’ll likely enter with more confidence and stay in the trade longer when the setup is right.
Here’s a simple way to think about it:
Use the 1-minute chart if you’re comfortable reacting fast, handling volatility, and spotting micro setups.
Use the 5-minute chart if you want more structure, clearer trend formations, and fewer false alarms.
Use both together for the best of both worlds—trend direction from the 5-min chart and refined entries from the 1-min.
TradingView makes it easy to switch between both charts and even view them side by side. So if you’re still unsure which suits you best, experiment.
Watch how your favorite indicators respond. Try backtesting your setups on both. Let the chart that makes your decisions easier guide your trading strategy.
Conclusion: The best timeframe is the one that matches your trading personality and risk tolerance.
Whether you prefer the speed of the 1-minute or the clarity of the 5-minute, understanding both will give you more flexibility and confidence on your trades.
BTC SCALP #liquidity #sweepLet’s try this risky scalp. Overall bearish for short term. But scalping this trade right now.
Manage your own trade.
Thanks

Intraday VEDL LongVEDL has seen a good day or two of range bound trading. I f VEDL crosses above 229.65 with volume tomorrow il buy for a scalp trade with targets of 231-231.50 and a stop of 228.30. i will trail my stops as and when these levels are reached till RSI turns downwards!

Gold Plan 27/08 – Captain Vincent (IN)XAU/USD – Trump strengthens control over the FED, Gold consolidates near Storm Breaker
1. News Wave 🌍
Trump: “We will soon have majority control at the FED. Miran may be moved to another position with a longer term.”
Trump: “I already have a candidate in mind to replace FED Governor L. Cook.”
US Senate: Preparing hearings next week for Trump’s nominee – S. Miran .
👉 Message: Trump is consolidating power within the FED. Market fears FED losing independence → USD volatility rises, Gold benefits from safe-haven flows .
2. Technical Outlook ⚙️
Gold is approaching Storm Breaker 🌊 (3400 – 3402) , overlapping with resistance 3392 – 3406 → profit-taking likely .
On H1, multiple FVGs remain unfilled around 3355 & 3330 → Price may correct to retest these supports before choosing direction.
Intraday bias: Range-bound → Sell at resistance, short Buy at supports.
3. Captain Vincent’s Map – Key Levels 🪙
Resistance (Kháng cự):
3406 – 3400 – 3392 (Storm Breaker 🌊)
Support (Hỗ trợ):
3372 (Minor Shield 🛡️)
3355 (Quick Boarding 🚤 – Buy Scalp Zone)
3344 (Intermediate Shield 🛡️)
3330 (Golden Harbor 🏝️ – Main Buy Zone)
4. Trade Scenarios 📌
🔻 SELL at Storm Breaker 🌊 (Priority)
Entry: 3400 – 3402
SL: 3408
TP: 3395 → 3393 → 3389 → 3386 → 33xx
🚤 BUY Scalp – Quick Boarding
Entry: 3353 – 3355
SL: 3345
TP: 3358 → 3361 → 3363 → 33xx
🏝️ BUY at Golden Harbor (Strong Support)
Entry: 3330 – 3332
SL: 3325
TP: 3335 → 3338 → 3341 → 33xx
5. Captain’s Note ⚓
"Gold today faces Storm Breaker 🌊 above, but multiple shields of support remain below. Smart traders will scalp quickly at Quick Boarding 🚤, or patiently wait for Golden Harbor 🏝️ to anchor safely."

Gold under EMA pressure Buy at support,short scalp at resistance🟡 XAU/USD – Captain Vincent ⚓
🔎 Captain’s Log – Context & News
FED : Probability of a 25bps cut in October is 91.09% → almost certain.
US Calendar today : GDP, Jobless Claims, Durable Goods Orders, and especially speeches from 3 FED officials → strong volatility expected.
Gold yesterday : Dropped deeply but reacted precisely at key support → according to Vincent, this sell-off was mainly due to investors being cautious ahead of tomorrow’s CPI data.
⏩ Captain’s Summary : Short-term waves are pressured by EMAs, but the bigger voyage remains bullish – sailors prioritize Buy at Golden Harbor, only Quick Boarding 🚤 when facing Storm Breaker.
📈 Captain’s Chart – Technical Analysis (H30, EMA 34 & EMA 89)
EMA : EMA 34 (yellow) crossing below EMA 89 (red) → short-term bearish signal.
Trend : Overall still bullish, with Bullish OBs and Buy Zones below acting as strong supports.
Storm Breaker (Resistance / Sell Zone)
3,769 – 3,777 (Bearish OB)
Golden Harbor (Support / Buy Zone)
3,734 – 3,718 (Bullish OB)
3,687 – 3,685 (Buy Zone OB)
3,650 – 3,648 (Deeper Buy Zone, confluence with EMA 89)
🎯 Captain’s Map – Trade Plan
⚡ Sell (short-term scalp)
Entry: 3,776 – 3,773
SL: 3,783
TP: 3,770 – 3,765 – 3,760 – 3,755 – 3,750
✅ Buy (main priority)
Buy Zone 1 (OB)
Entry: 3,687 – 3,685
SL: 3,678
TP: 3,700 – 3,705 – 3,710 – 3,715 – 3,720
Buy Zone 2 (Deeper OB)
Entry: 3,650 – 3,648
SL: 3,638
TP: 3,665 – 3,670 – 3,675 – 3,680 – 3,685
⚓ Captain’s Note
“The Golden sails are facing headwinds from short-term EMAs, but Golden Harbor 🏝️ (3,734 – 3,650) remains a solid support dock. Storm Breaker 🌊 (3,769 – 3,777) is only suitable for short Quick Boarding 🚤 scalps. Tonight, the US sea will bring big waves from data & FED speeches – sailors, tighten your sails and manage trades with discipline.”
📢 If you find Captain’s Log useful, don’t forget to Follow for the latest updates.
💬 Do you have a different view on Gold? Drop a comment and join the crew discussion!
