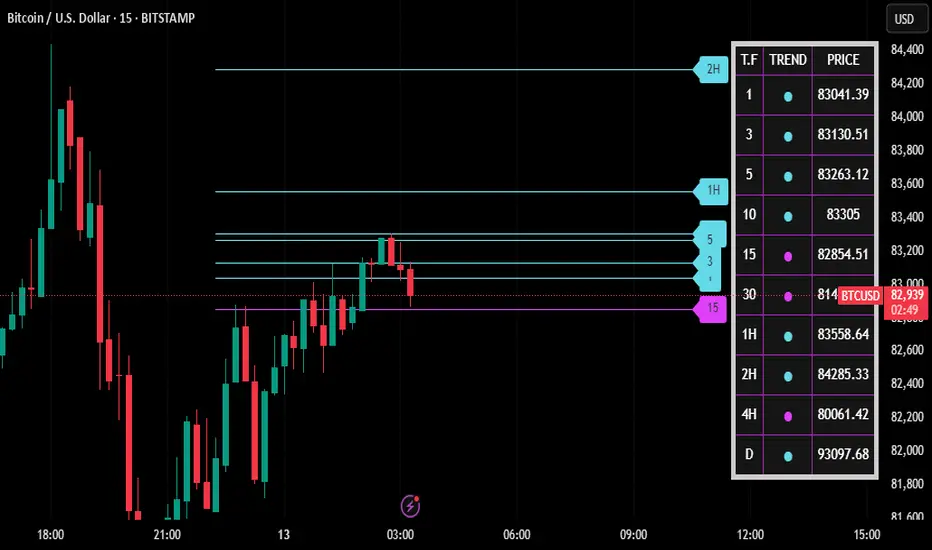
Bitcoin Scalping with Multi-Timeframe Parabolic SAR Bitcoin Scalping with Multi-Timeframe Parabolic SAR – A Smarter Approach 🚀
Scalping Bitcoin can be challenging, especially with rapid fluctuations and false signals. The Multi-Timeframe Parabolic SAR (PSAR) approach helps traders filter out noise by aligning lower and higher timeframe signals. This method ensures better trade accuracy by following the dominant trend before executing scalp trades.
⸻
How It Works 🔍
✅ Parabolic SAR (PSAR): A classic trend-following indicator that places dots above or below the price to signal trend direction.
✅ Multi-Timeframe Confirmation: Instead of relying on a single timeframe, this method overlays higher-timeframe PSAR values (e.g., 15M, 1H) onto a lower timeframe (e.g., 5M).
✅ Trend Alignment: A scalp entry is considered only when both higher and lower timeframes show a matching trend direction.
⸻
Why This Works for Scalping ⚡
🚀 Reduces False Signals: By filtering short-term trades with higher timeframe trends, traders avoid entering counter-trend setups.
🚀 Improves Precision: Entries and exits become more reliable when both timeframes confirm a trend.
🚀 Works in Any Market Condition: Whether Bitcoin is ranging or trending, multi-timeframe PSAR keeps you in sync with momentum.
⸻
Example Setup 📊
🟢 Long Entry: If 15M & 1H PSAR dots appear below price while the 5M chart shows a bullish crossover.
🔴 Short Entry: If 15M & 1H PSAR dots appear above price while the 5M chart flips bearish.
What do you think? Would you integrate multi-timeframe PSAR into your Bitcoin strategy? Let’s discuss below!
(P.S. Keep an eye on TechnoBlooms for more innovative indicators! 🚀)
Search in ideas for "SCALP"
Tata Consumer Product-Probable 4% moveTata Consumer would have been an excellent pick for a swing but with Nations preparing for a probable Nuclear strike I wouldn't suggest going long at the moment.
This script looks excellent for a quick scalp. The first hour might see a correction but once the script starts moving, it's likely to gain a good upward momentum.
Remember - the first hour is crucial. If the stocks falls and breaks the previous days low, it will likely not have an upward momentum.
PS: I haven't been posting much of late due the Russia-Ukraine war that has made it impossible to read and predict a good trend. You will likely be hitting more stop-losses than upper targets. I have switched to Intraday trades and I trade the same stock the next day if I see a continuation of an uptrend or downtrend. I have temporarily stopped carrying my positions. Protecting my capital is far more important than unnecessary and unwanted headaches.
So please trade safe until this crisis is over.
======
Remember, if the overall market dips, most stocks will also go skinny dipping.
Happy Trading!

NIFTY SCALPING LEVELS FOR 20/06/2022
Nifty can consolidate/sideways on Monday unless we see short time optimism in this bearish market. 30-50 points can be scalped within the trend channels. A short upmove can be seen above 15450 to 15650. Heavy selling may come below 15200 levels.
Time frame (mins): 1/2/5
Minimum TP: 10 Points
Once the profit is booked you can stop trading for the day. Remember WE ARE IN A BEAR MARKET and careless trade can wipe our capital. Trade with only 25% of your capital.
P.S: Kindly let me know if you guys want me to publish daily analysis like this one.
My profile:
NISM Certified Trader with market experience of 10+ years.

IEX - On supportIEX is now on one of its recent supports.. Can be watched for quick scalping opportunity.


Nifty : Get Ready for Extended Scalpings !I think we need 3-day weekends, Damn ! it feels so good n fresh & energetic after 3 Days :)
In Nifty we are looking for extended scalping's only - A Gap up open with retest of 9630's zone and move down till 9570's. See this is route map of prediction how Nifty can move for the day & if the expected thing happens based on trade setup we need to take trade, we don't take trade based on our predictions. Trade setup matters most when its aligning with predictions, its well n good for us.
Just a word about 9530's support, Nifty may give a move there just showing it as if its creating breakout to downside but only if 9520-30's broken, I will look for another 50-70 points to downside till 9450's. Regarding most views biased on Short side, well, I respect other trade ideas - It's just that I follow My Plan & it says extended scalping, no trend as of now, but it's around the corner to emerge. It's not about whether we got it right or wrong, its about we followed our rules & plan.
Happy Trading !

BTCUSDT Daily & 1H Analysis: Potential Surge to $100K & Scalping🌹🌹Daily Chart: We’re observing the completion of wave ‘c’ in an ABC pattern. This suggests a potential price surge towards $100,000, marking the end of wave ‘c’ and aligning with our drawn channel’s lower boundary.
1-Hour Chart: The market has been consolidating within a tight range, typical for low-volume days, forming a distinct box range. A decisive break above the resistance or below the support, with confirmation, will offer clear trading opportunities.
Bearish Outlook: Despite a sharp recent decline, the probability of further downside remains higher. This supports a strong entry for short positions.
Bullish Scenario: If the price breaks above the range resistance and confirms with good volume, a less aggressive long position could be considered. This might signal the start of a corrective wave, potentially facing resistance around the
113
𝐾
−
113K−
114K area. This zone features a significant trading cluster (order block) that, if it accumulates liquidity, could lead to a powerful move. This aligns with the 61% daily Fibonacci retracement and the 71% 1-hour Fibonacci level.
Key Takeaway for Traders: Amidst selling pressure and significant liquidations, focus on trend-aligned opportunities. Long positions should be treated purely as scalps.
Stay prosperous!👍🌹

Gold Plan (28/08) – Ahead of 3,400: Breakout or Correction to ??XAU/USD – Gold hits Storm Breaker 3400: Accumulation before breaking ATH?
1. Market Wave 🌍
Throughout last week, Gold continuously formed BOS (Break of Structure) , confirming that buyers remain in control.
Currently, price is consolidating around 3,394 – 3,400, right at the Storm Breaker 🌊 , the crucial barrier before heading towards the old ATH at 3,424.
The key question: Will Gold accumulate here and smash through ATH, or will it need a pullback to safe harbors before a strong rally in September?
2. Technical Analysis ⚙️
Storm Breaker 🌊 (Strong Resistance): 3400 – 3424 (old ATH). The gateway Gold must conquer to open a new bullish leg.
Golden Harbor 🏝️ (Key Support): 3375 – 3355 – 3330. Confluence with FVG + Fibonacci 0.5/0.618 , likely to attract liquidity if price corrects.
Short-term scenario: Price may pull back to Golden Harbor before breaking higher.
3. Captain Vincent’s Map – Trade Scenarios 🪙
🔺 Quick Boarding 🚤 (BUY Scalp – Rebound Priority)
Entry: 3353 – 3355
SL: 3349
TP: 3356 → 3359 → 3361 → 33xx
🔻 Storm Breaker 🌊 (SELL Reaction – Old ATH)
Entry: 3422 – 3424 (if tested)
SL: 3430
TP: 3419 → 3415 → 3410 → 3405 → 33xx
4. Captain’s Note ⚓
"The Gold ship is now pressing against Storm Breaker 🌊 3400 – 3424 . If it breaks through, the vast ocean opens a new trend. But if the waves push back, patiently wait at Golden Harbor 🏝️ to anchor and catch the September tide."

Gold Plan 14/08 – Captain VincentGold Plan 14/08 – Captain Vincent ⚓
Background
Yesterday, Gold touched the Sell Scalp zone and cruised smoothly for 220 pips 🎯.
However, it failed to break the previous Buy Zone and is now maintaining a bullish structure on the H1 chart, with higher lows forming.
Today, the market may move slower as traders await the US PPI data , so each entry point must be taken with caution.
Zone 1 – Golden Harbor 🏝️ (Main Buy Zone – SMC Demand)
Entry: 3,334 – 3,332
SL: 3,327
TP: 3,338 → 3,342 → 3,346 → 33xx
Note: This is the main buy zone, aligned with the SMC Demand Zone. Enter only if there’s a clear reversal signal (Pin Bar / Engulfing) on M15/H1.
Zone 2 – Storm Breaker 🌊 (Sell Zone – SMC Supply)
Entry: 3,398 – 3,400
SL: 3,407
TP: 3,394 → 3,390 → 3,386 → 33xx
Note: Strong sell zone. Watch price reaction before entry. Prefer partial profit-taking along the way.
Today’s Scenarios
If price tests Golden Harbor → Wait for pin bar or engulfing, then Buy in line with the uptrend.
If price approaches Storm Breaker → Look for short-term sell setups on reversal signals.
If price stays in the mid-range → Stay on the shore, save energy for the golden moment.
Captain’s Note:
"Today, the golden sea still rides the bullish tide, but the PPI winds may shift without warning. Keep the helm steady, and anchor only at safe harbors." 🏴☠️📈

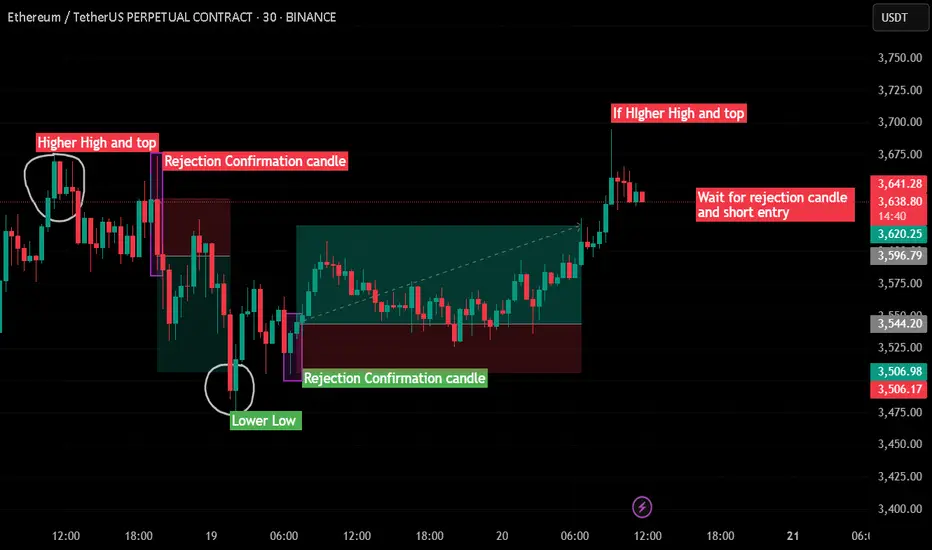
Trend Reversal Rejection Strategy | Higher High + Candle Confirm🔍 Idea Summary:
This strategy focuses on identifying trend reversal zones using classic Higher High (HH) and Lower Low (LL) structures followed by rejection confirmation candles.
🔻 Short Setup:
Price forms a Higher High.
Wait for a rejection candle (long wick, body closes inside previous range).
Confirm structure break and take short entry on confirmation.
✅ Example: On the left side of the chart, price printed a HH, followed by a strong rejection candle. That led to a clean move downward.
🔺 Long Setup:
Price forms a Lower Low.
Watch for a rejection candle near key support.
Enter long trade after confirmation.
✅ Example: Mid-chart shows price breaking to LL, then instantly rejecting with a strong bullish candle. Followed by a sustained move up.
🔴 Current Price Action:
Price is testing a potential new Higher High.
📌 Strategy suggests: Wait for a bearish rejection candle before shorting!
📈 Strategy Benefits:
Avoids impulsive entries
Combines structure with candle logic
Great for reversal traders and range scalpers
🔥 Like & follow for more real-time trading ideas!
💬 Drop your thoughts or questions below – let’s grow together, traders! 💪
#ETHUSDT #PriceAction #RejectionCandle #TrendReversal #SupportResistance #Scalping #TradingStrategy #Crypto #ChartPatterns #TechnicalAnalysis
Divislab available at good support price, 3-5% quick gainsIn Monday's probable gap down, Divis lab should be available at good weekly support price of 3370-3463 price range. If anyone able to enter in this price range then targets 1) 3676 2) 3797. Weekly hammer candle also seen, keep eyes open for quick scalping of 3-5% gains.

Update on XRP scalp. TP hit.The scalp short played out. The market needed a cool off before further uptrend. I think with the upcoming CPI and FOMC (next week) we might see some accumulation in 90ks (Bitcoin).

Reversed and scalped 200 pointsBTCUSD reversed from the zone mentioned in my earlier post and scalped 200 points.
1 lot profit 200$

Dr Reddy buy scalps on the wayyapproaching a daily support , expecting a bottom to be made here , would scalp 3-4% here

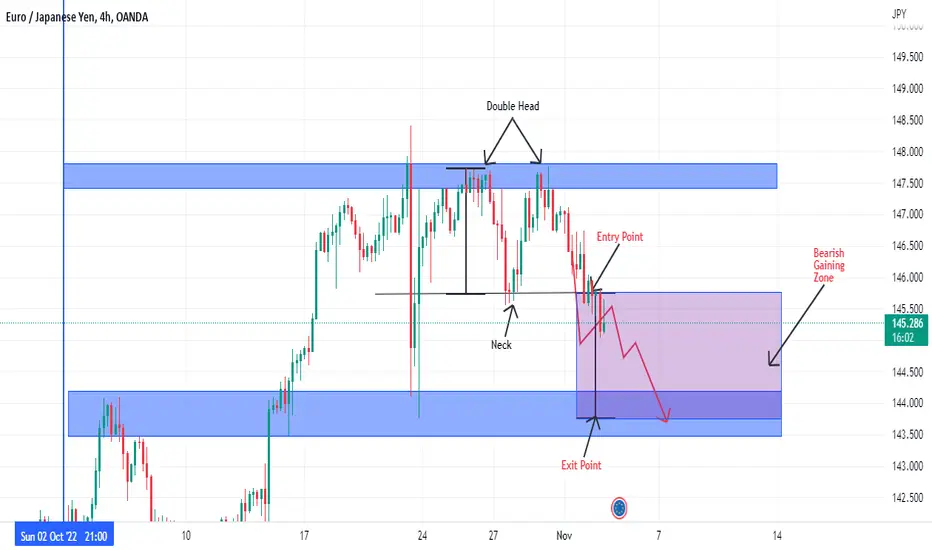
Double Top PatternA simple analysis of a Double Top Pattern, Price Action Trading Strategy. Simple scalping.
intraday scalp on GJAs we have covered in the previous post the bias for GJ over the next couple of days is bullish, During the NY session Price pulled back to test previous Asia resistance/ 30m structure, with a rejection and decent bullish volume we have an entry with a risk to reward of 1-3. Entry taken on 5m time frame largely visible double bottom at previous Asia resistance.

possible reversal area for scalpingpossible reversal area for quick scalping.
there is two untested demands marked with a yellow line.

STMX USDT RISKY SCALPINGSTMX looks bullish. risky scalping. targets shown. Do your own research first

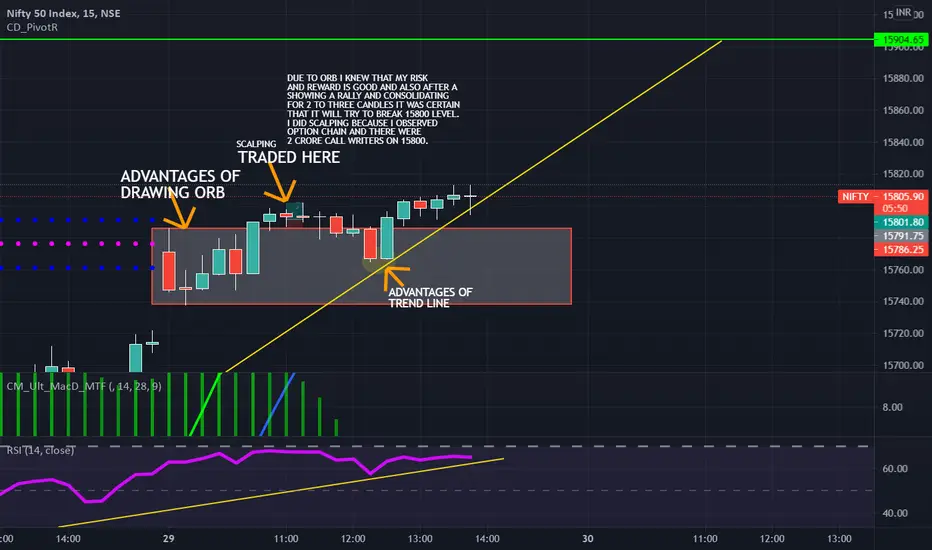
ORB and Trend Line and the TradeThe ORB (Opening Range Breakout)
IN THE PICTURE YOU CAN SEE FIRSTLY THAT, THE ORB THAT I DRAW WAS WORKING LIKE A CHARM AND THE MARKET FOLLOWED IT PROPERLY. SO ITS VERY ADVATAGEOUS TO ALWAYS DRAW AN ORB (OPENING RANGE BREAKOUT). TH TECHNIQUE TO DRAW ORB IS;
= IN THE FIRST 45 MINUTES OF THE OPENING OF THE MARKET MARK THE HIGH AND LOW AS SHOWN IN THE CHART.
= IF THE MARKET BREAKS THE HIGH OR LOW EITHER LINE OF ORB THAN THE MARKET WILL GIVE A BREAKOUT IN THAT DIRECTION AND THE LINES WILL WORK AS AN IMMEDIATE SUPPORT AND RESISTANCE.
The Trend Line
AFTER THAT, I HAVE DRAWN A TREND LINE AND AS YOU CAN SEE IT ALSO WORKED AS AN IMPORTANT SUPPORT LEVEL. AS YOU KNOW THE MARKET FOLLOWS ITS HISTORY. SO TO MAKE A TREND LINE SUPPORT OR RESISTANCE;
= TAKE A LINE AND JOIN THE PREVIOUS LOWS OR PREVIOUS HGHS (according to your needs) AND EXTEND IT AT THE SAME ANGLE. IT WILL WORK AS A SUPPORT OR RESISTANCE.
The Trade
I HAVE MARKED THE CANDLES THAT I TRADED ON. THE REASONS WHY I TRADED WAS;
1. FIRSTLY THE MARKET WAS FOLLOWING THE ORB AND ALSO I COMBINED LIVE OPTION CHAIN DATA WITH IT AND I OBSERVED THAT THERE WAS 2 CRORES OF OPEN INTEREST ON CALL SIDE. SO IT WAS IMPOSSIBLE TO TAKE A LIONG TRADE FOR INTRADAY PURPOSE. SO I DID SCALPING.
NIFTY TRADE SETUP FOR EXPIRY
NIFTY RANGE IS 14975-15250. 15000 IS MAJOR SUPPORT. AND 15250 IS RESISTANCE. KEEP THAT IN
MIND ,WHEN YOU SET YOUR TRADE.
FOR SCALPINGLEVEL MENTION ON CHART

NIFTY TRADE SETUP FOR MONDAY
Nifty range is 14050 - 13950. now 14000 is support
for market . we can short below 14000 with strict
stop loss for scalping. on buying side if price
sustain above 14060 we can intiate long position.

NIFTY TRADE SETUP FOR FRIDAYNifty trade setup
nifty is still bullish. we have been seeing gap up opening for last 6-7 days .
intraday trading is tough but the best way is do scalping.
tomorrow I will go long above 11910 and short below 11790.
trend line t2 is short term support. above T2 market is bullish. and T1 is long term support.
will sell only if the market breaks T1.
there is 120 point inbetween our buy and sell .best is mark 30 min swing high and low . on the uper side sell ce and on the lower side sell pe.
if market break out or brekdown .exit from opposite position and buy ce or pe on the same direction.
on priority never look for profit .look to protect your money you will always earn. may be not very big but you will not lose money for sure.
i always said first identify the market. and do trade whenever market reach at support or resistance point.
today I have sold 119850 pe and 11900 ce .
make your own strategy .let the market work very hard to take our money.
don't run for big profit instead make small profit multiple times.
thanks
happy trading

Jusr Check our BTC scapling Algo updateHello Friends,
Created a tradingview algo for BTC scalping. Please check if this suits for your kind of trading?
