ETH/USDT: Buy on 1HR chartDouble bottom on pull back, entry after a bullish candle.
Entry - 2138
Stop Loss - 2080
Take Profit - 2195
Will keep you posted on the progress of the trade.
Search in ideas for "USDT"

BTC/USDT: Weak Trend Strength The uptrend strength has weakened, may just be the start of a short bearish trend. Let's see...

BTC-USDT: short lived bullHello,
Looks like bull runs could not continue beyond a few weeks.
200 day Moving Average is a major resistance for BTC. Thus the touched it and came down twice is past month.
Next support is near 7.6k at the bottom of the Ichimoku cloud.
Let's see how it pays in next couple of weeks.

MANA/USDT.P 1:3 RISK REWARD
HIGHER HIGH
In an uptrend, higher highs are a sign of increasing bullish momentum. When the price surpasses previous highs, it's often seen as confirmation that the uptrend is intact. This pattern suggests that buyers are consistently stepping in at higher price levels.
To spot higher highs:
Chart Analysis: Look at the peak points on the chart. If each peak is higher than the previous one, you're seeing higher highs.
Volume: Increasing volume with higher highs can further validate the strength of the uptrend.

EURJPY Declines, Watch 157.1 and 155.3The EURJPY chart shows a clear downtrend, with the price trading below the EMA 34 and EMA 89, confirming strong selling pressure.
The key resistance is identified around 157.100 USDT. If the price fails to break this level, it is likely to retest the support zone at 155.321 USDT.
The downtrend is expected to continue unless there is a reversal. The market is also significantly influenced by the interest rate decisions from the ECB and BOJ, which will be crucial in determining EURJPY's direction in the near future.

AUDUSD Declines, Watch 0.6640 and 0.6690The current AUDUSD chart shows a short-term downtrend as the price trades below the EMA 34 and EMA 89, indicating that selling pressure remains dominant.
The key support level is at 0.6640 USDT, while the nearest resistance is at 0.6690 USDT.
The price is expected to correct towards the support before potentially rebounding, but failure to break resistance may result in a retest of the support level.
The market is also heavily influenced by factors such as the Fed's interest rate decisions and economic data from Australia, which could cause significant short-term volatility.

$MYRO USDT.P BINANCE$MYRO create a POI on SMC, wait price pull back to POI and confirmed with a CHoCH, we can have a LONG position.
ENTRY: 0.274
SL: 0.25
TP1: 0.34
TP2: 0.44
TP3: New ATH
DYOR

A good long for xrp.XRP/USDT.P currently breaking down of the bear flag, going to retest the lower trendline and then may fall till the levels marked in the chart which also happens to be a very strong demand zone(0.4950). This will do two things at the same time grab liquidity of early longs and of late shorts through retesting the trendline. XRP can pump hard from the respective demand zone, I will be looking to long from the level.R:R is phenomenal, This bear flag do serves as a small targets for retailers but most of them are gonna get trapped in this. DYOR

SOLANA PREDICTIONMarket will go down little bit
and SL hit who open position for long then will hit upward movement approx 22.240 - 22.231 and then go down approx 18.580 usdt.
NOTE- all is in USDT pair.

GMTUSDT LONG IDEAGmt In Bear Trend Approaching Support Get Ready To Long From Support With Sl ,Swing Targets Are Resistance Marked Area ,Scalp Targets Mentioned In Chart Separately. BINANCE:GMTUSDTPERP
KITTY TRADERS

🇮 30 Trade Ideas Prove The Future Can Be Predicted | BTC RallyQuestion: Is it possible to predict the future?
Answer: The answer is a big and resounding YES! if you know how to read charts.
Let's get started!
Feel free to boost 🚀👍 at the end if you enjoy the content.
----
On the 21st of November 2022 bitcoin hit a new low.
Based on the length and strength of the bear-market, recent price action and simply experience with reading cryptocurrency charts, I became convinced that bitcoin was about to move up.
If not a full-blown recovery, a "relief rally in the least".
I made this clear by sharing a full trade signal even with leverage just two days later.
(1) 23-Nov-2022 🅱️ Bitcoin Goes Bullish (Easy 333%+ Potential 10X Lev.)
With this trade active and in place, the bearish bias was still too strong and we considered a "flash crash" scenario that did not materialize... Bitcoin went on and started a consolidation phase.
Early December, I was ready to call for $21,650 followed by $26,420...
The deal was simple, it is going up but by how much?
(2) 1-Dec-2022 🅱️ Bitcoin $21,650 Followed by $26,420 vs Altcoins BTC Pairings
Then comes the first signal, the MA200 indicator on the weekly timeframe.
My thinking was simple, this is a long-term support that has failed, it needs to be tested as resistance before bitcoin can go any lower.
If it fails as resistance then we just keep going up, if it holds, then a new low can be set...
(3) 4-Dec-2022 🅱️ Bitcoin Weekly | MA Analysis Points To $24,000 and $27,000+
Just the next day the next signal is found... The SPX and BTC detach, when you hit play now the target/resistance level is hit with perfect accuracy...
(4) 5-Dec-2022 🅱️ Bitcoin and the SPX Detach 5-Nov. (Good News)
Another signal, this time a bull flag... I am convinced, up we go, up we go but nothing yet takes place...
(5) 8-De-2022 🅱️ Bitcoin Daily Bull Flag | $21,000+ Possible Now Within Days!
Going back a little bit, one day earlier, I make the case the bitcoin bottom is already in... The whole argument was based on the capitulation phase we were expecting since early 2022 and the fact that after it happened we only needed to confirm if the next move would be a higher low or lower low before the cycle ends.
I also compared 2018 to 2022... below, the chart...
(6) 7-Dec-2022 🅱️ The Bitcoin Bottom Is In (No Click-Bait Tile, Read)
Then the FED and inflation, here I looked at 3 different potential scenarios and the only prediction was a recovery after 14-Dec. and ended with "Bitcoin, we start GREEN in 2023
(7) 10-Dec-2022 🅱️ Bitcoin 2023 | Fed Interest Rate Hikes & The Consumer Price Index
By mid-December I was ready again with making bold predictions and I even shared a strategy with step by step instructions on how to get the most of the bullish wave that is happening now... A month ago.
No genius level on this strategy, it simply said "Buy everything always at all times until early January and then enjoy the ride on the way up".
It also mention to keep an eye on the chart to consider selling in early February if the major correction takes place.
(8) 15-Dec-2022 🅱️ LONG bitcoin Feb. until 2023 - PART II | Strategy
The same day I found that the major downtrend has been broken based on the linear scale BTCUSD weekly.
I wrote "The easy target is set at the $20,000 - $21,000 range in the coming weeks."
Also added: "There can be more, bitcoin can hit $24,000 and even $27,000..."
(9) 🅱️ Bitcoin Breaks Free - Major Nov. 2021 Downtrend | Linear Scale
Of course, at the same time I am writing about Ethereum, Ethereum Classic, Bitcoin Cash, Cardano, Dogecoin, Binance Coin and the rest of the pack.
The next day I read some facts in a book and decided to share them with you, "Buy the dip"... Only around 400,000BTC will be minned in 2023 and it goes down every year.
Less than 250,000 in 2024, 165,000 in 2025, etc.
(10) 16-Dec-2022 🅱️ BUY THE DIP! Less Than 400K bitcoins will be Mined in 2023
Another "bottom signal" the next day... This is getting old, I even shared a chart from 17-Nov-2022 mentioning that Bitcoin would recovery within 1-5 months...
(11) 17-Dec-2022 🅱️ Bitcoin Performance In January Since 2012 + Bottom Signal
Doubt can creep in at times.
When you are writing on a daily basis and interacting with hundreds of bears, you can become infested... But I am an astrology fan and this would always help me clear the doubts.
Yes, anything is possible as they say but Jupiter is moving forward and other planets that have been retrograde for months are also moving ahead, bitcoin is bound to follow.
The next day I asked... Do you believe in miracles?
(12) 18-Dec-2022 🅱️ 🪐 Bitcoins Connection To The Stars, Do You Believe In Miracles?
The next signal is the classic bullish divergence... In this case, the target was hit with perfect accuracy, only now this can be appreciated when you hit "PLAY" on the chart...
(13) 20-Dec-2022 🅱️ ₿ Bitcoin Daily Bullish Divergence (85% Jump Mapped!)
At the same time I am reading the Tesla (TSLA) charts with perfect accuracy, drop after drop and later called the reversal that is now taking place.
Now comes "Bitcoin sideways" and it reads like this...
"We can see/have a sideways bitcoin until mid-January 2023 or 12-January.
"At this point we can see the bulls win the game... But why?
"Because Mars moves forward/goes direct! 😅🤣 "
I use the emoji so the trolls and bears won't kill me for using all available tools to help me predict the future. The charts + astrology. They don't believe in astrology so they think it is unreal... Yet bitcoin breaks perfectly and produces the biggest jump 12-13 January, exactly when Mars stations direct after almost 3 months of retrograde. And exactly as predicted.
(14) 21-Dec-2022 🅱️ (₿) Bitcoin Sideways | You Deserve To Succeed!
Late December I am convinced the "Wait Is Over" but I am accused of "sensationalism"... Wait what? What the heck is that? To me I am just sharing my honest view, what I see coming, my analysis, what the charts are saying, my predictions.
Relief rally or full recovery? We don't know yet.
(15) 29-Dec-2022 🅱️ (₿) Finally... The Wait Is Over | Bitcoin Goes Bullish!
2023 starts and we look at all the signals, higher lows, EMAS, candlestick patterns and the rest... Predict a $20,960 target "next".
(16) 1-Jan-2023 🅱️ (₿) Bitcoin 2023 | Multiple Higher Lows Since 2022 | $20,960 Target
The same day, another signal, this time we look at the long accumulation phase, a clear give away to me... Can you see it?
(17) 1-Jan-2023 🅱️ (₿) 4.5 Months Later Bitcoin...
We are getting closer now... My certainty continues to rise... I can feel the hate pouring over me.
The bears are fighting me left and right but I never give up.
Another scenario, the SEC labeling everything securities yet, still 100% bitcoin bullish. I also remind you of the strategy to buy everything, always, at all times...
(18) 4-Jan-2023 🅱️ (₿) Why Bitcoin Will Rise Suddenly Beyond $150,000 Explained
(19) 4-Jan-2023 🅱️ (₿) Remember The Act Now! Strategy
At the same time I am sharing short-term charts on the XBT ticker; Also bullish.
I was laughing inside as I received the vision for this article... I was making excuses for bitcoin not yet rising... Imagine that, I blamed the holidays.
(20) 5-Jan-2023 🅱️ (₿) Excuse The Holidays... The World Wants Bitcoin
The next day I ate some cookies and my heart started raising... I was feeling so good yet decided to eat the damn cookies... As I lost my balance, a vision started to come in... Ahhh, I recognize this, it is a ROTE, a ball of thought packed in energy form.
I am inspired to write the following article word by word... Satire, maybe, but 100% TRUE!
Note: The fact I mention the formalities to be "nonsense", is because we are supposed to be greedy billionaires that care about nothing but money... Don't take it to mean we are heartless yet we still don't care about nobody.
Life is an endless game. You die and you are born again, over and over... You cannot stop it even if you wanted to, you can take it easy.
.. Relax, it is all meant to be fun.
(21) 6-Jan-2023 🅱️ Billionaire Planet Friend Just Called, Ready To Buy Bitcoin!
The next day I go on a rant... "Really, are you guys going to believe the mainstream media?"
And also share my updated view of the market, a potential $48,000 wave in the making...
(22) 7-Jan-2023 🅱️ (₿) Money Tightening vs Money Easing | Nothing Else Possible
(22) 7-Jan-2023 🅱️ ₿ If 2018/19 Repeats, The Bitcoin Bottom Is In, $48K Next!
A new signal comes in... This time based on the ATH vs the Bottom, is it possible?
Again we make hidden references to Mars as being the main catalyst of the upcoming bullish wave which is now a confirmed fact... Uranus hasn't gone forward yet and that's the big one.
(23) 8-Jan-2023 🅱️ (₿) Can This Inverse Reaction Signal The Bottom Is In?
On the 10th of January, now literally 2 days before the rally start I shared 3 trade ideas all bullish detailing exactly what is coming... Daily, Weekly and Monthly... The bears continue in complete disbelief.
(24) 10-Jan-2023 🅱️ (₿) Bitcoin Daily, To Hit $19,000 Followed by $25,000 Feb. 2023
(25) 10-Jan-2023 🅱️ (₿) Bitcoin Weekly, Best Case Scenario... First Time Since April 2020 ($35K to $55K)
(26) 10-Jan-2023 🅱️ (₿) Bitcoin Monthly, Points To $23.1K to $24.1K Minimum...
It is so obvious, I stop writing... Just mention "BULLS Confirmed" and leave it at that... I know my people took action. If you didn't take action then you are not in the flow.
(27) 11-Jan-2023 🅱️ (₿) Bitcoin | BULLS Confirmed
The next day many new signals show up... The bears are in complete disbelief, I even share the USDT.D chart with the inverse BTC relation called "Final Confirmation"... It didn't help.
📈 Tether Dominance, The Final Confirmation
(28) 12-Jan-2023 🅱️ (₿) Another 6 Major Development On The Weekly Bitcoin Chart
13-January 2022... The final signal... MA200 daily and Bitcoin-Bonds!
(29) 🅱️ Bitcoin Moving Above MA200... $48,000 Now Possible!
(30) 🅱️ Game Changer | Bitcoin Bonds | El 🇸🇻 Salvador
Thanks a lot for your continued support.
Namaste.

Bitcoin Straight Up But Why? $47K Followed by $55KAt this spot it generally hard to figure if a retrace is coming after hitting resistance for BTCUSD or if it will continue straight up...
I say straight up.
Feel free to hit LIKE now and let's get started.
Other than the obvious and strong bullish bias that has developed on the Bitcoin chart, we also have a new tool.
( Thanks to @CryptoSoap who mentioned this chart in the comments section... )
Tether Dominance (USDT.D) has an inverse relation to Bitcoin (BTCUSD).
The USDT.D chart is looking pretty crapy and the signals are clear, it is aiming lower...
As this index aims lower, Bitcoins aims higher.
(My classic bullish signals are also showing on the BTCUSD chart.)
We are going for $47,200 followed by $55,100.
Leave us a comment with your opinion on this one.
Thanks for all the support lately, it is truly appreciated.
Namaste.
P.S. The "Stock Market" (SPX, NDX, DJI) is detaching from Bitcoin (BTC, Crypto) as anticipated...

Best time to invest in Bitcoin is coming...If anyone want to invest in BTC, then best time to invest is coming. You can buy at the price 29,000 USDT. It is yet to test its demand zone which is near 29,000 USDT. You can get a whooping return of 137% if it gets to its all time high.
This is weekly chart of BTC. You have to hold BTC for 4-6 months to get results.
BINANCE:BTCUSDT

BTCUSDT 1h tf IdeaHere we can see that BTC is near the resistance zone. We can also see that 50 EMA is crossing 200 EMA although quite slowly which is one of the reasons I'm bearish on this setup (50 EMA crossing 200 EMA slowly implies higher chances of trend reversal). One notable thing we can see here is that the white upward trendline is now acting as a strong support as 200 EMA is moving along with it. We should open a long position if the price goes above 39500 USDT while a short position should be created if the price goes below 37300 USDT.

IOTX idea updateIOTX has been forming a triangle again. It didn't respect the previous triangle. Now it has been forming a new triangle and a channel. If it breaks out from above, it might touch the 0.08 USDT price level. If it breaks out from below, it might go till 0.04 USDT. Sorry for a messy chart!

BTC Possible Bull TrapMajor resistance at 34700 - 35000 USDT and also previous highs... Last trend break it fell 1700 USDT. RSI almost reached overbought in 4H.
RSI broke its daily downtrend since January. It is a good sign for Bulls.


Stx enters in a great buy trend right now. Alert: keep all your selling orders above 0.3500 USDT. Within a day you'd see it crossing 0.4000 usdt as per technical analysis done by former citi trader.

Matic USDTP support resistance Sharing the support and resistance line for Matic, Marco's view looks bullish.

btc usd bitcoin crossed the rising wedge some days behind but the binance bad news again the chart created the bearish trend but now btc stable and holded stron at level 9k and rised more then 400$ from the support level with strong buy waiting to cross the again bearish wedge to rising wedge.

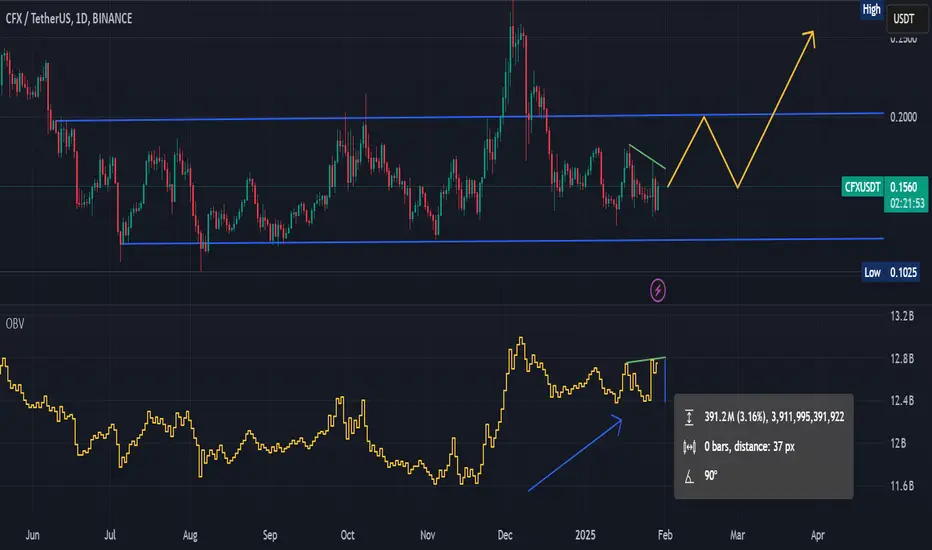
VOLUME ANOMALY ON CFX FOR LONG!BINANCE:CFXUSDT
1.The CFX coin has been in a macro range since the 5th of July until now.
2.The support zone has been tested 5+ times and each of them received a buyer's reaction.
3. According to the OBV chart, you can see that after December 20, the price returned to the support zone, but this was not accompanied by active sales - a bullish divergence was formed
4. On 29.01, an abnormal volume of buying was formed near the support zone
EXPECTATIONS:
1.From a local perspective, this zone is good for spot buying with targets around 0.25 USDT.
2. From a global perspective, buying in this range is relevant for the next 2-3 months with potential 3-5x
THE DIFFICULT SITUATION ON ETHBINANCE:ETHUSDT
1. Since 20 December, the price has been in the range of 3100 - 3500 USDT. Fake breakouts from the top and bottom + liquidations bring the price back into the range.
2. In terms of volume, we can see a zone of high buying marked with a purple square.
3. An interesting divergence - the volume of sales is growing, but the price is not falling equivalently to this volume. A really difficult situation to interpret, because the volume often outstrips the price movement.
EXPECTATIONS:
1 scenario (priority) - continuation of rotations from the range boundaries
2 scenario (in case of negative news) - breakout of the lower boundary of the range, consolidation under it

Bitcoin will go downStrategy 1: Short from Supply H4 Zone (With 2 Entries)
Short Setup:
Entry 1: 96,500 USDT (First Supply H4 zone)
Entry 2: 99,200 USDT (Second Supply zone near the psychological level of 100k)
Stop Loss (SL): 100,500 USDT (Placed above the strong Supply zone and psychological level)
Take Profit (TP):
TP1: 93,000 USDT (Nearest support level)
TP2: 91,200 USDT (Close to the Demand Zone)
TP3: 89,800 USDT (Main Demand Zone)
Risk Management:
Split the position into two parts, each with 50% risk.
Entry 1 at 96,500 USDT
Entry 2 at 99,200 USDT
Risk-to-Reward Ratio (R:R): ~1:3 or better, depending on your take profit targets.
🟢 Strategy 2: Long from Demand Zone (Adjusted Stop Loss)
Long Setup:
Entry: 89,800 - 91,000 USDT (Strong Demand Zone)
Stop Loss (SL): 90,200 USDT
Take Profit (TP):
TP1: 93,000 USDT
TP2: 96,500 USDT (Supply H4 Zone)
TP3: 98,000 USDT
Please leave a comment to let me know you've been following. Good luck.
