Gremz Inc Weekly analysis V1Gremz,Inc. engages in energy cost solution, smart house, and electricity retailing businesses in Japan
There can be different version of analysis while drawing the higher degree EW - Weekly.
We will also look at V2 of this version if posted next.
It had dome major correction during sep-21 to jun 22 -> Total 10 months - Nearly 1850 points -> @ rate of 185 per month ( average ).
From jun 22, it has been trying to move up. During dec 2023 onwards, it is moving rather slowly, so we have doubt about it when drawing EW. So we will have a V2 with different view/Drawing.
Search in ideas for "Version"

Crazy idea, Do you want to try?Experimental model for RIF.
Note: This is not a medicine, but just an alternative to medicine .
Try following....
1. Trend line view
2. RSI Weekly
3. RSI Monthly
4. Volume
5. Fibo view
6. Ichimoku view
7. New coin
8. Bitcoin Ecosystems
9. Cap 200M
10. RSK Labs’ History
RSK Labs is the creator and current owner of the RSK Smart Protocol. RSK Labs was founded in
2015 and is backed by top-tier investors that are deeply rooted in Bitcoin and the crypto space. Since
its inception, RSK Labs has raised over $4 million in funding. In December 2016, RSK Labs
announced the launch of the RSK side-chain protocol, the first fully functional smart contract
platform secured by the Bitcoin network (the “RSK Smart Protocol”). The Test-net version was
opened to the public in May 2017 and the beta Main-net version was released in January 2018. You
can read about the Main-net launch here: media.rsk.co and a
detailed whitepaper of the RSK Smart Protocol can be found here.
Ginger is the public release of the RSK Smart Protocol’s open source Test-net network powered by
the Bitcoin Network, the most secure distributed network in the world. Based on latest tests, users
shall be able to run their smart contracts on a protocol that could potentially scale up to 2.000 TPS
on-chain and 20.000 TPS off-chain, thereby providing the scalability needed for global financial

Auropharma: A Must-Own Stock for 2024?Detailed technical analysis of Auropharma (NSE: AUROPHARMA) based on hourly timeframe.
Technical Indicators
RSI: The Relative Strength Index (RSI) is currently at 62.5, indicating that the stock is overbought. However, the RSI is still below the 70 level, which is considered to be overbought territory. This suggests that the stock may continue to rise in the short term.
MACD: The Moving Average Convergence Divergence (MACD) indicator is currently bullish, with the MACD line above the signal line and the histogram bars above zero. This suggests that the stock is likely to continue to move higher.
OBV: The On Balance Volume (OBV) indicator is also bullish, with the OBV line trending upwards. This suggests that there is strong buying pressure behind the stock.
Support And Resistance Levels.
Support: The nearest support level is at ₹985. This is the level where the stock bounced off in October 2023.
Resistance: The nearest resistance level is at ₹1015. This is the level where the stock has been rejected for the past few week.
TRADE ENTRIES
Long Entry: Traders could enter a long trade at the current level of ₹1002 to 1004 with a stop-loss order at ₹980 and a profit target of ₹1050,₹1100.
Overall Outlook.
Auropharma is currently in a bullish trend. The stock has broken out of a consolidation pattern and is now trading above its moving averages. The technical indicators are also bullish. However, the stock is overbought, so there is a risk of a pullback in the short term. Traders should be aware of this risk and use stop-loss orders to protect their capital.
News
• Auropharma receives FDA approval for generic version of blockbuster heartburn drug Prilosec. The approval is a major boost for Auropharma, as Prilosec is one of the top-selling drugs in the world. The generic version of the drug is expected to hit the market in 2024.
• Auropharma enters into a joint venture with a Chinese company to develop and manufacture new drugs for the Chinese market. The joint venture is a strategic move by Auropharma to expand its presence in the Chinese market, which is the second-largest pharmaceutical market in the world
• Auropharma announces a new research and development facility in India. The new facility will focus on developing new drugs for the Indian market. This investment is a sign of Auropharma's commitment to the Indian market, which is one of the fastest-growing pharmaceutical markets in the world.
Fundamental Analysis
• Auropharma is a leading generic drugs company with a strong track record of profitability and growth. The company has a diversified product portfolio and a strong presence in both emerging and developed markets.
• Auropharma has a strong pipeline of new drugs in development. The company is investing heavily in research and development, which is expected to drive future growth.
• Auropharma has a strong balance sheet and is well-positioned for future growth. The company has a low debt-to-equity ratio and a strong cash flow position.
FINAL THOUGHTS 🪙😇
Auropharma is a well-positioned company with a strong track record of profitability and growth. The company is well-positioned to benefit from the growing global demand for generic drugs. The company's recent news announcements are also positive, and they suggest that Auropharma is well-positioned for future growth.

Added Super Trend on MarketMonster-S/R IndicatorA modified version of the MarketMonster-S/R with an RSI overbought/oversold filter
Comment/uncomment "Study/Strategy" to easily switch to strategy() mode
As long as it is used in the study() version, the indicator is compatible with the Risk Management Wrapper
Separate Alerts for Buy & Sell signals
Single Alert for both Buy & Sell signals - it can also be used by another indicator as a source
--------------------
Release Notes: This is a simple super trend based trend indicator.
By default the supertrend is 10 period with 3 ATR multiplier.
A moving average is used to benefit from the pullback entries.
Bullish Pullback : Price above Supertrend & below MA
Bullish: Price above Supertrend and above MA
Bearish pullback : Price below Supertrend & above MA
Bearish : Price below Supertrend & below MA

NIFTY ANALYSIS: RevisitedHey guys I think I published the idea on US version by mistake. Republishing in Indian version through this link.
Regards

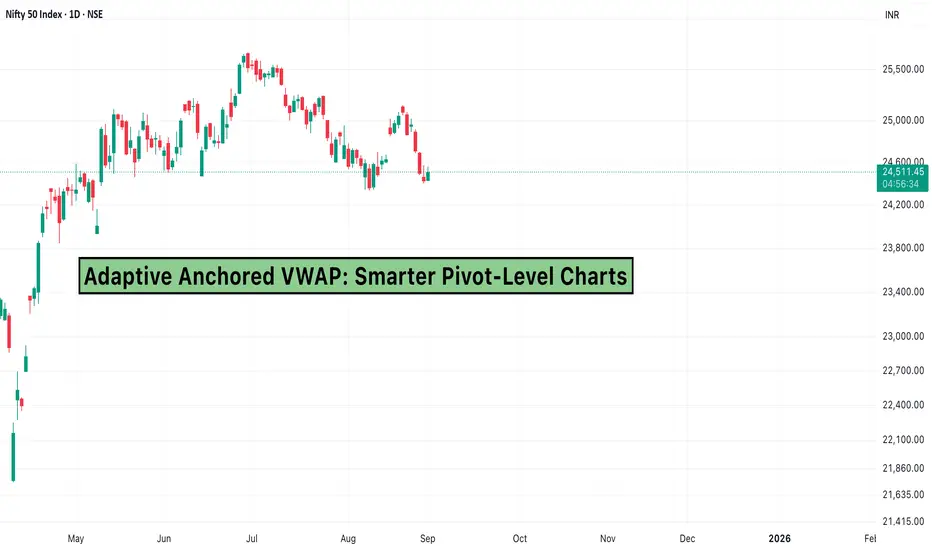
Adaptive Anchored VWAP: Smarter Pivot-Level ChartsEvery trader wants to know one thing where are the real buyers and sellers stepping in? While support and resistance levels help, they can sometimes feel subjective.
That’s why volume-based tools like Anchored VWAP (Volume Weighted Average Price) have become popular. But markets are dynamic, and so should be our tools.
Enter Adaptive Anchored VWAP (AAVWAP) a smarter way to track pivot levels that truly matter.
What is Adaptive Anchored VWAP?
Anchored VWAP calculates the average price of an asset, weighted by volume, starting from a specific anchor point (like a swing high, low, or earnings date). It tells you where the “average participant” entered since that anchor.
The adaptive version goes one step further—it automatically resets the anchor point at meaningful pivots (like a strong reversal or breakout). Instead of manually choosing anchor dates, the chart adapts as the market evolves.
This gives traders a clearer, unbiased picture of where fair value is, based on real trading activity.
How Traders Use Adaptive Anchored VWAP
Here are a few powerful ways to apply AAVWAP in your charts:
Dynamic Support & Resistance
AAVWAP levels often act as hidden support/resistance zones where institutions are active.
Trend Confirmation
If price stays above AAVWAP, buyers are in control; below it, sellers dominate.
Entry & Exit Signals
Pullbacks to AAVWAP in an uptrend can offer clean long entries, while rejections below AAVWAP may signal short setups.
Multiple Anchors
Traders often plot multiple AAVWAPs from different pivots (earnings, major highs/lows) to build a “VWAP cluster” a powerful decision zone.
Managing Risk with AAVWAP
Because AAVWAP reflects where most participants are positioned, breaks of these levels can lead to sharp moves. That’s why risk management is key.
Traders often use stop-losses just beyond AAVWAP or scale out when price approaches these zones. Pairing this with Dhan’s Cover & Bracket Orders helps protect capital in case of sudden volatility.
Conclusion :
Adaptive Anchored VWAP takes one of the most trusted trading tools and makes it flexible. By automatically resetting at key turning points, it provides traders with realistic pivot levels that matter in the market.
Whether you’re day trading or swing trading, AAVWAP can help you track where the true battle between buyers and sellers lies.
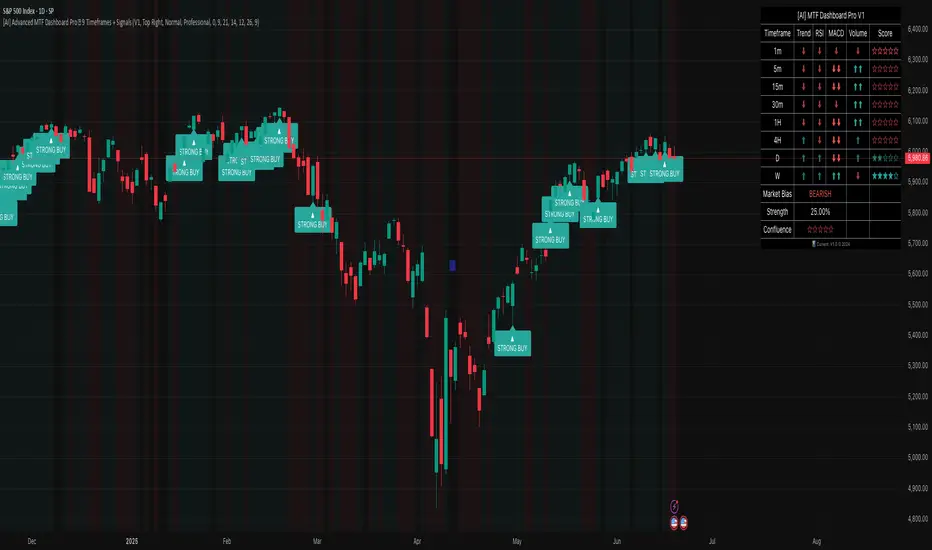
[AI] Advanced MTF Dashboard Pro █ 9 Timeframes + Signals# 🚀 Advanced MTF Dashboard Pro █ 9 Timeframes + Signals
## The Ultimate Multi-Timeframe Analysis Dashboard - See Everything at a Glance!
Transform your trading with the most comprehensive MTF dashboard on TradingView. This professional-grade tool analyzes 9 timeframes simultaneously, giving you instant market insights that would normally require multiple charts and hours of analysis.
---
## ⚡ KEY FEATURES
### 📊 **9-Timeframe Analysis**
✅ **Complete Coverage** - 1m, 5m, 15m, 30m, 1H, 4H, Daily, Weekly, Monthly
✅ **Toggle Control** - Show only the timeframes you need
✅ **Real-Time Updates** - All data refreshes automatically
✅ **Clean Organization** - Professional table layout
✅ **Smart Positioning** - Place dashboard anywhere on chart
### 🎯 **Multi-Indicator Analysis Per Timeframe**
✅ **Trend Direction** - EMA cross-based trend detection
✅ **RSI Momentum** - Overbought/oversold conditions
✅ **MACD Signals** - Histogram direction and strength
✅ **Volume Analysis** - Above/below average volume
✅ **Confluence Score** - Combined signal strength rating
### 💎 **Advanced Signal System**
✅ **Visual Status Indicators**
- ⬆⬆ Strong Bullish
- ⬆ Bullish
- ➡ Neutral
- ⬇ Bearish
- ⬇⬇ Strong Bearish
✅ **Confluence Ratings**
- ★★★★★ Excellent Setup
- ★★★★☆ Strong Setup
- ★★★☆☆ Good Setup
- ★★☆☆☆ Fair Setup
- ★☆☆☆☆ Weak Setup
### 📈 **Market Analysis Dashboard**
✅ **Overall Market Bias** - Instant bullish/bearish/neutral assessment
✅ **Bias Strength %** - Quantified market direction strength
✅ **Confluence Score** - Overall setup quality rating
✅ **Trend Alignment** - See when multiple timeframes agree
✅ **Smart Filtering** - Focus on high-probability setups
### 🔔 **Professional Alert System**
✅ **Strong Signal Alerts** - When confluence is extremely high
✅ **Bias Change Alerts** - Market direction shifts
✅ **Custom Messages** - Detailed alert descriptions
✅ **Multi-Timeframe Alerts** - Know which timeframes triggered
✅ **Smart Frequency** - No alert spam
### 🎨 **Customization Options**
✅ **4 Color Schemes** - Professional, Classic, Vibrant, Dark
✅ **6 Table Positions** - Top/Bottom/Middle + Left/Right
✅ **4 Text Sizes** - Tiny to Large
✅ **Toggle Features** - Show/hide any component
✅ **Visual Preferences** - Background colors, signals, etc.
---
## 🎯 PERFECT FOR
• **Multi-Timeframe Traders** - See all timeframes without switching
• **Confluence Traders** - Find high-probability aligned setups
• **Day Traders** - Quick market assessment for entries
• **Swing Traders** - Identify major trend alignments
• **Scalpers** - Spot micro-trends within larger trends
---
## 📱 WORKS ON ALL MARKETS
✅ **Forex** - All currency pairs
✅ **Crypto** - Bitcoin, Ethereum, all altcoins
✅ **Stocks** - Individual stocks and ETFs
✅ **Indices** - S&P 500, NASDAQ, etc.
✅ **Commodities** - Gold, Oil, Silver
✅ **Futures** - All futures contracts
---
## ⚙️ QUICK START GUIDE
### 1️⃣ **Add to Chart**
Click "Add to Favorites" and apply to any chart
### 2️⃣ **Configure Timeframes**
- Toggle ON the timeframes you trade
- Toggle OFF timeframes you don't need
### 3️⃣ **Customize Appearance**
- Choose your color scheme
- Select table position
- Adjust text size for your screen
### 4️⃣ **Interpret Signals**
- **Green rows** = Bullish timeframes
- **Red rows** = Bearish timeframes
- **More arrows** = Stronger signals
- **More stars** = Better confluence
### 5️⃣ **Set Alerts**
Right-click indicator → "Add Alert" → Choose conditions
---
## 📚 TRADING STRATEGIES
### **Strategy 1: Confluence Trading**
1. Wait for 70%+ timeframes to align (same direction)
2. Enter when confluence score shows ★★★★ or better
3. Use lower timeframe for precise entry
4. Higher timeframes for trend direction
### **Strategy 2: Timeframe Divergence**
1. Look for lower TFs turning while higher TFs trend
2. Potential reversal when multiple TFs flip
3. Confirm with volume increase
4. Best at major support/resistance
### **Strategy 3: Momentum Alignment**
1. All momentum indicators (RSI/MACD) align
2. Volume confirms direction
3. Enter on pullback to moving average
4. Exit when momentum diverges
---
## 🛠️ INDICATOR SETTINGS EXPLAINED
### **Timeframe Selection**
Each timeframe can be toggled on/off. Only active timeframes:
- Appear in the dashboard
- Count toward confluence
- Trigger alerts
### **Indicator Parameters**
- **Fast/Slow EMA**: Trend detection sensitivity (9/21 default)
- **RSI Length**: Momentum period (14 default)
- **MACD Settings**: Signal generation (12/26/9 default)
### **Visual Settings**
- **Table Position**: Where dashboard appears
- **Text Size**: Readability adjustment
- **Color Scheme**: Match your chart theme
### **Signal Settings**
- **Show Trend Strength**: Display trend indicators
- **Show Momentum**: RSI/MACD columns
- **Show Volume**: Volume analysis column
- **Show Confluence**: Star rating column
---
## 🌟 WHY CHOOSE ADVANCED MTF DASHBOARD PRO?
### **🤖 AI-Enhanced Analysis**
Our algorithms intelligently weight signals based on timeframe importance and market conditions, providing more accurate confluence scores than simple averaging.
### **⚡ Lightning Fast**
Optimized code ensures smooth performance even with all 9 timeframes active. No lag, no delays, just instant insights.
### **👁️ See Everything**
Stop switching between charts. One glance shows you everything you need to make informed trading decisions.
### **🎯 Precision Timing**
Identify the exact moment when multiple timeframes align for the highest probability trades.
### **📈 Proven Results**
Based on professional trading techniques used by institutional traders, now accessible to everyone.
---
## 💡 PRO TIPS
1. **Higher Timeframes = Stronger Trends** - Give more weight to 4H/Daily/Weekly
2. **Confluence is Key** - Best trades have 80%+ timeframe agreement
3. **Volume Confirms** - Look for volume spikes with signal alignment
4. **Patience Pays** - Wait for ★★★★★ setups for best results
5. **Risk Management** - Even perfect setups can fail, always use stops
---
## 🎯 ADVANCED USAGE
### **For Scalpers**
- Focus on 1m, 5m, 15m
- Quick confluence checks
- Rapid signal changes
### **For Day Traders**
- Use 5m to 1H primarily
- 4H for overall bias
- Balance speed with reliability
### **For Swing Traders**
- Emphasize 4H, Daily, Weekly
- Monthly for major trend
- Slower but more reliable signals
---
## 📞 SUPPORT & COMMUNITY
- 💬 **Comments Section** - Ask questions below
---
## ⚠️ RISK DISCLAIMER
Trading involves substantial risk of loss. Past performance does not guarantee future results. This indicator is for educational purposes and should not be considered financial advice. Always do your own research and use proper risk management.
---
## 🔄 VERSION HISTORY
**v1.0** (Current)
- Initial release
- 9 timeframe analysis
- 4 indicators per timeframe
- Confluence scoring system
- Full alert integration
- 4 color schemes
---
## 🙏 CREDITS
Inspired by institutional multi-timeframe analysis techniques
---
**🏷️ TAGS**
#MTF #MultiTimeframe #Dashboard #Confluence #TrendAnalysis #Momentum #RSI #MACD #Volume #DayTrading #SwingTrading #Scalping #Forex #Crypto #Stocks #TechnicalAnalysis #TradingDashboard #MarketAnalysis #AI #Signals
---
### ⭐ If this dashboard helps your trading, please leave a like and share your experience in the comments!
### 🚀 Click "Add to Favorites" to start seeing the market like never before!
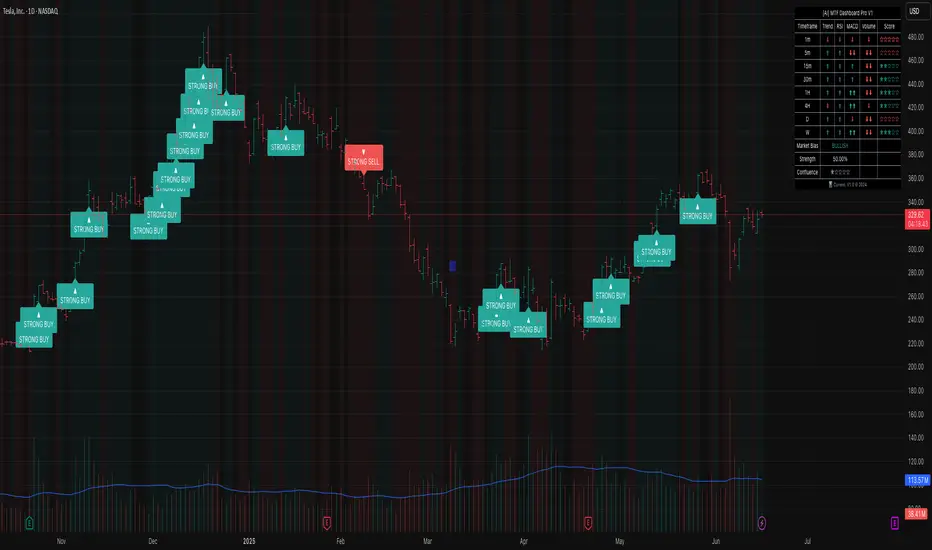
Tesla Strong Advanced MTF Dashboard Pro █ 9 Timeframes + Signals# 🚀 Advanced MTF Dashboard Pro █ 9 Timeframes + Signals
## The Ultimate Multi-Timeframe Analysis Dashboard - See Everything at a Glance!
Transform your trading with the most comprehensive MTF dashboard on TradingView. This professional-grade tool analyzes 9 timeframes simultaneously, giving you instant market insights that would normally require multiple charts and hours of analysis.
---
## ⚡ KEY FEATURES
### 📊 **9-Timeframe Analysis**
✅ **Complete Coverage** - 1m, 5m, 15m, 30m, 1H, 4H, Daily, Weekly, Monthly
✅ **Toggle Control** - Show only the timeframes you need
✅ **Real-Time Updates** - All data refreshes automatically
✅ **Clean Organization** - Professional table layout
✅ **Smart Positioning** - Place dashboard anywhere on chart
### 🎯 **Multi-Indicator Analysis Per Timeframe**
✅ **Trend Direction** - EMA cross-based trend detection
✅ **RSI Momentum** - Overbought/oversold conditions
✅ **MACD Signals** - Histogram direction and strength
✅ **Volume Analysis** - Above/below average volume
✅ **Confluence Score** - Combined signal strength rating
### 💎 **Advanced Signal System**
✅ **Visual Status Indicators**
- ⬆⬆ Strong Bullish
- ⬆ Bullish
- ➡ Neutral
- ⬇ Bearish
- ⬇⬇ Strong Bearish
✅ **Confluence Ratings**
- ★★★★★ Excellent Setup
- ★★★★☆ Strong Setup
- ★★★☆☆ Good Setup
- ★★☆☆☆ Fair Setup
- ★☆☆☆☆ Weak Setup
### 📈 **Market Analysis Dashboard**
✅ **Overall Market Bias** - Instant bullish/bearish/neutral assessment
✅ **Bias Strength %** - Quantified market direction strength
✅ **Confluence Score** - Overall setup quality rating
✅ **Trend Alignment** - See when multiple timeframes agree
✅ **Smart Filtering** - Focus on high-probability setups
### 🔔 **Professional Alert System**
✅ **Strong Signal Alerts** - When confluence is extremely high
✅ **Bias Change Alerts** - Market direction shifts
✅ **Custom Messages** - Detailed alert descriptions
✅ **Multi-Timeframe Alerts** - Know which timeframes triggered
✅ **Smart Frequency** - No alert spam
### 🎨 **Customization Options**
✅ **4 Color Schemes** - Professional, Classic, Vibrant, Dark
✅ **6 Table Positions** - Top/Bottom/Middle + Left/Right
✅ **4 Text Sizes** - Tiny to Large
✅ **Toggle Features** - Show/hide any component
✅ **Visual Preferences** - Background colors, signals, etc.
---
## 🎯 PERFECT FOR
• **Multi-Timeframe Traders** - See all timeframes without switching
• **Confluence Traders** - Find high-probability aligned setups
• **Day Traders** - Quick market assessment for entries
• **Swing Traders** - Identify major trend alignments
• **Scalpers** - Spot micro-trends within larger trends
---
## 📱 WORKS ON ALL MARKETS
✅ **Forex** - All currency pairs
✅ **Crypto** - Bitcoin, Ethereum, all altcoins
✅ **Stocks** - Individual stocks and ETFs
✅ **Indices** - S&P 500, NASDAQ, etc.
✅ **Commodities** - Gold, Oil, Silver
✅ **Futures** - All futures contracts
---
## ⚙️ QUICK START GUIDE
### 1️⃣ **Add to Chart**
Click "Add to Favorites" and apply to any chart
### 2️⃣ **Configure Timeframes**
- Toggle ON the timeframes you trade
- Toggle OFF timeframes you don't need
### 3️⃣ **Customize Appearance**
- Choose your color scheme
- Select table position
- Adjust text size for your screen
### 4️⃣ **Interpret Signals**
- **Green rows** = Bullish timeframes
- **Red rows** = Bearish timeframes
- **More arrows** = Stronger signals
- **More stars** = Better confluence
### 5️⃣ **Set Alerts**
Right-click indicator → "Add Alert" → Choose conditions
---
## 📚 TRADING STRATEGIES
### **Strategy 1: Confluence Trading**
1. Wait for 70%+ timeframes to align (same direction)
2. Enter when confluence score shows ★★★★ or better
3. Use lower timeframe for precise entry
4. Higher timeframes for trend direction
### **Strategy 2: Timeframe Divergence**
1. Look for lower TFs turning while higher TFs trend
2. Potential reversal when multiple TFs flip
3. Confirm with volume increase
4. Best at major support/resistance
### **Strategy 3: Momentum Alignment**
1. All momentum indicators (RSI/MACD) align
2. Volume confirms direction
3. Enter on pullback to moving average
4. Exit when momentum diverges
---
## 🛠️ INDICATOR SETTINGS EXPLAINED
### **Timeframe Selection**
Each timeframe can be toggled on/off. Only active timeframes:
- Appear in the dashboard
- Count toward confluence
- Trigger alerts
### **Indicator Parameters**
- **Fast/Slow EMA**: Trend detection sensitivity (9/21 default)
- **RSI Length**: Momentum period (14 default)
- **MACD Settings**: Signal generation (12/26/9 default)
### **Visual Settings**
- **Table Position**: Where dashboard appears
- **Text Size**: Readability adjustment
- **Color Scheme**: Match your chart theme
### **Signal Settings**
- **Show Trend Strength**: Display trend indicators
- **Show Momentum**: RSI/MACD columns
- **Show Volume**: Volume analysis column
- **Show Confluence**: Star rating column
---
## 🌟 WHY CHOOSE ADVANCED MTF DASHBOARD PRO?
### **🤖 AI-Enhanced Analysis**
Our algorithms intelligently weight signals based on timeframe importance and market conditions, providing more accurate confluence scores than simple averaging.
### **⚡ Lightning Fast**
Optimized code ensures smooth performance even with all 9 timeframes active. No lag, no delays, just instant insights.
### **👁️ See Everything**
Stop switching between charts. One glance shows you everything you need to make informed trading decisions.
### **🎯 Precision Timing**
Identify the exact moment when multiple timeframes align for the highest probability trades.
### **📈 Proven Results**
Based on professional trading techniques used by institutional traders, now accessible to everyone.
---
## 💡 PRO TIPS
1. **Higher Timeframes = Stronger Trends** - Give more weight to 4H/Daily/Weekly
2. **Confluence is Key** - Best trades have 80%+ timeframe agreement
3. **Volume Confirms** - Look for volume spikes with signal alignment
4. **Patience Pays** - Wait for ★★★★★ setups for best results
5. **Risk Management** - Even perfect setups can fail, always use stops
---
## 🎯 ADVANCED USAGE
### **For Scalpers**
- Focus on 1m, 5m, 15m
- Quick confluence checks
- Rapid signal changes
### **For Day Traders**
- Use 5m to 1H primarily
- 4H for overall bias
- Balance speed with reliability
### **For Swing Traders**
- Emphasize 4H, Daily, Weekly
- Monthly for major trend
- Slower but more reliable signals
---
## 📞 SUPPORT & COMMUNITY
- 💬 **Comments Section** - Ask questions below
---
## ⚠️ RISK DISCLAIMER
Trading involves substantial risk of loss. Past performance does not guarantee future results. This indicator is for educational purposes and should not be considered financial advice. Always do your own research and use proper risk management.
---
## 🔄 VERSION HISTORY
**v1.0** (Current)
- Initial release
- 9 timeframe analysis
- 4 indicators per timeframe
- Confluence scoring system
- Full alert integration
- 4 color schemes
---
## 🙏 CREDITS
Developed by
Inspired by institutional multi-timeframe analysis techniques
---
**🏷️ TAGS**
#MTF #MultiTimeframe #Dashboard #Confluence #TrendAnalysis #Momentum #RSI #MACD #Volume #DayTrading #SwingTrading #Scalping #Forex #Crypto #Stocks #TechnicalAnalysis #TradingDashboard #MarketAnalysis #AI #Signals
---
### ⭐ If this dashboard helps your trading, please leave a like and share your experience in the comments!
### 🚀 Click "Add to Favorites" to start seeing the market like never before!
Protected script
This script is published as closed-source. However, you can use it freely and without any limitations – learn more here.
SpeedEdge_Securities
Also on:
Disclaimer
The information and publications are not meant to be, and do not constitute, financial, investment, trading, or other types of advice or recommendations supplied or endorsed by TradingView. Read more in the Terms of Use.
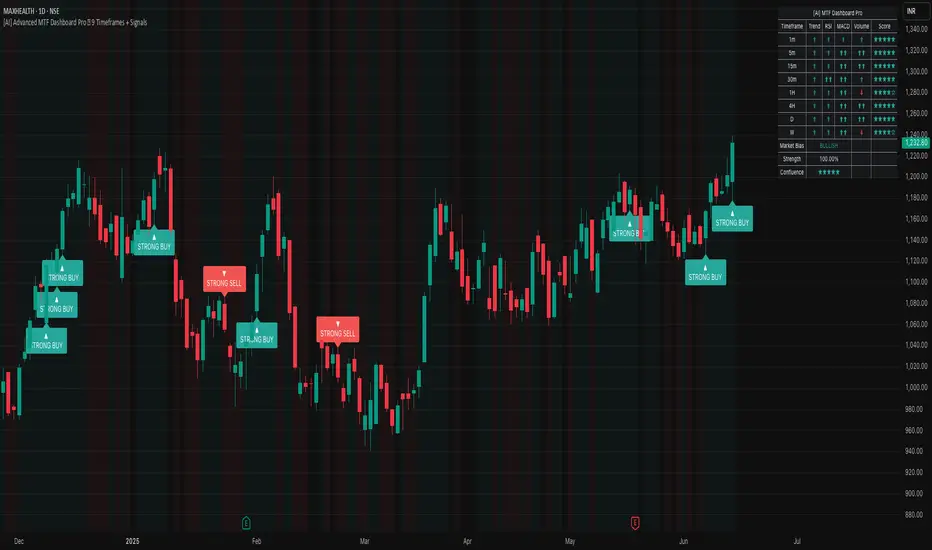
[AI] Advanced MTF Dashboard Pro 9 Timeframes + Signals# 🚀 Advanced MTF Dashboard Pro █ 9 Timeframes + Signals
## The Ultimate Multi-Timeframe Analysis Dashboard - See Everything at a Glance!
Transform your trading with the most comprehensive MTF dashboard on TradingView. This professional-grade tool analyzes 9 timeframes simultaneously, giving you instant market insights that would normally require multiple charts and hours of analysis.
---
## ⚡ KEY FEATURES
### 📊 **9-Timeframe Analysis**
✅ **Complete Coverage** - 1m, 5m, 15m, 30m, 1H, 4H, Daily, Weekly, Monthly
✅ **Toggle Control** - Show only the timeframes you need
✅ **Real-Time Updates** - All data refreshes automatically
✅ **Clean Organization** - Professional table layout
✅ **Smart Positioning** - Place dashboard anywhere on chart
### 🎯 **Multi-Indicator Analysis Per Timeframe**
✅ **Trend Direction** - EMA cross-based trend detection
✅ **RSI Momentum** - Overbought/oversold conditions
✅ **MACD Signals** - Histogram direction and strength
✅ **Volume Analysis** - Above/below average volume
✅ **Confluence Score** - Combined signal strength rating
### 💎 **Advanced Signal System**
✅ **Visual Status Indicators**
- ⬆⬆ Strong Bullish
- ⬆ Bullish
- ➡ Neutral
- ⬇ Bearish
- ⬇⬇ Strong Bearish
✅ **Confluence Ratings**
- ★★★★★ Excellent Setup
- ★★★★☆ Strong Setup
- ★★★☆☆ Good Setup
- ★★☆☆☆ Fair Setup
- ★☆☆☆☆ Weak Setup
### 📈 **Market Analysis Dashboard**
✅ **Overall Market Bias** - Instant bullish/bearish/neutral assessment
✅ **Bias Strength %** - Quantified market direction strength
✅ **Confluence Score** - Overall setup quality rating
✅ **Trend Alignment** - See when multiple timeframes agree
✅ **Smart Filtering** - Focus on high-probability setups
### 🔔 **Professional Alert System**
✅ **Strong Signal Alerts** - When confluence is extremely high
✅ **Bias Change Alerts** - Market direction shifts
✅ **Custom Messages** - Detailed alert descriptions
✅ **Multi-Timeframe Alerts** - Know which timeframes triggered
✅ **Smart Frequency** - No alert spam
### 🎨 **Customization Options**
✅ **4 Color Schemes** - Professional, Classic, Vibrant, Dark
✅ **6 Table Positions** - Top/Bottom/Middle + Left/Right
✅ **4 Text Sizes** - Tiny to Large
✅ **Toggle Features** - Show/hide any component
✅ **Visual Preferences** - Background colors, signals, etc.
---
## 🎯 PERFECT FOR
• **Multi-Timeframe Traders** - See all timeframes without switching
• **Confluence Traders** - Find high-probability aligned setups
• **Day Traders** - Quick market assessment for entries
• **Swing Traders** - Identify major trend alignments
• **Scalpers** - Spot micro-trends within larger trends
---
## 📱 WORKS ON ALL MARKETS
✅ **Forex** - All currency pairs
✅ **Crypto** - Bitcoin, Ethereum, all altcoins
✅ **Stocks** - Individual stocks and ETFs
✅ **Indices** - S&P 500, NASDAQ, etc.
✅ **Commodities** - Gold, Oil, Silver
✅ **Futures** - All futures contracts
---
## ⚙️ QUICK START GUIDE
### 1️⃣ **Add to Chart**
Click "Add to Favorites" and apply to any chart
### 2️⃣ **Configure Timeframes**
- Toggle ON the timeframes you trade
- Toggle OFF timeframes you don't need
### 3️⃣ **Customize Appearance**
- Choose your color scheme
- Select table position
- Adjust text size for your screen
### 4️⃣ **Interpret Signals**
- **Green rows** = Bullish timeframes
- **Red rows** = Bearish timeframes
- **More arrows** = Stronger signals
- **More stars** = Better confluence
### 5️⃣ **Set Alerts**
Right-click indicator → "Add Alert" → Choose conditions
---
## 📚 TRADING STRATEGIES
### **Strategy 1: Confluence Trading**
1. Wait for 70%+ timeframes to align (same direction)
2. Enter when confluence score shows ★★★★ or better
3. Use lower timeframe for precise entry
4. Higher timeframes for trend direction
### **Strategy 2: Timeframe Divergence**
1. Look for lower TFs turning while higher TFs trend
2. Potential reversal when multiple TFs flip
3. Confirm with volume increase
4. Best at major support/resistance
### **Strategy 3: Momentum Alignment**
1. All momentum indicators (RSI/MACD) align
2. Volume confirms direction
3. Enter on pullback to moving average
4. Exit when momentum diverges
---
## 🛠️ INDICATOR SETTINGS EXPLAINED
### **Timeframe Selection**
Each timeframe can be toggled on/off. Only active timeframes:
- Appear in the dashboard
- Count toward confluence
- Trigger alerts
### **Indicator Parameters**
- **Fast/Slow EMA**: Trend detection sensitivity (9/21 default)
- **RSI Length**: Momentum period (14 default)
- **MACD Settings**: Signal generation (12/26/9 default)
### **Visual Settings**
- **Table Position**: Where dashboard appears
- **Text Size**: Readability adjustment
- **Color Scheme**: Match your chart theme
### **Signal Settings**
- **Show Trend Strength**: Display trend indicators
- **Show Momentum**: RSI/MACD columns
- **Show Volume**: Volume analysis column
- **Show Confluence**: Star rating column
---
## 🌟 WHY CHOOSE ADVANCED MTF DASHBOARD PRO?
### **🤖 AI-Enhanced Analysis**
Our algorithms intelligently weight signals based on timeframe importance and market conditions, providing more accurate confluence scores than simple averaging.
### **⚡ Lightning Fast**
Optimized code ensures smooth performance even with all 9 timeframes active. No lag, no delays, just instant insights.
### **👁️ See Everything**
Stop switching between charts. One glance shows you everything you need to make informed trading decisions.
### **🎯 Precision Timing**
Identify the exact moment when multiple timeframes align for the highest probability trades.
### **📈 Proven Results**
Based on professional trading techniques used by institutional traders, now accessible to everyone.
---
## 💡 PRO TIPS
1. **Higher Timeframes = Stronger Trends** - Give more weight to 4H/Daily/Weekly
2. **Confluence is Key** - Best trades have 80%+ timeframe agreement
3. **Volume Confirms** - Look for volume spikes with signal alignment
4. **Patience Pays** - Wait for ★★★★★ setups for best results
5. **Risk Management** - Even perfect setups can fail, always use stops
---
## 🎯 ADVANCED USAGE
### **For Scalpers**
- Focus on 1m, 5m, 15m
- Quick confluence checks
- Rapid signal changes
### **For Day Traders**
- Use 5m to 1H primarily
- 4H for overall bias
- Balance speed with reliability
### **For Swing Traders**
- Emphasize 4H, Daily, Weekly
- Monthly for major trend
- Slower but more reliable signals
---
## 📞 SUPPORT & COMMUNITY
- 💬 **Comments Section** - Ask questions below
---
## ⚠️ RISK DISCLAIMER
Trading involves substantial risk of loss. Past performance does not guarantee future results. This indicator is for educational purposes and should not be considered financial advice. Always do your own research and use proper risk management.
---
## 🔄 VERSION HISTORY
**v1.0** (Current)
- Initial release
- 9 timeframe analysis
- 4 indicators per timeframe
- Confluence scoring system
- Full alert integration
- 4 color schemes
---
---
**🏷️ TAGS**
#MTF #MultiTimeframe #Dashboard #Confluence #TrendAnalysis #Momentum #RSI #MACD #Volume #DayTrading #SwingTrading #Scalping #Forex #Crypto #Stocks #TechnicalAnalysis #TradingDashboard #MarketAnalysis #AI #Signals
---
### ⭐ If this dashboard helps your trading, please leave a like and share your experience in the comments!
### 🚀 Click "Add to Favorites" to start seeing the market like never before!
Etranal Privious Known As ZomatoHere’s a detailed breakdown of the **Zomato Business Model** (2024–2025 version), structured for clarity:
---
## 🍽️ **Zomato Ltd – Business Model Overview**
**Zomato Ltd** is an Indian multinational company primarily operating in the food delivery and restaurant aggregator space. It has evolved into a full-stack food ecosystem player, with diversified revenue streams and a tech-driven service platform.
---
### 1. **Business Type**
**B2C & B2B Platform**
* B2C: Food delivery, dine-out services, Zomato Gold (now Zomato Pro), Hyperpure groceries.
* B2B: Supplies to restaurants (Hyperpure), SaaS tools for restaurants.
---
### 2. **Core Offerings**
* **Online Food Delivery** (Main revenue generator)
* **Restaurant Discovery & Reviews**
* **Table Booking & Dine-out Deals**
* **Hyperpure (B2B supply chain for restaurants)**
* **Zomato Pro/Zomato Gold Memberships**
* **Quick Commerce (via Blinkit)**
---
### 3. **Revenue Streams**
| Source | Description |
| ------------------------------- | -------------------------------------------------------------------------- |
| 🛵 **Food Delivery Commission** | Charges 15–25% commission per order from restaurants |
| 📦 **Delivery Charges** | Customer delivery fee; sometimes surge-based |
| 🛒 **Hyperpure** | Sells fresh ingredients and supplies to restaurants (B2B supply chain) |
| 💳 **Zomato Pro/Gold** | Subscription revenue from premium users for discounts and exclusive access |
| 💼 **Advertising** | Restaurants pay for listing promotions and higher visibility |
| ⚡ **Blinkit (Quick Commerce)** | Fast delivery of groceries and essentials (10–20 minute delivery) |
---
### 4. **Customer Segments**
* **Individual Consumers**: Ordering food, groceries, dining out.
* **Restaurants**: B2B services like Hyperpure, marketing, software.
* **Retail Vendors**: Via Blinkit, for grocery and essentials delivery.
---
### 5. **Key Partners**
* **Restaurants** (Partnered for delivery and dine-in offers)
* **Delivery Personnel (Gig Workers)**
* **Suppliers and Farmers** (For Hyperpure)
* **Retailers and Warehouses** (For Blinkit)
---
### 6. **Technology & App Ecosystem**
* Real-time tracking, location-based recommendations.
* AI-powered personalization, pricing, logistics.
* API and dashboards for restaurant partners.
---
### 7. **Cost Structure**
* Delivery partner payments
* Discounts, cashbacks, and offers
* Technology and infrastructure (servers, R\&D)
* Customer support and marketing
* Warehouse & logistics (Blinkit and Hyperpure)
---
### 8. **Unique Selling Points (USP)**
* Deep integration with restaurant partners
* Dual model: Marketplace (Zomato) + Fulfillment (Blinkit, Hyperpure)
* Strong brand loyalty and pan-India presence
---
### 9. **Challenges**
* High competition (Swiggy, ONDC, etc.)
* Thin profit margins in food delivery
* Regulatory compliance in gig economy and FSSAI norms
---
### 10. **Future Outlook**
* Expanding **Quick Commerce** footprint via Blinkit
* Strengthening **Hyperpure** to dominate the restaurant supply chain
* Enhancing **AI and data analytics** for personalization and efficiency
* Exploring **international expansions** cautiously
---

EURCHFNEXT WEEK READY FOR SHORT AFTER CONFRMATION Borrow the asset (usually from a broker).
Sell it immediately at the current market price.
Wait for the price to drop.
Buy it back at the lower price.
Return the borrowed asset and keep the difference as profit.
Example:
You short a stock at $100.
The price drops to $80.
You buy it back and return it.
You make a $20 profit per share.
Risks:
Unlimited losses if the price rises instead of falls.
Requires margin and may incur fees.
Let me know if you want a version tailored for beginners, crypto, or professional use.

GOLD DAILY PLAN MAY 19: IS THIS THE START OF A MASSIVE BULLISH GOLD DAILY PLAN – MAY 20: IS THIS THE START OF A MASSIVE BULLISH RUN?
Gold opened the new trading week with a powerful GAP UP of over 20 USD, followed by an additional 50 USD rally during the Asia session. This explosive move is being fueled by geopolitical tensions and macroeconomic uncertainty, setting the tone for what could be a highly volatile and profitable week for gold traders.
🔥 Key Fundamental Drivers Behind This Gold Rally:
1️⃣ Putin rejects peace talks – Increased war risks reignite gold’s safe-haven appeal.
2️⃣ U.S. credit rating downgraded – Rising debt and bond yields are pushing investors back to gold.
3️⃣ Trump threatens new trade tariffs – Even a softer version of “Trade War 2.0” could shock global markets, making gold a top hedge.
➡️ With no clear resolutions in sight, gold may soon retest the all-time high of $3,500.
🧠 Technical Analysis: Bullish Signals Are Confirming
EMA13 has crossed above EMA34 and EMA200 on the M30 chart — a classic reversal confirmation.
The main trendline was broken, and price is now retesting the breakout zone.
Momentum remains strong, and price structure is shifting bullish. Priority is now to BUY the dips rather than sell counter-trend.
📌 Key Price Levels to Watch:
🔺 Resistance Zones:
3254 – 3277 – 3288
(If price breaks above 3287, we may quickly see a move toward 3350–3500.)
🔻 Support Zones:
3204 – 3193 – 3186 – 3174 – 3163
(Best areas to watch for confirmation to BUY.)
🎯 Suggested Trade Ideas:
BUY Zone: 3186 - 3184
Stop-Loss (SL): 3180
Take-Profit (TP): 3190 → 3195 → 3200 → 3210 → 3220 → 3230
BUY Scalp: 3194 - 3192
Stop-loss: 3189
Take-Profit: 3200 - 3204 - 3210 - 3215 - 3220
SELL Zone: 3287 - 3289 Only scalp or take quick profits near resistance zones
Stop-Loss (SL): 3293
Take-Profit (TP): 3285 → 3280 → 3285 → 3280 → 3270
(Note: Avoid holding SELLs, only scalp on strong bearish signals.)
⚠️ Trading Notes:
Market is highly sensitive to geopolitical headlines. One comment from Trump or Putin could move gold 50–100 USD in minutes.
No need to chase price. Let it come to your zones — and only enter on clear confirmations.
📌 Summary:
✅ Structure has turned bullish across M30 and H4.
✅ Focus on buying dips, not shorting into strength.
✅ Medium-term target zones: 3350 → 3400 → 3500, depending on continued macro pressure.
📣 Follow AD for live trading plans, market sentiment, and smart entry zones every session!
Good luck & stay disciplined.

nifty 50 analysisThe Nifty 50 index closed at 22,380.50 as of May 14, 2025, registering a weekly gain of 1.4% and continuing its upward momentum with a year-to-date return of 6.7%. Market sentiment remained broadly positive, supported by strong Q4 corporate earnings, the Reserve Bank of India's steady monetary policy stance, and improving global cues such as easing US inflation and dovish central bank commentary. Sector-wise, Financials and Autos led the rally, while Energy lagged due to volatility in crude prices. Technical indicators suggest the index remains in an uptrend, with key support at 22,100 and resistance around 22,600. While the medium-term outlook remains constructive, supported by stable macros and earnings visibility, investors should remain mindful of global geopolitical risks, elevated oil prices, and the upcoming monsoon season. Overall, the market presents a favorable environment for disciplined equity investing, with a focus on large-cap and quality mid-cap stocks in cyclical and domestic-facing sectors.
Let me know if you'd like a version for retail clients, social media, or a shorter summary.

SEI - WEAKLY TECHNICAL NYSE:SEI boasts a transaction finality of around 390 milliseconds—faster than many competitors like #Solana — thanks to its Twin-Turbo Consensus, an optimized version of Cosmos’ Tendermint. It can theoretically handle 12,500 transactions per second, making it ideal for high-frequency trading.
📉Chart for your reference

12163 Pullback set upTrade Thesis
a) Pull back set up
b) pull back volume of bear volume is very less
c) vwap support
d) fib support
e) SL compulsory
Trading mindset requirements
a) When you have intention, you are
living it all day, every day. You don’t just have a goal; you are truly committing to maintaining an awareness of self-actualizing the very best version of yourself.
b)Adversity, pain, and misfortune are equal opportunity employers. They work everybody. The real question is not will bad day.
c)There is a common misconception about the meaning of letting go. It doesn’t mean whatever happens, happens, nor should you relinquish responsibility to fate. Nothing
could be further from the truth! The goal is to perform uninhibitedly during actual play, just as you did during practice.
d) All you need to start is to focus on one thing, one movement. Once you hit that mark, your subconscious takes over, with behaviors that have become so engrained through perfect
practice, they’re second nature.

12160 Price in the zone of contractionTrade thesis
1. Trading opportunity: Currently, the price is in the zone of contraction, whenever the price leaves 23800 ti 23500 forms the trading opportunities as presented in chart.
2. The current forecast is the mirror image of 19th Dec; because 19 Dec and 7 Jan looks 30 min tight range and its probable expulsion from range is possible similar to 20 Dec. History tends to repeat is the logic of concept.
3. The fib resistance fan helps the intraday timing of reverse as support and resistance for short term trading opportunity based on price action at that point
4. SL Compulsory
2. Trading mindset requirements
a) The man who has mastered the mindset of a champion who lives with intention.
b)Struggles and things that annoy you are often your best teachers.
c) Becoming a real champion requires having a champion mindset, and that means being a champion human being. As a champion, you are in a position to lead. Checking in with your humanity is how you go beyond champion thinking to champion living.
d)Priming kicks off a chain reaction of thoughts and awareness that helps you get focused and stay centered throughout your day.
e)When you have intention, you are
living it all day, every day. You don’t just have a goal; you are truly committing to maintaining an awareness of self-actualizing the very best version of yourself.

12130 Consolidation breakout possibleTrade thesis
a) Long above 1840 and closing first 5 min of the day triggers consolidation breakout
b) every time at channel bottom, it is moving moving higher and same may repeat.
c) Triangle breakout
d) Weekly breakout possible
e) POC breakout
f) SL compulsory
Still world market is mild negative, but the high bond yield price and inflations catalyzes bullishness in the pharma and Information sector stocks.
Trading mindset requirements
a) Champion Mindset: Developing successful mindset require being a champion human being and helps to go beyond champion thinking to champion living. Tuning in to your authentic self will develop the most productive habit of all—the habit of
feeling and living connected.
b) Morning Kick off: Priming kicks off a chain reaction of thoughts and awareness that helps you get focused and stay centered throughout your day.
c)Live everyday with Good Intensions: When you have intention, you are living it all day, every day. You don’t just have a goal; you are truly committing to maintaining an awareness of self-actualizing the very best version of yourself.
d) Equal opportunity employer: Adversity, pain, and misfortune are equal opportunity employers. They work everybody. The real question is not will bad days occur, but rather how you will deal with them when they do . How prepared are you.
e)Train your brain: Train your mind and body with perfect practice and build the self-image of a winner, you learn to trust the subconscious and unblock its power to deliver peak performance.
g) Letting go misconception: There is a common misconception about the meaning of letting go. It doesn’t mean whatever happens, happens, nor should you relinquish responsibility to fate. Nothing
could be further from the truth! The goal is to perform uninhibitedly during actual play, just as you did during practice.

12131 Todays intraday pickTrade Thesis
a) pole and flag set up
b) Weekly high breakout
c) pole and flag set up
d) upper channel breakout possibility
e) volume accumulation
f) complex pull back breakout set up in higher time frame
h) SL compulsory
Trading mindset requirements
a) Champion Mindset : Developing successful mindset require being a champion human being and helps to go beyond champion thinking to champion living. Tuning in to your authentic self will develop the most productive habit of all—the habit of
feeling and living connected.
b) Morning Kick off: Priming kicks off a chain reaction of thoughts and awareness that helps you get focused and stay centered throughout your day.
c) Live everyday with Good Intensions : When you have intention, you are living it all day, every day. You don’t just have a goal; you are truly committing to maintaining an awareness of self-actualizing the very best version of yourself.
d) Equal opportunity employer: Adversity, pain, and misfortune are equal opportunity employers. They work everybody. The real question is not will bad days occur, but rather how you will deal with them when they do. How prepared are you.
e) Train your brain : Train your mind and body with perfect practice and build the self-image of a winner, you learn to trust the subconscious and unblock its power to deliver peak performance.
g) Letting go misconception : There is a common misconception about the meaning of letting go. It doesn’t mean whatever happens, happens, nor should you relinquish responsibility to fate. Nothing
could be further from the truth! The goal is to perform uninhibitedly during actual play, just as you did during practice.

ERIS Lifesciences for 25% gainsDate: 3 Dec’24
Symbol: ERIS
Timeframe: Weekly
ERIS Lifesciences currently seems to be in Wave V of 3 which is heading towards 1960-70 (25% from current price of 1470) as seen in the chart. Wave 4 could then correct back to 1300 levels.
The company, in the recently announced September quarter results has posted best ever revenues and operating profits.
This is not a prediction but a possible wave count. This is also not a recommendation to trade or invest. Please do your own analysis.
HINGLISH VERSION
ERIS Lifesciences vartamaan mein Wave 3 ki V mein dikh rahee hai jo 1960-70 (vartamaan keemat 1470 se 25%) kee taraf badh rahee hai jaisa ki chart mein dekh sakte hain. Wave 4 phir 1300 ke star tak neeche aa sakta hai.
Company ne haal hee mein ghoshit September quarter results mein ab tak ka sabse achchha revenue aur operating profit darj kiya hai.
Yah koi prediction nahin balki sambhaavit Wave count hai. Yah trade lene ya invest karne ki bhi salaah nahi hai. Kripya apana vishleshan khud karein.

Natco Pharma for 45%+ gainsDate: 21 Nov’24
Symbol: NATCOPHARM
Timeframe: Daily
Natco Pharma currently seems to be in Wave IV of 3 which could end around 1240-1220 and Wave V could then head towards 1800-1900 levels (45%+ from where Wave IV would end) as seen in the chart. A more precise target can be pinned once it makes a fresh ATH. Two levels (1770 & 1900) have been marked as possible supply zone.
The company recently posted good Q2 numbers. The stock is currently trading at a PE multiple of 12.6 while the industry average is around 32.
This is not a prediction but a possible wave count. This is also not a recommendation to trade or invest. Please do your own analysis.
HINGLISH VERSION
Natco Pharma vartamaan mein 3 ke Wave IV mein hai, jo 1240-1220 ke aaspaas samaapt ho sakta hai aur Wave V phir 1800-1900 ke star (45%+ jahaan Wave IV samaapt hoga) kee taraf badh sakta hai, jaisa ki chart mein dekh sakte hain. Ek baar naya ATH banaane par adhik sateek target pin kiya ja sakta hai. Do staron (1770 aur 1900) ko sambhaavit supply zone ke roop mein mark kiya gaya hai.
Company ne haal hee mein achhe Q2 ke numbers post kiye hain. Stock vartamaan mein 12.6 ke PE multiple par kaarobaar kar raha hai jabki industry ka average lagbhag 32 hai.
Yah koee bhavishyavaanee nahin balki sambhaavit Wave count hai. Yah trade lene ya invest karne ki bhi salaah nahi hai. Kripya apana vishleshan svayan karen.

Nifty heading towards 22kDate: 17 Nov’24
Symbol: NIFTY
Timeframe: Daily
Nifty 50 seems to be in final stages of Wave A of an ABC correction that began in Sept’24. Correction in A could end around 23300 and if it breaks that level, it could even head to 23050-23000. It would then witness a pull back towards 25000 levels in Wave B as seen in the chart and finally Wave C down.
Please note this is a possible wave count and Nifty as an instrument always runs on multiple global event risks. Maharashtra votes on 20th Nov’24 and election results are on Saturday, 23rd so it’s unlikely that Nifty will see a pullback or Wave B this week. Investors/Traders in US see lesser chances of another interest rate cut in December meeting so it’s a wait and watch there.
This is not a trade recommendation but my humble submission of possible movement in Nifty. Please do your own analysis. And I’ve the right to be wrong.
HINGLISH VERSION
Aisa lagta hai ki Nifty 50 Sept’24 mein shuroo hue ABC correction ke Wave A ke antim charan mein hai. Wave A mein correction 23300 ke aaspaas samaapt ho sakta hai aur yadi yah us star ko todta hai, to yah 23000-23050 tak bhee ja sakta hai. Jaisa ki chart mein dekh sakte hain, iske baad Wave B mein 25000 ke star tak vaapasee hogee aur ant mein Wave C mein giraavat aaegee.
Kripya dhyaan den ki yah ek sambhaavit Wave count hai aur Nifty hamesha kai duniya bhar ki ghatanaon ke jokhimon par chalta hai. Maharashtra mein 20 Nov’24 ko voting hogi aur chunaav nateeje Saturday 23rd ko aaenge, isliye iski sambhaavana nahin hai ki is saptaah Nifty mein pull back ya Wave B dekhne ko mile. US mein niveshakon/vyaapaariyon ko December kee baithak mein ek aur interest rate cut kee sambhaavana kam dikh rahee hai, isliye vahaan wait and watch kee sthiti hai.
Yah koi trade lene ki salah nahi hai balki Nifty mein sambhaavit utaar-chadhaav ke baare mein meri vinamra koshish hai. Kripya apna vishleshan khud karen. Aur mujhe galat hone ka adhikaar hai.

EPL Ltd for 60% gains; best ever quarter resultsDate: 11Nov’24
Symbol: EPL
Timeframe: Daily
EPL (formerly known as Essel Propack Ltd) seems to be in Wave III of 3 which could extend to 400 levels (60% from current price of 250) as seen in the chart. Possible wave counts have been marked which will have to be reviewed as the move develops. EPL has posted best ever quarter sales and profits in Q2 today so a big jump may be seen tomorrow, 12 Nov’24.
This is not a trade recommendation. Please do your own analysis. And I have the right to be wrong.
HINGLISH VERSION
Aisa lagta hai ki EPL (pehle jiska naam Essel Propack tha) 3 ki Wave III mein hai jo 400 ke star (250 ki vartamaan keemat se 60%) tak badh sakta hai jaisa ki chart mein dekh sakte hain. Sambhavit Wave numbering ko chihnit kar liya gaya hai jiski sameeksha chaal vikasit hone par kee jaegee. EPL ne aaj Q2FY25 mein ab tak ki sabase achchhee quarterly sales aur profit darj kiya hai, isliye kal, 12 Nov’24 ko ek bada uchhaal dekha ja sakta hai.
Yah koi trade lene ya invest karne ki salaah nahi hai. Kripya apana vishleshan khud karein. Aur mujhe galat hone ka adhikaar hai.

Sharda Cropchem for 60% gainsDate: 11 Nov’24
Symbol: SHARDACROP
Timeframe: Daily
Sharda Cropchem seems to be in Wave III of 3 which is heading towards 1350 (~60% from current price of 800) as seen in the chart. Wave 3 could even extend to 1500 which can be reviewed after closing above 1100 in Wave V of 3. Recent Q2 results are good with better margins compared to last FY.
This is not a trade recommendation. Please do your own analysis. And I have the right to be wrong.
HINGLISH VERSION
Jaisa ki chart mein dekha gaya hai, Sharda Cropchem 3 ke Wave III mein dikh raha hai jo 1350 (800 ki maujooda keemat se ~60%) ki taraf badh raha hai. Wave 3 1500 tak bhi jaa sakta hai; jiskee sameeksha 3 ke Wave V mein 1100 se upar band hone ke baad ki jaa sakti hai. Pichhle FY ki tulana mein behatar margin ke saath haal ke Q2 ke nateeje achchhe hain.
Yah koi trade lene ya nivesh karne ki salah nahin hai. Kripya apna vishleshan svayan karen. Aur mujhe galat hone ka adhikaar hai.
