ACC's Channel within a Channel: Is it going to be exponential?🚀Once the scrip breaks upper bar of the ascending channel. It zooms like anything. The same pattern has been showcased by many stocks in the past. One of the best examples are JSW steel and JSW energy.
Search in ideas for "Zoom"

BirlaSoft: the next IT boomBeautiful pennant formation in progress, have to wait for 1-2 weeks before it Birla zooms upside, Target can be 450.

Ashok Leyland: How Technicals helped us capture 11.3% movementAshok Leyland
This is what was posted on June 21, 2021
At 115.90 the stock was near the blue line which had acted as resistance previously... In Technical Analysis theory, there is a higher probability of previous resistance acting as support and vice versa. Based on this simple rule the trade was initiated.
Today Result NEWS has come out and stock opens with a big gap up and zooms further high in morning trade itself
Decide for yourself whether you want still want to listen to NEWS to make your trading decisions or listen to Charts directly and be a STEP AHEAD
Like & Follow
But don't follow me blindly
Learn to identify such opportunities independently

Indiabulls Housing Finance - Very AttractiveMarket Cap ₹ 9,520 Cr.
Stock P/E 7.41 Vs Industry PE 21.2
ROCE 10.2 %
ROE 13.8 %
OPM 5Year avg 87.4 %
Promoter holding 22.5 % (negative)
Pledged percentage 0 %
Debt to equity 4.58
Intrinsic Value ₹ 1,173
Best of all is at current price
Dividend Yield 15.1 % and it consistently paysout dividend.
Technically bullish divergence Spotted. After the breakout of the Triangle , it would ZOOM. Choice is yours about whether you want to accumulate before or after the breakout.

Uttam Sugar Mills breakout complete now consolidating.All observations on chart.
All sugar stocks are zooming.
Uttam sugar has formed a large falling wegde, bullish pattern. After breaking out stock is sideways for almost 4+ months with increased volumes, this shows accumulation is going on.
Expecting a breakout soon here.
Entry will trigger above 116. RR is more than 1:1. To make it more favorable one can enter with conviction now at CMP .
One can buy partial quantity now and rest above 116.
Besides these Other sugar stocks.
1. NSE:BALRAMCHIN
2. NSE:ANDHRSUGAR ( link attached below )
3. NSE:DHAMPURSUG
4. NSE:DALMIASUG
5. BSE:DCMSRMIND
6. NSE:AVADHSUGAR


Bajfinance almost 500+ above 4900Bajfinance almost 500+ above 4900... Asked to go long above 4900 and see how it zoomed.

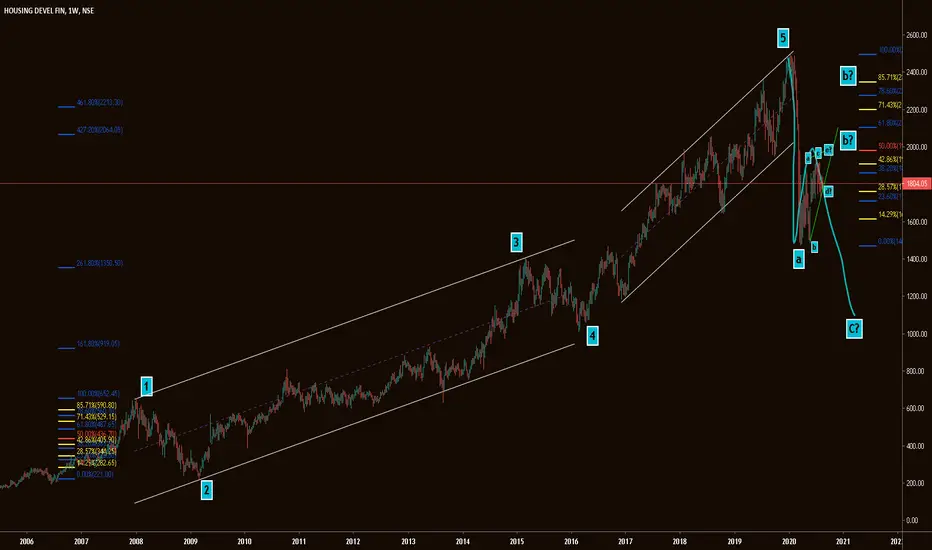
Wave Count HDFC - The possible moveOm Namah Shivay
Trying with Airtel for the next possible moves. Some smaller legs are left to be completed if zoomed. It can move high for completing b. But the final move is/will be towards down to make the c?
Just a practice sheet by a new comer. Do not trade on this.
Om Namah Shivay


XRP possibly read to take offXRP wedge is bullish on 15 minute charts. Each of the arrows represent a point at which XRP did a WXY, where W goes on an uptrend, Xcomes down for a slight correction, and Y zooms upwards. At each of the point with an arrow, XRP followed this correctional wave and uptrend. Important point to note is that the Y will reach a maximum short term target of 1.62 times the W. Which means, if W is at the $1.2 level, Y can go $1.944 in a three wave short term run. Looks set up for the same move since market correction also seems to be past the worst. Long term trend intact (bullish), targets look poised to go 4-5x current levels in a 1-2 month horizon

SELAN - Long term BreakoutSELAN is in the formation of Bottoming process. It has given breakout of long term resistance of 200. Now once it crosses minor resistance of 242 level expect it to zoom.
Buy above 242 with a Stop loss of 220

Reversal...BuyLooks like downtrend is over crossover with volumes..now stock is ready to zoom..140-160 should be seen quickly..SL of 80..

JSW steel - continuous wave pattern Scrip can slide back with %william going down
Will wait for corrections to happen and reach near break out price point before it zooms off towards resistance levels/doesn't stall and carves out new upward wave pattern
Can trade long if the scrip manages to break crucial resistance of 209 - 52week high
Company with good fundamental although with mounting debt but interest coverage appears fine to cover up

PetroNet : Fueling it Up...Let's fill in our tanks and make ourselves ready for upside Breakout in Petronet. Actually I'm not interested in the downside Breakout, if you zoomout n see there can be shark pattern formation, haven't checked it though by drawing just saying by the perception I get from Petronet. You can try for that shark also if interested but simple channel upside break can be good n better :)

TCS - Did you sell@2600 & bought at 2530 -Magic of 2510-2535Wow! - It was 5 candles & down in the zone 2510-2535 as expected when TCS was dancing at 2600. Later took support in the zone 2510-2535 & pushed upside to 2591.
The latest candle formed at 2591 has long upper shadows & small body which gives an appearance of a shooting star candlestick pattern which indicates weakness. This weakness turns into strength once it moves above its high@2591.
Trading Strategy for Bulls
Next, we should buy TCS only above 2600 where we left last time or look for buying opportunity in 2450-2475 zone if holds & we see TCS not falling any more.
Previous Update - TCS zooms from 2335 to 2600- Solid Performance from TCS counter.

Timken( INVERTED H&S)On weekly charts, It appears that we may get breakout from INVERTED H&S.
If this pattern develops, then this stock can fly, boom and zoom...
Target for this breakout would be 800
Like it if you love it :)


SBI looks Good at this 780 levelsA long trade can be initiated in SBIN with an SL of 760 and a target of 800 820 850 and 950 in nearly one month. Biggest PSU bank with a lot of cash and profits zooming every year.

11665 HSP Set upReason for long
a) HSP Set up
b) weekly breakout
c) vwap breakout
d) Triangle breakout
e) Fundas okay
f) TYRES stocks zooming up in recent time
g) SL compulsory

BankNifty Analysis 25 June Consolidation and Potential Breakout📈 Bank Nifty Analysis: Consolidation and Potential Breakout
Since June 19th, Bank Nifty has been trading within a range of 51,136 to 51,944 after the Election Result Rally. Zooming out to a broader time frame, we observe price consolidation within this range, hinting at an imminent breakout to new highs.
Scenarios:
Scenario 1 (Gap Up):
If Bank Nifty opens above or around 51,950, watch for resistance near 51,900.
Consider buying if the price holds above 52,000 within a 30-minute time frame.
Scenario 2 (Flat Opening):
If the price breaks the 51,500 support zone, expect a test of strong support at 51,136.
A hold above 51,136 could lead to movement toward the upper limit of the range (around 51,900).
Scenario 3 (Gap Down):
A gap-down opening with a break below 51,136 may result in a decline toward 50,500 and beyond.
Strong breaks through support zones could trigger a significant breakdown toward 49,000 in the coming weeks.
✅ Bank Nifty Support and Resistance Levels:
Intraday Resistance Zone: 51,700 - 51,800
Intraday Resistance 1: 51,800
Intraday Resistance 2: 51,944
Intraday Support Zone: 51,500 - 51,600
Intraday Support 1: 51,500
Intraday Support 2: 51,100
🔍 Bank Nifty Options to Watch (June 26):
Call Option: 51,900 CE
Put Option: 51,500 PE
Remember to adapt your trading strategy based on these levels and scenarios. Happy trading! 🚀📊
#tradenxt
#bankniftyanalysis
#bankniftylivetrading
#livetrading
#stockmarketanalysis
#stockmarketanalysis24june2024
#IntradayTrading
#IntradayCalls
#BankniftyPredictions
#StockMarketPredictions
#bankniftytomorrowprediction
#niftyanalysis
#niftypredictions
#bankniftyoptions
#niftyoptions
#banknifty51900ce
#banknifty51800ce
#banknifty51500pe

Alert! ENSUSDT on the Verge of a Major Bullish Breakout? Yello, Paradisers! Are we about to witness a significant bullish move in ENSUSDT? Let's dive in and find out.
💎ENSUSDT has formed an inverse head and shoulders pattern, which significantly increases the probability of a bullish move. By zooming in, we can see that both the higher time frame (HTF) and lower time frame (LTF) are showing a bullish market structure, adding weight to the bullish scenario.
💎For confirmation, we need a breakout and a candle closing above the resistance zone. However, be aware that this area contains external range liquidity (ERL), which means we need a proper bullish breakout or we must proceed with caution.
💎If the price pulls back, we can expect a bounce from the bullish order block (OB), which is also supported by an Inversion. We need an I-CHoCH (Internal Change of Character) here to capture the potential bounce.
💎However, if the candles close below the bullish OB, which is considered the low of the right shoulder, it will invalidate our entire idea and pattern. In this case, it is better to avoid trading and wait for proper price action to form for a clear signal.
🎖Strive for consistency, not quick profits. Treat the market as a businessman, not as a gambler. This is the only way you will make it far in your crypto trading journey. Be a PRO.
MyCryptoParadise
iFeel the success🌴
