BCH Could 10x in the Next Bull Run — But Not YetBCH Could 10x in the Next Bull Run — But Not Yet
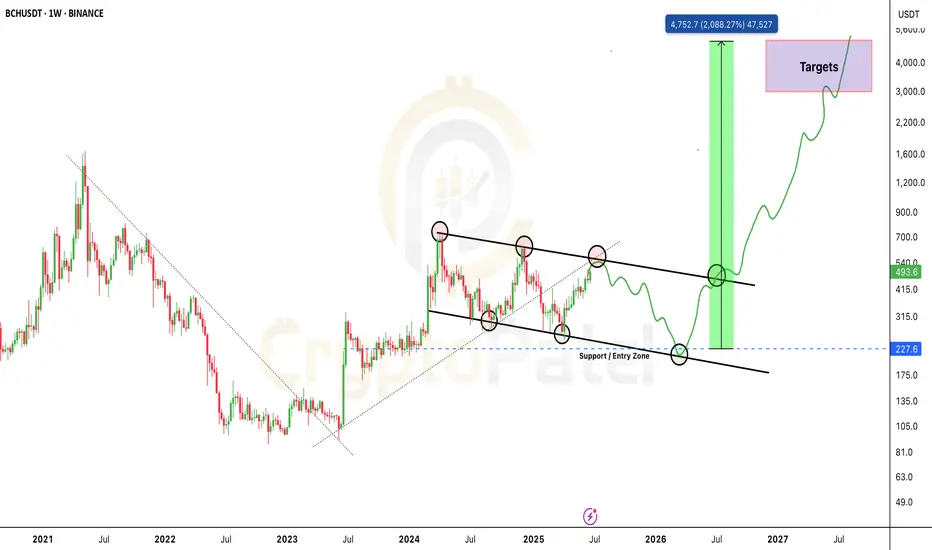
Bitcoin Cash is still trading inside a big falling channel.
Every time price hits the lower zone at Bull Flag, it bounces back up — this is the strong Support / Entry Zone.
Right now, BCH is near the upper Trendline Resistance (~$550-$580).
But IMO, we could see one more retracement before the next big bull run. I’m expecting price to revisit the $250–$210 zone before the next leg up.
However, if BCH breaks and holds above $640, that would confirm a bull flag breakout — turning the structure fully bullish with potential long-term targets between $1,800 – $4,000+ by 2026–2027.
Stay alert. The setup is big — but timing is key.
Note: NFA & DYOR
Search in ideas for "bch"

BCH/USDT Falling Wedge-BCH Falling Wedge pattern completed.
- Waiting for a clear breakout on 4 HR chart and target 0.618-0.786 FIB Level.
- Be careful with the fakeout.

BCH/USDT — The Final Dip Before a 10x Move?Weekly Chart Analysis | Long-Term Setup
BCH is forming a powerful macro structure that could lead to a massive breakout.
🔹 Descending Channel Structure
The price has been respecting a clean descending channel since 2023.
Each rejection from the upper trendline has led to a higher low — showing clear accumulation.
🔹 Key Entry Zone: $220–$230
This zone has acted as major support multiple times.
If BCH revisits this level and holds again, it could trigger a major trend reversal.
🔹 Breakout Targets: $3,000–$5,000
If the breakout occurs as projected, BCH could rally into this zone in the coming bull cycle.
This would be a potential 10x+ opportunity from the bottom range.
Final Thoughts:
📌 This is not a short-term play.
📌 It’s a macro setup for serious investors and position traders.
📌 The structure mirrors historical accumulation zones seen before massive moves.
💬 What’s your take on BCH long-term?
Comment below and share your chart if you’re tracking it too 👇
BCH/USDT: A Comprehensive Outlook for Traders and Investors
In this technical analysis, we delve into the BCH/USDT trading pair to identify potential trading opportunities for both aggressive players and long-term investors.
1. Resistance Area - 250-257:
The BCH/USDT pair encounters a robust resistance zone between 250 and 257. Historical data indicates that price movements tend to stall or experience pullbacks around this level. Traders should approach long positions with caution, as the price may struggle to break through this barrier in the short term.
2. Aggressive Shorting Opportunity at 235-240:
For aggressive players, shorting opportunities arise at the current price levels of 235-240. As the price approaches the upper range of the resistance area, bearish sentiment could intensify, leading to potential short-term declines.
3. Expected Correction to 195-200 Levels:
Our analysis suggests an impending corrective phase for BCH/USDT, with the price likely to correct towards the support levels of 195-200.
4. Favorable Buying Area - 140-150 Levels:
A compelling buying opportunity emerges at the 140-150 support range. Long-term investors seeking to build positions in BCH may find this area advantageous for accumulating assets.
Remember to adopt prudent risk management strategies to maximize gains and mitigate potential losses. Stay informed, and happy trading!

BCH Pumped 107% in 10 Days #BitcoinCash Pumped 107% in 10 Days
➡️ Bullish Pennant Breakout
➡️ Breakout + Retest
➡️ Perfect Target as per Chart Pattern
CRYPTOCAP:BCH

bch usdt perputal trade daily chart bchtoday i analysis bch ust for binance perputal trade
buy @ 432$ and selling target is 584$ predict basic on trend line and fibinaci tool and moving average ribbons and rsi indicator, wait and i got profit i am so much happy, i am bigginer of crypto try to improve my skill although any correction please comment its so helpful for me in future analysis
thanks and regards

BCH Great Risk Reward Trade 15Septmber2025Hi Folks,
Technically BCH is Strong and ready for upward move!
My indicator has given a good entry and price is still in range so I have entered. Will post trade result in comments section later!
Stay Tuned

BCH: We might see a rebound from there.🚀💎 Paradisers, #BCH is currently experiencing panic selling, and I am expecting a potential breakdown of the supportive trendline to gather liquidity for an upward trend.
💎If #BCHUSDT breaks below the trendline and exhibits a Change of Character (CHoCH) and Break of Structure (BOS) from the bullish Order Block (OB), which coincides with the Fibonacci 0.618 level, we might see a rebound from this point.
💎However, if the price falls below this level, it would typically be considered bearish. In this scenario, I would recommend not focusing on this move.

BCH (Bitcoin Cash) Update !!!BCH has been lagging behind BTC, the second attempt to resistance didn't show the same enthusiasm as BTC.
BCH with death cross (100 MA and 50 MA) as bearish as BTC but with less momentum then BTC.
We recommend sell of BCH at 1190 level with long term target of 500.
BShort

bch long timebch chart update most possibility bounce back from 1 no. support
also bch make spining top candel in 1 week chart frame.
BShort


BCH/USDBCH/USD(Bitstamp)
As mentioned in the previous article last week, Bitcoincash has been under correction(dropping) and it dropped further 20%+ since last week.
Bullish Case:
After surging 200%+ in the mid of December, It has dropped 50% at the time of writing.Though such drop is usual after such price surge but it need to holds $123-$109 price level to continue bullish momentum.Bullish confirmation will be when it breaks $220+ level in the coming days/weeks with a target around $350+ price level
Bearish Case:
If it doesn't hold the $123-$109 then it will slightly bearish for the asset and we might see the price fall below $100 in the coming days/weeks.

BCH Technical AnalysisBCH Price line has been remain in Gann Angle below 1/1 Gann line for last three weeks and now it is stable above 600$.
If this price can be maintained till 10th April, it will get good raise in price after crossing over 1/1 Gann Line.
BLong

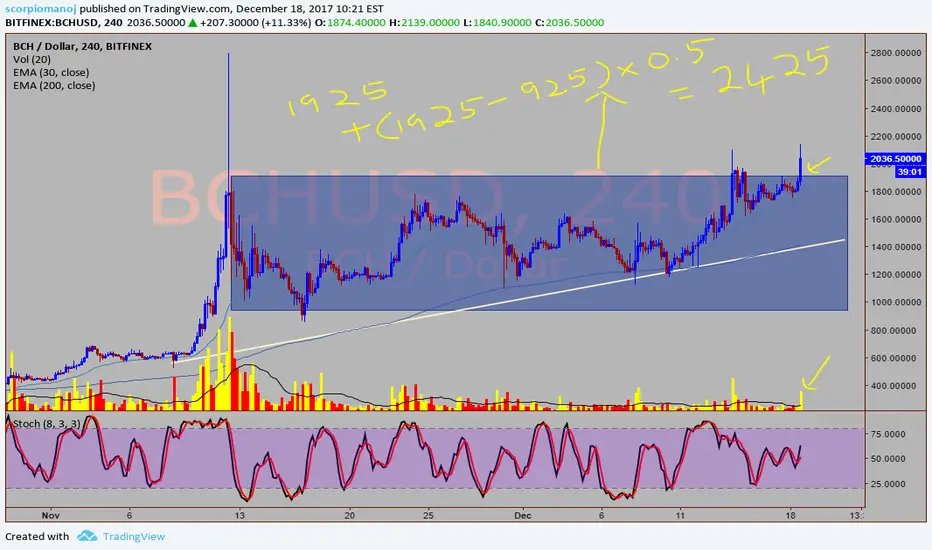
BCH/USD - will reward if held patientlyBCH/USD
Target 2425 plus
Nice rectangular breakout observed in 4 hour chart
A powerful bullish pattern as breakout accompanied with volumes.
BLong
BCH/USD - Triple bottom bullish patternBCH / USD
cmp 1789
target 2500+
stop 1500.
1) Nice triple bottom setup.
2) Price has broken multiperiod high spanning since inception for the first time with good volumes.
3) Post breakout price has retraced to previous resistance which should ideally act as a support
BLong


BCH / USD Price Analysis: Staging RecoveryBitcoin Cash / USD Short-term price analysis
BCH has a neutral short-term trading bias, with the BCH / USD pair now testing towards its 200-period moving average on the four-hour time frame.
The four-hour time frame is currently showing that the BCH / USD pair is attempting to recover from early week losses, while any presence of bullish MACD price divergence has now been eradicated.
Technical indicators on the four-hour time frame are bullish and continue to signal further near-term upside.
Pattern Watch
Traders should note that a bullish inverted head and shoulders pattern could start to take shape on the four-hour time frame if the recent recovery gathers pace.
Relative Strength Index
The RSI indicator on the four-hour time frame has turned bullish and has scope to move even higher.
MACD Indicator
The MACD indicator on the four-hour time frame is bullish, with the MACD signal line issuing a buy signal.
Fundamental Analysis
BCH has been surging over the past several days. This may be explained by the project’s expected launch of Schnorr Signatures, which should improve on-chain security and privacy.
Bitcoin Cash / USD Medium-term price analysis
BCH has a bullish medium-term trading outlook, with the BCH / USD pair still trading well above its 200-day moving average.
The daily time frame highlights that major technical support held firm during the recent decline in the BCH / USD pair, with the neckline of the inverted head and shoulders pattern acting as critical technical support.
Technical indicators on the daily time frame are currently mixed and providing no clear trading signal.
BCH / USD Daily Chart by TradingView
Pattern Watch
The daily time frame shows that a bearish head and shoulders pattern could start to take shape if the BCH / USD pair comes under further downside pressure.
Relative Strength Index
The RSI indicator on the daily time frame is currently neutral.
MACD Indicator
The MACD indicator on the daily time frame is neutral, with both the MACD signal line and the MACD histogram failing to generate a clear trading signal.
Fundamental Analysis
The medium-term prospects for BCH remain highly speculative. The project still lacks mainstream adoption, especially when compared to big names like Bitcoin.
Conclusion
BCH has staged an impressive upside recovery after coming under heavy technical pressure towards critical technical support.
Buyers now need to build on the bullish momentum and move price back above the BCH / USD pair’s 200-period average on the four-hour time frame.

BCH trades at the resistance that turned to supportOn the daily chart, the price shows that the price has traded in a range of $90 to $300 for more than 626 days. On March 3rd, the price breached the $320 supply level and moved out of the range towards the peak of $689 by forming a proper pullback by April 6th.
Thereon, due to instability in price, the BCH started to dip due to bears' control and instability at that level, as the presence of long-term trendline resistance was a string, which pushed it below $422 support.
After reaching the support, the price started consolidating in a range and broke further below by June 18th, 2024. After a constant consumption at $380 for a few days, by July 1st, 2024, the notice of Mt Gox exchange led its price to slide further below, in the consecutive response with BTC.
At press time, the BCH trades at the resistance that turned to support, where buyers are trying hard to sustain, but if it fails, the BCH would be back in the range of $90 to $300, which it spent a lot of time in history.
Therefore, based on the bearish trend daily, if this $315 support gets breached massively, the next support could be at $249, a $213. While, in case of resurgence, the resistance would pose interruptions around $362 and $422.
The Indicators are bearish, where MACD shows a bearish cross, and RSI at 26 is oversold.

BCHUSD - The Squeeze is Tightening. Decision Imminent?BCH is providing a textbook example of Price Compression on the 4H timeframe.
When price gets squeezed between a rising trendline and horizontal levels, volatility usually follows. Currently, BCH is testing the validity of the trendline support.
Key Levels to Watch:
Support Defense: The bulls need to hold the $558 level to maintain the uptrend structure.
Invalidation: A breakdown of this trendline changes the market character from accumulation to potential distribution .
Trading Plan: Watch for volume on the reaction. A low-volume bounce might be a trap, while a high-volume rejection of the trendline confirms weakness.
Trade safe and manage your risk!

BCH making bullish strong candle after breaking the triangle patBitcoin cash (BCH) gave a positive breakout after breaching its 20-Day Moving Averages of $430. After a sharp correction from the higher level of $630 formed a descending triangle pattern and slipped below the 20-Day Moving Averages (DMA). However, it successfully holds the major moving averages of $100 and 200-DMA. Support on the chart is situated at $375 and $340. Meanwhile, on the higher side, the resistance is placed at $480 and $540. Likewise, the strong hurdle is at $630, which can be acting in upcoming trading sessions. The levels can be expected after clearing the resistances are $750 and $880 positions.
themarketperiodical.com

BCH Making Comeback From Bearish RegimeBitcoin cash
performed a positive momentum on Thursday’s trading session
Bitcoin cash price is $395.93, which is down by 0.53% in last 24 hour time-frame and 14.91% down from the previous week
BCH/BTC pair is positive with a gain of 0.97% in Thursday’s trading session (0.012554)
