Bitcoin bybit chart analysis January 18
Hello
It's a Bitcoin guide.
I'm posting an analysis after a long time because of circumstances.
I prepared hard.
I hope this helps you when trading.
This is a one-way long position strategy on the Bitcoin 30-minute chart.
If you are not already entry
If you touch the red resistance line first, it would be nice to hold the stop loss and try the opposite trade.
Light blue finger movement path
*20639.5 long position entry section / stop loss when the purple support line completely breaks -> 21780 target
There is a Nasdaq index announcement at 10:30, so refer to it.
Within the red resistance/purple support line
Because of the high probability of
Waiting in the next position seems more advantageous than chasing.
Based on the maintenance of the purple support line, the job alt movement on the spot exchange will also look good.
My analysis is for reference only.
I hope you operate safely with principle trading / stop loss essential
thank you.
Search in ideas for "bitcoin"

Bitcoin Bybit Bone Analysis July 5th
July 5th Bitcoin Bybit Bone Analysis.
Hello
It's a Bitcoin guide.
For a moment to check movement and pattern
This analysis will be paused for a while, and we will share it first.
As announced in the morning, this is a bone analysis.
Korean users, there is still time left today
Thank you for brightening up my channel with useless comments.

(Lunar New Year Special) Bitcoin Bybit chart analysis january 24Hello
It's a Bitcoinguide.
If you have a "follower"
You can receive comment notifications on real-time travel routes and major sections.
If my analysis is helpful,
Please would like one booster button at the bottom.
Bitcoin 4-hour chart
This is the main drawing section.
It seems to have taken about 2 and a half hours just to draw it.
The section where the flag is marked is the section where the daily chart is created,
and the last flag is January 31st, when the holiday ends.
This week, there has been absurd and bizarre repetition of
unasked rises and unasked falls.
The reason is that after the report was updated,
as I explained in detail in the last video,
it is right before the bitcoin price skyrockets.
Based on the Bollinger Band weekly chart, it is important to see whether the resistance line is touched first
(a major rise)
and whether the MACD dead cross on the weekly chart
will occur first,
and adjustments and sideways movements will occur.
Based on that, if you look at the high and low points on the right,
I have indicated the prices.
At the very top, 117,182 dollars touches the weekly chart resistance line,
moving towards a mid-term upward trend
If 99,703 dollars at the bottom is broken first,
it will be the place where the weekly candle low is broken.
It would be bad if the two light-colored sky-blue support lines I drew were broken.
Because it is the place where the sideways movement and support line are broken,
I calculated the main section, so
I think it would be good to refer to it.
This is a 30-minute chart of Tether Dominance moving in the opposite direction of the beat.
Today, in terms of the pattern,
it touched the 5-minute and 15-minute resistance lines,
and the 30-minute chart resistance line section order.
I carried out a short position strategy in the sky blue finger section/strong downward section.
In the case of Tether Dominance,
the 6-hour chart and 12-hour chart MACD dead cross are currently in progress.
I applied it to Bitcoin as is.
Here is the Bitcoin 30-minute chart.
There is a Nasdaq indicator announcement at 12 o'clock tonight.
The Nasdaq is in the process of a 6-hour MACD dead cross,
and I judged that this section is not very dangerous.
The short-term pattern is still alive,
and the MACD golden cross is imprinted on the weekly chart,
and even if there is a strong adjustment in Nasdaq,
since the 1+4 rising pattern is waiting,
I focused on the rise and proceeded with the strategy.
*One-way long position strategy when the red finger moves
1. $104,740 long position entry section / stop loss price when the green support line is broken
2. $109,231.5 long position 1st target -> target price in order from the top
Based on the Tether dominance movement and the Bitcoin pattern,
I focused on the rebound from the 30+1 pattern.
Up to the first section, it is a sideways movement, and from the top section, it is a new record, and if it reaches this point, it will continue to rise significantly.
In preparation for a strong adjustment in Nasdaq,
I maintained the stop loss price for the 30-minute support + 1-hour support of the second section, which is marked as the final long position waiting section.
If it touches the bottom section today,
It is not good because the daily chart low is broken.
If it falls to 101.4K at the very bottom,
Pay attention to the 6+12 pattern that was not recovered yesterday.
Basically, if it comes down to this section,
It is not good because the center line of the 12-hour Bollinger Band chart has been touched several times,
and the support line of the 6-hour chart is also open.
Please refer to the final support line explained at the mid-term point at the top.
Today, I explained it in detail for the first time in a while,
and I did my best to analyze a week's worth,
I hope it was helpful for your actual trading.
Up to this point, I ask that you simply use my analysis for reference and use only
and I hope that you operate safely with principle trading and stop loss prices.
Since it's a long holiday,
don't just look at the charts,
and I hope all my followers have a good time with their families next week on Lunar New Year.
Happy New Year.
Thank you always.

(Spicy) Bitcoin Bybit chart analysis january 8Hello
It's a Bitcoinguide.
If you have a "follower"
You can receive comment notifications on real-time travel routes and major sections.
If my analysis is helpful,
Please would like one booster button at the bottom.
This is the NASDAQ 30-minute chart.
This is the movement after the analysis article was written.
During the blue finger short->long switching strategy,
it did not rise to the short entry point,
but reached the green support line in the 2nd section in the 1st vertical decline section.
After that, as I explained,
watch the movement from the bottom to the 3rd section.
This is the daily chart of Tether Dominance.
If it is normal,
It is impossible to break through the Bollinger Band resistance line, center line, and support line at once with one candle
But since it is forcibly coupled to the Nasdaq movement,
Please watch the detailed movement.
If it is normal,
Since only one daily candle is created per day,
Until 9 AM tomorrow,
Since Tether Dominance is attempting to break through the center line with one daily chart candle,
There should be an adjustment at the current location or the next wave.
Because,
As explained above,
In the case of ignoring the Bollinger Band center line with one daily chart candle,
and reaching the resistance line at once,
It is a movement that occurs only once or twice a year.
This is the Bitcoin 30-minute chart.
During the analysis, the Nasdaq vertical decline is in progress,
and it is breaking the major drawing section in real time,
so we will proceed without changing the strategy.
Currently, the daily chart MACD dead cross is in progress for 12 hours,
and unlike Nasdaq, there is still some room until the weekly chart MACD dead cross.
Instead, Bitcoin created a daily chart today,
and touched the support line first, so the downside is open,
so it can fall strongly if it breaks away.
The Nasdaq indicator will be announced at 10:30 in a little while.
*When the blue finger moves,
it is a short position strategy
short->long->short switching strategy.
1. $96,446 short position entry section / stop loss price when red resistance line is broken
2. $94,410.5 long position switching / stop loss price when green support line is broken or section 2 is touched
3. $96,935 short position switching / stop loss price when light blue resistance line is broken
After that, while maintaining short position,
the final long switching strategy was to check MACD main signals and support lines.
As you can see, it is being adjusted without the most basic short position entry point due to forced coupling with Nasdaq.
In order for a vertical decline to occur,
at least section 1 at the top -> 15-minute resistance that has not been touched even once today + 30-minute central line
should be touched, but it is just falling.
The reason why section 1 and section 2 at the bottom are marked
is because of the connection.
If there is a miraculous rebound from the current position,
The blue finger movement path is valid.
Since it is falling without touching the first section from the current position,
the second section may be dangerous,
and the bottom is where the Bollinger Band 12-hour chart support line + daily support line meet,
and the point indicated up to 91.4K is the mid-term upward trend line.
If you can somehow hold this point,
you can take a breather from the long position.
If the MACD dead cross pressure on the weekly chart progresses,
it may continue to shake up and down or repeat adjustments for several weeks rather than rebounding.
Please use my analysis so far for reference and use only,
and I hope you operate safely with principle trading and stop loss prices.
Thank you.

(Spicy) Bitcoin Bybit chart analysis December 12Hello
It's a Bitcoinguide.
If you have a "follower"
You can receive comment notifications on real-time travel routes and major sections.
If my analysis is helpful,
Please would like one booster button at the bottom.
Above is the Nasdaq 30-minute chart.
There will be an indicator announcement at 10:30 shortly.
*Red finger long position strategy.
The Nasdaq has touched the 30-minute resistance line,
but the 2-hour chart MACD dead cross is in progress,
so I judge that a vertical rise is difficult.
Since it is breaking out of the 30+1 section,
the short-term pattern is breaking a little bit,
but I followed the trend for a strong rise.
As a risk factor,
there is a possibility of being swept away if the orange resistance line above No. 1 is broken, so you should be careful.
Also, since there was no reversal after the vertical rise in CPI yesterday,
an adjustment may come right away, so please take note.
If we just maintain the green support line today,
and move sideways, Bitcoin will be free.
This is the 30-minute Tether Dominance chart.
Since the downward trend is open due to yesterday's movement,
and Bitcoin is in an upward trend,
I tried to enter the short position operation method in reverse.
If it fails to break through the pink resistance line,
it will be a vertical decline,
but if you look at the candle shape on the left,
since a full candle is in place,
the short position entry point is at 3.96%
It is roughly the 30-minute resistance line + the 1-hour chart resistance line.
Since the topmost point is a textbook-like position for a 3.99% short position,
if it fails to break through the red resistance line today,
it seems very likely to fall.
This is the Bitcoin 30-minute chart.
Nasdaq is renewing its all-time high,
but Bitcoin has not yet broken through its all-time high.
Therefore, the possibility of a sweep condition seems low,
and based on the Nasdaq strategy and the Tether Dominance short position entry point,
we proceeded with the strategy with a strong upward condition.
For reference, Bitcoin also touched the center line of the 1-hour Bollinger Band chart alone, so the short-term pattern is broken,
and the 2-hour MACD dead cross pressure is in progress,
so the vertical rise looks low.
Today, the 1+4 section looks dangerous,
and the match was decided at the middle point, the 30-minute support + 1-hour support line of the Bollinger Band pattern.
*Red finger movement path
One-way long position strategy
1. $99780.5 long position entry section / When the green support line is broken
Or when section 2 is touched, stop loss price
2. $103,718 long position 1st target -> Good 2nd target price
If the strategy is successful, section 1 is the long position operation section.
Since it can rise without adjustment,
It seems advantageous to re-enter the long position without operating a short position.
The stop loss price is
The green parallel line support line at the bottom -> sky blue autonomous depending on the remaining drawing.
Since there was no resistance line touch on the 30-minute chart today,
You should be careful because it can end as a slight adjustment or sideways movement in section 1 at the top.
The orange resistance line at the top and the sky blue support line at the bottom
are sideways movement sections.
Section 2 is a textbook short position <-> BIT can be a long position entry point compared to Tether Dominance, which moves in the opposite direction.
If the green support line is maintained today,
it seems that there will be no problem in the upward trend,
and I have drawn the support line and checked the price from below Section 2.
And, I have been giving you a hint recently.
I explained that you don't need to worry too much about BIT movement.
I wonder if you had fun with minor altcoins in the Bitcoin rebound yesterday.
Depending on the movement today,
the sideways movement may continue,
so it would be good to aim for minor altcoins at the same time
until the red resistance line top section is broken -> the new high price is updated.
This was a very spicy hellfire analysis article.
I don't know if you liked it.
I am a person who does it if I have to. The quality can be adjusted as much as I can within my capabilities, so
Please refer to it,
and please use my analysis articles only for reference and use,
and I hope you operate safely with the principle of trading and stop loss.
Thank you always.

(Season end) Bybit Bitcoin Chart Analysis October 11
Hello.
“Make it simple, make profit”
It’s BitcoinGuide.
Don’t forget to
“Follow” me and press “Likes”.
If you "follow" press,
Only 30 Min chart ,
In real time, you can check major sections and move,
Real-time "update I dea" can be checked.
I will begin BTCUSD Bybit Bitcoin Chart Analysis for October 11.
This is the Nasdaq US100 30-minute chart.
I just finished the analysis in one go.
There are two movements for the jinban light.
# One rebounds to the right without adjustment
#Another one is a double bottom V rebound.
Currently, the pattern
Last week's chart touch (double bottom) was broken
There seems to be only one pair of floors.
At the bottom 10505.6
If it is not connected with a V rebound or an upward rebound without adjustment
It may continue to decline to the right until next August.
Please note
I decided to watch this season's game here.
Just follow the Nasdaq movement.
Bitcoin analysis is meaningless
Because you can keep doing it until the jingo light comes out.
It is a judgment made.
* This is a long-waiting strategy after a strong decline.
Long wait strategy at the bottom or
I only focused on short -> long finishing and V rebound.
indicated,
in the purple parallel line
If there is no movement, it is guaranteed
Strong rises and vertical rises were ignored.
This movement was substituted for Bitcoin as it is.
Bitcoin 30 minute chart.
The 4-hour chart construction section was omitted,
In the main section, you can see only the purple support line / green support line.
# Short entry position is coupled with Nasdaq,
It can come out suddenly.
From the orange resistance line to the bright sky blue resistance line we marked.
short entry section
# Those who are waiting or maintaining a long position
The 18541 section at the bottom is the long entry section and the stop-loss price.
Same as Nasdaq
This is a short -> long switching or long wait strategy.
The bright sky blue parallel line is the standard for the right-to-down sideways direction.
If there is no departure from the purple support line,
A strong rebound is possible.
The gap section at the top is the gap difference section that occurred on Monday.
1. 19376 $ short position entry section / Stop loss when breaking the bright sky blue resistance line
2. $18541 long position switching / Stop loss when the green support line is broken
I created a strategy by aligning the daily Bitcoin support line with the Nasdaq pair bottom.
As described above, there is no V rebound
Or after tomorrow, if there is no strong rebound
This is because the downtrend may continue until the next rebound occurs.
The season will end.
If the season ends today,
Tomorrow, I will leave the overall operation method of Jinban etc.
I took a personal break for 1-2 weeks
I will be back.
I had a lot of trouble today,
There seems to be no end like this, in the most probable section
The last match was held.
My analysis is for reference only.
Principle trading / Stop loss is essential, I hope that you operate safely.
thank you.

BTCUSD Bitcoin Chart Analysis April 5
Hello.
“Make it simple, make profit”
It’s BitcoinGuide.
Don’t forget to
“Follow” me and press “Likes”.
If you "follow" press,
Only 30 Min chart ,
In real time, you can check major sections and move,
Real-time "update I dea" can be checked.
I will begin BTCUSD Bybit Bitcoin Chart Analysis for April 5.
It is a move after the final finish.
The details are summarized in the comments at the bottom of the analysis on April 4th.
Black finger check for major sections
All the messy lines have been deleted.
The orange support line was damaged, but
Touching the 4-hour support line, a strong rebound succeeded!
The Up-ward side way move is finished.
At the bottom, the final long position entry section
Counting up to 45,770 long positions
After reaching the marked pink overshooting zone
That's roughly $1126.5 in revenue.
Because the sideway move was long in the middle,
The wave came out less than expected
I think I did a good job.
The daily chart MACD dead cross that has been going on since yesterday
How it goes is important.
From the recent seat to the occurrence of a full candle
I'll take a look at the whole
4 hour chart.
Today's approximate Top and Bottom prices are displayed.
So far, the pattern
The maximum ascent section is upward-sloping
/ Daily MACD Dead Cross is pressing
The Bottom line at the bottom has risen more than yesterday.
around the purple support line
Red up / light blue down movement path check
I made today's trading strategy.
Too late?
Sorry to keep you waiting.
It took me a long time to concentrate, wasting unnecessary emotions today.
A tight stop-loss strategy, long chase strategy.
Just because it's reckless doesn't mean it's a baseless strategy.
There are risk factors, so please read them carefully.
Basically an uptrend.
The BB daily dead cross that everyone is worried about is a strategy that ignores them.
No pattern has been broken yet and no support line touched for 30 minutes (strong uptrend condition)
2 touches of the resistance line for 4 hours, just before the uptrend
6-hour chart MACD goal , 12-hour chart candle above position,
From the current position to the low point of the Ilbong Candle -> Candle full, etc.
Side way moving, It is a sufficient condition to rise,
I bet a match.
* When the red arrow moves
long position strategy
It can go up less or go right and sideways.
Pay attention to the purple support line for today's maximum safety section.
Starting with the long position in the current entry section
Of course, we focus only on long positions according to the trend.
1) $46865.5 long position entry section / Stop loss price when the purple support line is broken
The final target will be 47838,
If this section is reached, the 12-hour chart will show a large trend.
You can ignore the broken pattern.
With further upside, the daily MACD dead cross may open upwards.
If today's overall breakout of the purple support line
Please be careful as you may be joking or running away.
Principle trading / Stop loss is essential, I hope you operate safely.
Thank you.

BTCUSD Bybit Bitcoin Chart Analysis July 7th
Hello,
“Make it simple, make profit”
It’s BitcoinGuide.
Don’t forget to
“Follow” me and press “Likes”.
I will begin BTCUSD Bybit Bitcoin Chart Analysis for July 7th .
At the top, it is a 30-minute chart created yesterday.
I checked the purple path in real time.
Vertical rise -> purple path
That's up to $300 in revenue.
Congratulations to the profitable people.
This is a daily chart.
In the meantime,
The resistance line section of the daily candle parallel line was reached.
For each section,
I checked the main section.
1. It is not good to BreakAway the red section.
2. Purple smile. It is the target target of the day and can be a safety zone.
3. Two pink smiles. It is a candle Weekendly parallel resistance .
There is still a long way to go.
Currently, in the main section, the width of the Bollinger band is narrow.
It is open up and down, so be careful.
I have made a Trading strategy with a focus on this part.
Today's trading strategy.
30-minute chart / One-way long position strategy.
Today, I wanted to make a perfect chart analysis.
Main section only, in summary,
*Check the blue movement path and long position entry section
(orange trend line Breakaway And
strategy failure if touch the pink line)
Changed to a sideways move strategy when Breakaway,
Check the red finger section at the bottom.
Thank you.

BTCUSD Bybit Bitcoin Chart Analysis june 24th
june 24th BTCUSD Bybit Bitcoin Chart Analysis
Hello,
“Make it simple, make profit”
It’s BitcoinGuide.
Don’t forget to
“Follow” me and press “Likes”.
I will begin BTCUSD Bybit Bitcoin Chart Analysis for june 24th .
This is a 30 minute chart created yesterday.
Without much movement, the sideway move finished.
At the bottom,
without leaving the "no expression" section,
Movement came out.
12 hour chart.
Today's support line
Because it is formed to some extent
There will be no crash immediately.
However, at the bottom, if you leave the "no" section
Not good
Contrary ,
When you touch the "Smile" section at the top,
The upward trend can be maintained.
This is an important seat.
Focusing on this part
I make a Trading strategy.
30 minute chart. neutral strategy.
Green parallel resistance wire,
On the red support line,
Triangular convergence was created.
Red support line deviated,
Before And After,
sideways strategy.
Check the blue route and each major section.
If Red Parallel Support line Break Away ,
Please focus on the red finger at the bottom.
Good luck.
Thank you.

July 14 Bitcoin Bybit chart analysisHello
It's a Bitcoin Guide.
If you "follow"
You can receive real-time movement paths and comment notifications on major sections.
If my analysis was helpful,
Please click the booster button at the bottom.
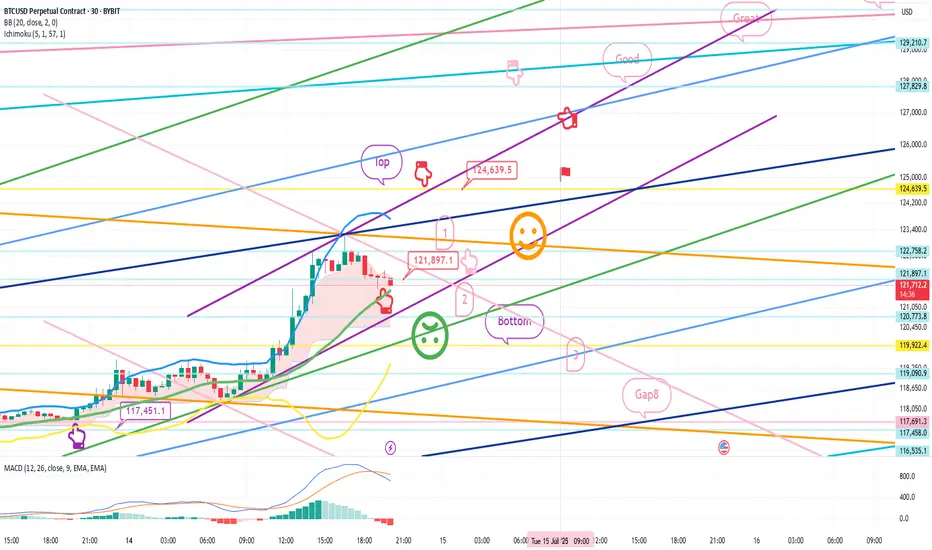
This is a Bitcoin 30-minute chart.
There is no separate Nasdaq indicator announcement.
Nasdaq upper gap reversal condition and
Bitcoin is moving sideways after a sharp rebound until the afternoon.
I created today's strategy based on the vertical decline condition based on the 5-minute trend reversal in Tether Dominance.
On the lower left, I connected the long position entry section of 117,451.1 dollars that I entered on the 11th.
* In the case of the red finger movement path,
This is a one-way long position
current position chase purchase strategy.
1. Chasing purchase at 121,897.1 dollars / Stop loss price when the green support line is broken
2. 124,639.5 dollars long position 1st target -> Good, Great in order of target price
Since I left a simulation in the middle,
I think it would be good to use it for re-entry after liquidating the long position.
The movement within the 1st section at the top and the 2nd section at the bottom
is an extreme sideways movement, and from a long position,
if it succeeds in rebounding within the 2nd section, it becomes a strong upward condition.
From the 3rd section breakout today,
the low point is broken in the newly created weekly and daily chart candles this week,
so please note that the upward trend may be delayed.
The next support line is the Gap8 section created last week.
Up to this point, I ask that you simply refer to and utilize my analysis
and I hope that you operate safely with principle trading and stop loss prices.
Thank you.
(Analysis process) original Bitcoin chart analysis July 11th
hello
Bitcoin guide.
July 11th analysis.
Originally I should have left it last Friday,
Because of the users who messed up, the activity has been suspended.
Today, it would be better to view it as a calculation section before uploading, not as a finished version.
Last week, I uploaded the analysis only partially due to unmanned comments.
Actually, all of this makes sense.
Have any of you noticed?
I never joked or joked with you.
1. Naked analysis (main price display)
2. Bone analysis (parallel line construction section)
3. Movement route analysis (waves and movement routes by time)
4. Top , Bottom (maximum and minimum values that can be raised for 24 hours a day)
It's a pity that the last and fourth analysis articles were treated privately.
Believe it or not,
I have always done my best in chart analysis over the past hour.
risked my life.
before proceeding with the analysis
About the movement of the day in general
Proceed with the calculation and draw all parallel lines that can occur from the monthly peak to the 30-minute peak
Classification by time period / pattern analysis + wave analysis / movement route and entry price, stop loss price, up to target price
From the top to the bottom that can occur in a day
I'm working on putting it all together in one 30-minute chart for your convenience.
Because the current analysis is not a complete version, it is a process for explanation.
Just look at how you analyze it like this.
Please watch it for fun.
We will see you with our normal activities starting tomorrow.
Before evaluating someone, think about whether you deserve it.
A place where many people refer to
Please think about it and leave a comment.
If you are so confident, show it in a chart instead of a comment.
I hope that you will be recognized by the public with the minimum qualifications.
If it's normal people, you should be grateful if I give you information.
If it's uncomfortable, don't watch it.
If I receive support, I will also work harder with gratitude.
I think it's normal.
Because it is unconditionally shut down for no reason
I'm serious on the persimmon daily chart.
thank you.

Bitcoin Looking For Short Opportunity Bitcoin Looking For Short Opportunity in 1H Time Frame
REASON: Multiple Rejection and Then Breakout, But It Didn't Sustain and Break the Support and Retested The Support.
Note: Also, Keep It Mind that trust no one makes your own analysis

Bitcoin Price Analysis Today on 17th AprilBitcoin today price analysis for today on 17th April is here. Bitcoin Technical Analysis & Price Prediction. If you like our analysis, support us...


BTCUSD Bybit Chart Analysis October 19
Hello ,
“Make it simple, make profit”
It’s BitcoinGuide.
Don’t forget to
“Follow” me and press “Likes”.
If you "follow" press,
Only 30 Min chart ,
In real time, you can check major sections and move,
Real-time "update I dea" can be checked.
I will begin BTCUSD Bybit Bitcoin Chart Analysis for October 19 th.
This is the movement after writing the analysis on October 18th.
It was a short -> long -> short -> long neutral strategy.
As the sideway move was longer than expected,
Short -> long switching
From first short to $60169.5 long switching
It is a profit section of about 4800 dollars round trip.
Congratulations to all who made a profit.
4 hour chart
The 12-hour MACD dead cross engraved form is the protagonist of the day.
Today's Approximate Top Price / Bottom Price Check
Smaller within the red resistance line / green support line convergence zone
The direction seems to be determined.
30 minute chart long position strategy
Today is a painful one-way.
12 hour chart MACD dead cross is being engraved
Probably until 9pm tonight when the additional bar is created.
If you go sideway move, it can be a difficult time for both long and short.
I put my weight on a dead cross that I'm not afraid
In preparation for a strong decline,
I put a purple finger in the bottom section
* When the light blue finger moves
long position strategy
Those who are able to hit single hit within the green/orange convergence section indicated
I think it would be good to use the short -> long switching section.
1) $61162 long position switching / Stop loss when the green support line is broken
$64860.5 Final Target / Tracking Stop Loss or Continue the Trend
I tried to convey it as easily as possible.
It looks simple too, right?
In the spot exchange, the green support line will be the life line.
If you go down near the bottom section
Because the uptrend is broken again in a big trend
Not good for long positions.
In the sideway move section, under the condition that it does not deviate from the green support line, proceed with ETC alt circulation pumping.
$61162 at the time of entering the long position
I think you can switch to Bitcoin + major altcoins.
The beat goes up first and then moves right and left
I have to take the major friends and then take care of the rest of the minor alts.
Beat is so crazy that he doesn't seem to take good care of his younger brothers.
Here's today's strategy.
If there are no variables or nothing special today, I will finish it without additional comments.
I have a lot of work going on these days.
I don't have time to look at the charts
For the time being, please forgive me
My analysis is a personal 100% delusion, so please refer to it only.
Don't forget to buy in principle / stop loss is essential
Fighting today
thank you

Bitcoin bybit chart analysis March 10
Hello
It's a Bitcoinguide.
If you have a "follower"
You can receive comment notifications on real-time travel routes and major sections.
If my analysis is helpful,
I would like one booster button at the bottom, please.
This is a one-way long position strategy on the 30-minute chart.
The vertical decline has progressed to some extent.
Today at 10:30, there are too many Nasdaq indicator announcements and branching points.
It is said that the indicator announcement at 10:30 is an important indicator with a name.
Please note.
To put it simply,
Bitcoin is best off not touching the green support line until next Monday.
It's because of the weekly chart candle.
The lowest true wave support line is ,
It would be nice to see it as the last line of support for Bitcoin.
So far, there is no justification for raising it.
The tone is thick, the signal is off
Because it touched the downside first based on the 30-minute chart
The downside is open and further declines are possible.
If, from today's breakout of the purple support line,
You need to prepare for the purple finger section at the bottom.
Gap2 retracement came out in the afternoon, and in preparation for the possibility of good news on the NASDAQ today
I focused on the arrow movement path.
*At the red arrow path
long position strategy
1. 19806.5 dollar long position / stop loss when breaking the green support line
20622 dollars 1st target -> 2nd target top price by the weekend -> 3rd target Great section
(Short-term traders can challenge both directions as much as they can.
My analysis is for reference only.
I hope you operate safely with principle trading / stop loss essential
thank you.

BitcoinBitcoin rising from $85,189 to $88,000 today implies an anticipated increase of about 3.3%. Given the current market conditions and recent price movements, such a rise is within the realm of possibility, though it would require a reversal of the current downward trend.
It's important to note that Bitcoin's price has experienced significant fluctuations recently. Following President Donald Trump's announcement of a U.S. strategic crypto reserve, Bitcoin's value surged by over 11%, reaching a high of $95,136. However, it remains below its record high of $109,135 achieved in January 2025.

Bitcoin Bybit chart analysis February 21Hello
It's a Bitcoinguide.
If you have a "follower"
You can receive comment notifications on real-time travel routes and major sections.
If my analysis is helpful,
Please would like one booster button at the bottom.
Here is the Bitcoin 30-minute chart.
Nasdaq indicators will be released at 12 o'clock shortly.
Nasdaq is moving sideways in the 6+12 pattern
From the Top section to the Good section at the top,
It is the resistance line of the Bollinger Band daily chart.
(Best short entry section)
I created today's strategy with the important conditions above.
* Conditional long position strategy when the red finger moves
1. 98,332.5 dollars long position entry section / cut-off price when the green support line breaks
2. 99,740 dollars Top section long position 1st target -> Good 2nd target
The target price at the top is important.
By 9 am tomorrow morning when an additional daily candle is created
If it reaches the Top-> Good section
After long profit taking, short position switching -> long position is autonomous
I think it would be good to look at the final 1+4 section.
(Currently, 1st section, around 97875.5 dollars)
After finishing today with an upward sideways movement
If it reaches the top section tomorrow,
You can continue to maintain a long position by modifying the stop loss price.
Refer to Great -> Miracle at the top.
This part is a strategy based on the shape of the resistance line on the daily chart.
If it deviates from the current position,
The bottom section becomes the 1+4 section
And then the 2nd section
Please check the shape of the support line on the daily Bollinger Band chart over the weekend.
Please use my analysis so far for reference and use only
Thank you for your hard work this week.
Thank you.

Bitcoin Bybit chart analysis September 4Hello
It's a Bitcoinguide.
If you have a "follower"
You can receive comment notifications on real-time travel routes and major sections.
If my analysis is helpful,
Please would like one booster button at the bottom.
This is the Bitcoin 30-minute chart.
There is a Nasdaq indicator announcement at 11 o'clock.
After coupling with Nasdaq, the candle's lower tail rebounded,
and it is moving sideways in an ambiguous position.
Based on the time zone wave, the 15-minute wave is in progress.
The 15-minute candle support line has been touched,
but the 15-minute candle resistance line has not been touched yet,
and the rising pattern has been applied to Tether Dominance.
In the case of Nasdaq and Bitcoin, it is falling strongly,
and there is no place to go short except for a vertical decline,
so I created today's strategy based on the possibility of shaking in both directions.
* When the blue finger moves,
it is a two-way neutral
long->short->long switching strategy.
1. 56,195.5 dollars long position entry section / When the purple support line is completely broken
or when the 2nd section is touched, the stop loss price
2. 57,444 dollars long position 1st target price -> Top 2nd target price
Depending on the strength of the rebound,
maintain the stop loss price adjustment to the Top or proceed with the short->long switching of the blue finger
The final target price is the Top section,
and when touched, I will connect the strategy after tomorrow.
The 1st section at the top is the first short position operation section of the 30-minute chart resistance line.
The 2nd section at the bottom is a place where a double bottom can occur,
but in the case of Tether dominance moving in the opposite direction of the beat,
the upward trend can be connected when the previous high is broken,
so I do not particularly recommend it.
There are a total of 2 support lines remaining from the Bottom at the bottom
to the long-term downtrend,
so please refer to it.
Up to this point, I ask that you simply use my analysis for reference and use only.
I hope that you operate safely with principle trading and stop loss prices.
Thank you.

Bitcoin Bybit chart analysis May 16Hello
It's a Bitcoinguide.
If you have a "follower"
You can receive comment notifications on real-time travel routes and major sections.
If my analysis is helpful,
Please would like one booster button at the bottom.
Bitcoin 30-minute chart.
There is an indicator announcement at 9:30.
After first touching the lower Bollinger Band,
It's going sideways.
On the signal, before and after the MACD deadcross on the 2-hour chart
The position is a bit ambiguous.
Because it is a position with a high possibility of sideways movement.
Today, we will operate safely without greed.
*Red finger movement path
Long position strategy
1. $65,426 long position entry zone / stop loss when breaking out of the light blue support line
2. $67681.5 long position 1st target -> Good 2nd -> Great 3rd target
In the case of Tether dominance, depending on today's movements
The mid-term downward pattern may be broken.
The beat should be stronger than the top section.
It is possible to break the mid-term downward pattern.
If the purple support line is maintained,
Strong rising section
Section 1 is a section that traverses downward to the right.
If possible, within the green support line without touching this section.
It would be good if you protect it.
Please keep in mind that my analysis up to this point is merely for reference.
Please operate safely with principled trading and stop loss required.
thank you

Bitcoin Bybit Path Analysis July 6th
Hello
It's aBitcoin guide.
Today is a new movement route analysis.
15 minute chart.
When you spit it out, please twist it as much as you want,
Blame, forcefully, and curse.
Only on Korean channels,
There is still time left today
With useless agitation and dusting
Thank you for brightening up my channel.


Bitcoin Bitcoin triangular pattern is formed, probable breakout , one can enter before breakout, red horizontal line is stop loss for this trade setup.
