Search in ideas for "bitcoin"

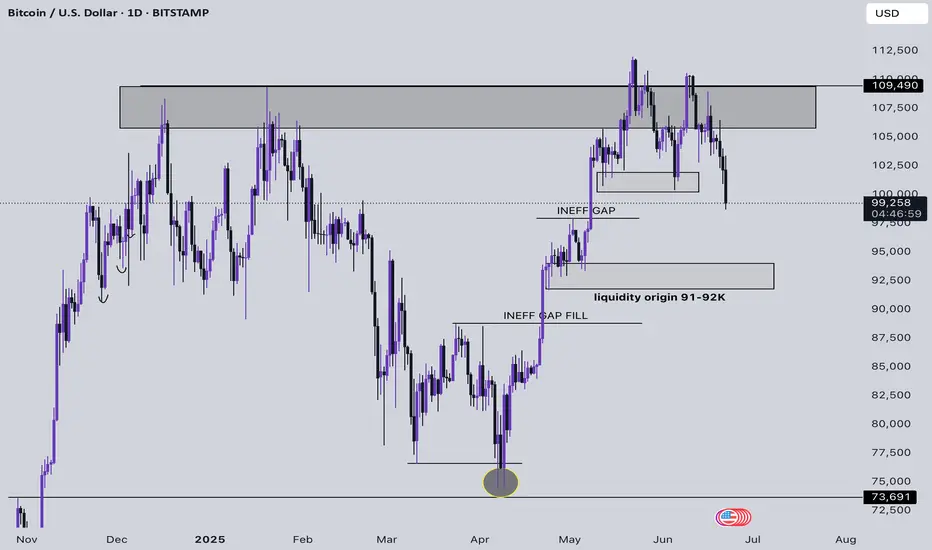
Bitcoin 1D Technical Analysis Bearish Bias- Bitcoin is currently trading at 99,453$, down almost 11% from its ATH
- Bitcoin trapped many buyers above 110,000$, and now they have become aggressive trapped sellers
- We have origin fill left and a large inefficient gap left for Bitcoin to fill at 88,765$ to flip bullish I will sit and wait for BTC to start a consolidation there, and then I will look for aggressive spot buys
- Avoid leverage at all cost, it makes no sense to lose money until the price behaviour of BTC settles We can see BTC repurging 73,000, it's in the playbook as well
- Market Structure shift in BTC is highly bearish unless we see a structure shift on a 4h or 1d TF
- Manage your risk and try to avoid leverage at all cost
Bitcoin Technical Analysis Bear/Bull Market- Bitcoin is currently trading at $74,452, down 32% from its ATH.
- Bitcoin is facing a significant sell-off along with major world indices due to the tariff war between the US and China and other powerhouses.
- This widespread selling will stabilize once it leads to the absorption of all bears, and eventually, we will see sideways action followed by an upward expansion.
- The important areas to monitor are the highlighted circles; the first one marks the origin of the move, while the second contains a fair value gap that has not yet been mitigated.
- From a Spot buyer perspective I would like to see either of the two paths playing out
- Manage risk until then
- Buying Zones: 60-63,000$ & 67,000-71,000$

Bitcoin - Buy for Target 90 KBitcoin is showing bullish pattern and right now taking support at key technical level from where its expected to move up for next target of 90K. view are shared well in advance or in quick mode before waiting for confirmation which will delay the chart and good move will be missed. Price should hold this current support area of 83600 to 83700 area and failing which this view will be cancelled. use this view for educational purpose or to take your own decision and this is not a financial advice. Market is big and like many i am also trying my best to predict the next price move and to share my view with others. Likes, comments are welcome. Thanks

Bitcoin Next Target 107,000 USD, Expected Trendline Breakout Bitcoin definitely going to reach the Trendline, so the Target is around 107,000 USD or more. And Expected Breakout above the Trendline.
I want to help People Make Profit all over the World.
My Bitcoin Navigation :
1. Reached 0.5 Fibonacci Retracement.
2. Breakout the Channel Pattern.
3. Reached Channel Top Target.

Bitcoin Swing Long Update - Bitcoin is currently trading at 62,777$
- Bitcoin followed my path and filled the Fair Value Gap
- Bitcoin didn't shift its Market Structure as well and we are still Bullish unless we see a weekly close below 57,500$
- Bitcoin can easily shoot up to 64,000$ first and then we might see a small retracement that can induce BTC a little and post that we might see Bitcoin mitigating 69,000$ soon
- On the other side, we have a War ongoing and the Economic Data also came in good for the US so the flows into USD increased and this also led to the DXY pumping hard
- However, at the same time US Indexes jumped as well so this week will be very important for the overall market and how the war unfolds.

Bitcoin Worst Case Scenario Setup Update - Bitcoin is currently trading at 53,442$
- Bitcoin followed my 1st path and the second path might be followed too
- Bitcoin has only been making lower lows and higher lows which signifies a bearish trend
- Overall Price trend is bearish we need a Market Structure shift above 62,000$ to flip the trend and get bullish again
- Be cautious and avoid leverage and adding longs and short for now before you see a clear trend
- Spot buying is fine but at the same time prefer to sit on hands

BITCOIN SHOWING RECTANGLE PATTERN BREAKOUT BEARISH SEPTEMBERBITCOIN SHOWING RECTANGLE PATTERN BREAKOUT
BEARISH MONGTH SEPTEMBER
In day timeframe chat a rectangular structure is showing on bitcoin
And it’s already breaked the rectangle support zone
So according to the data the current structure showing
The overall September market should must be bearish due to
Technical analysis
The fall should be a huge fall
It must be 13000 point fall due to
The support zone at 43.700
So invested and trader be ready a huge fall is going to occur soon in bitcoin

Bitcoin Worst Case Scenario Setup - Bitcoin is currently trading at 59000$ and we have the August monthly closing tomorrow
- Bitcoin has a Fair Value Gap ranging from 62,500-61,000$
- Bitcoin is currently chopping getting distributed and then showing small recoveries which has changed BTC's trend to bearish more HL HL followed with LL LL
- To flip the current trend we need a strong weekly closing above 67,000$ first
- I have drawn 2 bearish paths which happens to be best possible scenario for BTC, I am being practical and not blindly bullish over Bitcoin
- In trading, you have to consider a lot of uncertainties or else you get thrown out of the market so yes 51-54,000$ will be an important accumulation and longing zone for me to track BTC

BITCOIN SHOWING A GOOD UPWARD MOVE WITH 1:10 RISK REWARD BITCOIN SHOWING A GOOD UPWARD MOVE WITH 1:10 RISK REWARD
DUE TO THESE REASON
A. its following a rectangle pattern that stocked the market
which preventing the market to move any one direction now it trying to break the strong resistant lable
B. after the break of this rectangle it will boost the market potential for break
C. also its resisting from a strong neckline the neckline also got weeker ald the price is ready to break in the outer region
all of these reason are indicating the same thing its ready for breakout BREAKOUT trading are follws good risk reward
please dont use more than one percentage of your capitalfollow risk reward and tradeing rules
that will help you to to become a bettertrader
thank you

Bitcoin 4H Swing Setup - Bitcoin is now down 15% from its recent swing high
- I have drawn 2 Price Paths for Bitcoin
- The first price path describes how Bitcoin can soon run up clear the Fair Value Gap and then pierce 60k and bounce from 56-58,000$
- The second price path describes how Bitcoin can soon run down grab liquidity from 56-58k and then move up towards 64k
- Bitcoin is currently sitting in a no-trade zone even if you are looking for longs or shorts make sure your leveraged positions are carrying a calculated risk

BITCOIN SETUP TRADE WIH 1:20 RISK REWARD BITCOIN SETUP TRADE WIH 1:20 RISK REWARD
A good selling setup detected on BTCUSD
It's showing a BEAR MOVE due to these reason
1. It's following THE 60 M trendline here
2. It's ready to break the neckline
3. In day chat it's showing the heavy bullish pressure
Just grab out will your own risk
With a small amount
Stay connected
Stay happy
Bande mataram
BITCOIN SETUP TRADE WIH 1:20 RISK REWARD
A good selling setup detected on BTCUSD
It's showing a BEAR MOVE due to these reason
1. It's following THE 60 M trendline here
2. It's ready to break the neckline
3. In day chat it's showing the heavy bullish pressure
Just grab out will your own risk
With a small amount
Stay connected
Stay happy
Bande matara

BITCOIN SETUP TRADE WIH 1:10 RISK REWARDBITCOIN SETUP TRADE WIH 1:10 RISK REWARD
A good buying setup detected on BTCUSD
It's showing a BULL MOVE due to these reason
1. It's following THE 60 M trendline here
2. It's ready to break the neckline
3. In day chat it's showing the heavy bullish pressure
Just grab out will your own risk
With a small amount
Stay connected
Stay happy
Bande mataram
BITCOIN SETUP TRADE WIH 1:10 RISK REWARD
A good buying setup detected on BTCUSD
It's showing a BULL MOVE due to these reason
1. It's following THE 60 M trendline here
2. It's ready to break the neckline
3. In day chat it's showing the heavy bullish pressure
Just grab out will your own risk
With a small amount
Stay connected
Stay happy
Bande matara

BITCOIN SETUP TRADE WIH 1:10 RISK REWARDBITCOIN SETUP TRADE WIH 1:5 RISK REWARD
A good buying setup detected on BTCUSD
It's showing a BULL MOVE due to these reason
1. It's following THE 60 M trendline here
2. It's ready to break the neckline
3. In day chat it's showing the heavy bullish pressure
Just grab out will your own risk
With a small amount
Stay connected
Stay happy
Bande mataram
BITCOIN SETUP TRADE WIH 1:5 RISK REWARD
A good buying setup detected on BTCUSD
It's showing a BULL MOVE due to these reason
1. It's following THE 60 M trendline here
2. It's ready to break the neckline
3. In day chat it's showing the heavy bullish pressure
Just grab out will your own risk
With a small amount
Stay connected
Stay happy
Bande mataram

Bitcoin Technical Analysis Bitcoin appears to be bullish on a 4-hour timeframe.
However, it is still possible that there may be one or two liquidity grabs that could shake out more weak hands.
In general, I would like to see how the market reacts to the price at 69000$ before making any further decisions.
If you are interested in accumulating Bitcoin, I would suggest a 30% spot accumulation in this zone.
The remaining 70% can be kept when Bitcoin trades around 45,000-50,000$.

Bitcoin Update - Bitcoin is currently trading at a crucial support zone
- Bitcoin needs to hold this support of 65000-66000$
- If Bitcoin holds this we can again see it crossing 70,000$
- If Bitcoin breaks this 60-62,000$ will be my POI
- Every other Altcoin is currently trading near it's demand zone only and we are massively down in altcoins

Bitcoin Retracement Loading - Bitcoin is currently trading at 67,100$ not even 20% down from its All-Time High but Altcoins have already retraced more than 20-30%
- I have marked 2 Important Point of Interest and it may help you guys more from a reference perspective to exactly where how much more could Bitcoin fall
- 58,000-60,000 looks like a Magnet to me
- 52,000 looks like something that can make Bitcoin's next move the biggest impulsive move ever seen
- Do not invest Blindly if you don't understand the schematics and the risk involved in Crypto Currencies

BITCOIN CHART ANALYSISBitcoin gave a Biggest Range Breakout but sudden fallback also..,,so is this False Breakout or small retrecemnt and after this, Can we see a Big UP Rally????
KEEP AN EYE ON IT…..!!!!

Bitcoin respecting the trend line.Bitcoin has been respecting a trend line and is taking support from it.
The coin is trading around its 20 ema on 15 mint time frame.
Support will be the trend line. Let the price trade below the trend line or breaks above the level of 38810.
On daily time frame, it’s forming an inside candle.
Support :- 38100, 37700
Resistance:- 38810, 39270
Wait for price action near the levels for entry.


BITCOIN USD getting back into Asymmetrical Triangle Pattern!Bitcoin is showing real strength. MACD BULLISH crossover is happening too! back in its Triangle shows the BULLS are in charge now! Still see my previous BTC analysts for a caution warning about the whales sell zone! LIKE and FOLLOW if you agree.

Bitcoin Reject 2 Times Bitcoin Reject 2 Times on major Resistance of $11100 Level. Bitcoin might be $9700 in coming days. First Target is $10500 Second bearish target is $10100 and third bearish target is $9700.
Thanks & Regards
MyRocket7393

Bitcoin Inverted Head & Shoulders Setting Up? $4,309 26Aug17Bitcoin Inverted Head & Shoulders Setting Up? $4,309 26Aug17
Are we seeing a start of an Inverted Head & Shoulders?
Resistance remains at around $4,440 (potential neckline)
Expecting a pullback to at least $4,000 from there we will see...
Sean Vengan
Professional Cryptocurrency Trader and Trading Educator
