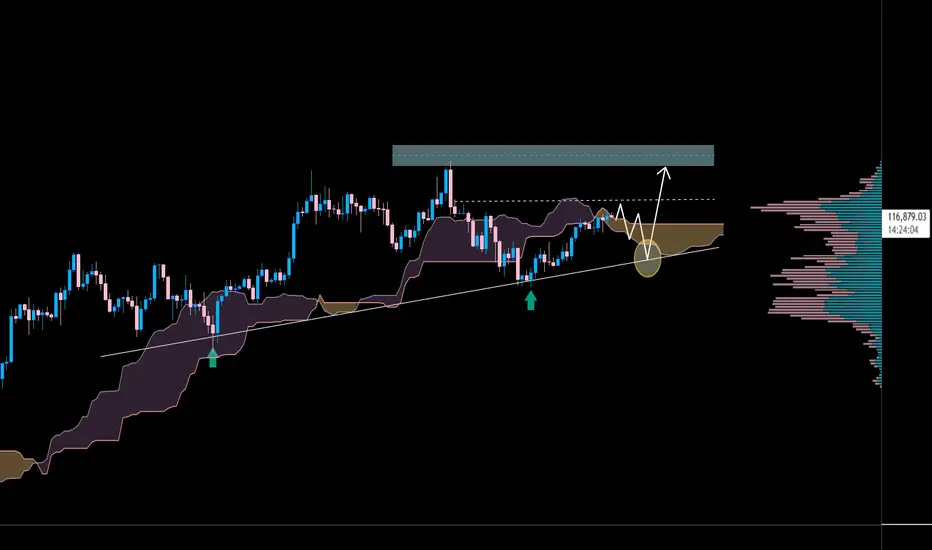
BTCUSD Trading Plan - 12/Jun/2022Hello Traders,
Hope you all are doing good!!
I expect BTCUSD to go UP if it corrects here.
Look for your BUY setups.
*This BUY is risky and I am biased only for short term upside, if you dont know how to manage your trade, dont take the risk now and wait for it to break the last low for HPB.
Please follow me and like if you agree or this idea helps you out in your trading plan.
Disclaimer: This is just an idea. Please do your own analysis before opening a position. Always use SL & proper risk management.
Market can evolve anytime, hence, always do your analysis and learn trade management before following any idea
Search in ideas for "btcusd"

DOUBLE TOP IN BTCUSD ! IS THIS IS THE HIGH OF BTCUSDBTCUSD in the monthly chart showing the double top
and now the question is that. is this is an indication of btcusd to fall down or it will break the pattern and go higher from the past record or is it going to shift more downward which no one expected! it will be a great time if it falls to take a bearish trade! we have to wait for the confirmation to enter in trade !

BTCUSD showing recovery signsBINANCE:BTCUSD has started showing some recovery after China's news. BTC had touched 30k levels twice in the last one month. Now I can see there is one immediate resistance visible at 41000 levels.

BTCUSD 4 hr Analysis. LongBitcoin is hot cake due to its current investments from Elon Musk which the firm confirmed 1.5 billion dollar investments in bitcoin.
Technicals
1) BTCUSD had formed cup and handle pattern on 4 hour and broken strong resistance .
2) Falling wedge on 1 hour chart
3) Currently has retraced to 0.23 fib levels
4) RSI is greater than 50 which indicates strong buying.
Action
Please wait for the 0.38 or 0.5 retracement levels(Profit booking can happen now) and plan for buying as we are in bull market. Never short in this markets.


BTCUSD Short I hope you can now see how BTCUSD represents an excellent low risk profit entry setup allowing you to trade in the market.Take positions so that the risk/reward is in your favor.
Knowing why, where & when a strong reversal signal is being generated will be the only way to capitalize on your technical analysis .
Disclaimer: It should not be assumed that the methods, techniques, or indicators presented in these chart will be profitable or that they will not result in losses. There is no assurance that the strategies and methods presented will be successful for you. Past results are not necessarily indicative of future results. You should not trade with money that you cannot afford to lose. Examples presented in these products are for educational purposes only and it should not be assumed that these are indicative of ordinary trades. These setups are not solicitations of any order to buy or sell. The publisher assume no responsibility for your trading results. There is a high degree of risk in trading.


“BTCUSD | Bullish Channel Intact – Eyes on the 6th High FormatioHello traders and investors 👋
Bitcoin continues to respect its bullish market structure, and the chart keeps telling a clear story — strength, patience, and consistency.
🔍 Market Overview
After months of consolidation, BTCUSD is once again showing signs of strong momentum inside the bullish ascending channel that started back in early 2023.
Every time Bitcoin has retested a previous breakout level, it has bounced with strength, confirming how powerful this current cycle is.
The market is currently hovering around 124,000 USD, showing solid demand every time price dips near the mid-level of the channel. This area is acting as a launch zone for potential continuation toward new highs.
📊 Technical Breakdown
Trend: Strongly bullish since 2023 — no structural break
Support levels:
115,000–118,000 USD: short-term support area
100,000 USD: key psychological and technical level
Resistance levels:
130,000–135,000 USD: short-term breakout zone
150,000 USD: next potential major target if breakout sustains
Price action has been forming a series of higher highs and higher lows, maintaining the perfect uptrend rhythm.
The previous highs are continuously flipping into new supports, which is a strong sign that the bull cycle remains intact.
📈 My Outlook
As long as Bitcoin trades above 120,000 USD, my bias stays bullish.
The structure supports another move toward the 130,000–135,000 USD zone, and if that level breaks with volume, we could see 150,000 USD next.
However, if BTC fails to hold above 115,000 USD, I’ll expect a short-term pullback toward 100,000 USD, which would still be a healthy correction inside the macro uptrend.
🧠 Market Sentiment
Momentum remains positive — the market still respects the bullish cycle.
Long-term holders aren’t showing signs of major distribution, and every dip continues to attract strong demand from both institutional and retail investors.
Until we see a confirmed break below the lower channel boundary, the path of least resistance remains upward.
💬 Final Thoughts
Bitcoin’s macro bull cycle is alive and well.
As long as we keep printing higher lows and holding key supports, the next leg could easily take BTC to new highs within this channel.
Stay patient, manage your risk, and remember — the trend is still your best friend. 🟢
⚡ Suggested Title
BTCUSD | Bullish Channel Holding Strong – Next Leg Toward 150K? 🚀

BTCUSDT Set to Explode: Strong Uptrend Ahead!Hello everyone, today we’ll analyze an exciting opportunity with BTCUSDT, evaluating its strong uptrend and the potential to reach new highs.
BTCUSDT is trading on a strong upward trendline , with support levels at 110,500 and a high target of 123,700. The chart shows a breakout from an important resistance zone, with the price also positioned above the Ichimoku cloud , reinforcing the bullish trend.
Capital inflows into Bitcoin ETFs and the Fed’s decision to cut interest rates have created a favorable environment for Bitcoin , making the possibility of reaching new highs even stronger.
With favorable technical signals and macroeconomic factors , BTCUSDT is likely to continue its strong upward movement. However, always check support levels to manage risk effectively.
Wishing you successful trading!
BTCUSDT - PLANNING (next two days)BTCUSDT - PLANNING
BTC is expected to follow the pattern shown in the chart, with a corrective pullback followed by an upward move. BTCUSDT will likely retrace to around the 106k level, where it may face another wave of decline. At this point, BTC will attempt to form a peak, but don’t expect a long-term rally just yet.
Action Plan:
For Long positions: Wait for the H1 timeframe to complete its pullback. After the correction, target the 103.8k region for entries (Note: For Long trades, don’t expect it to reach 106k if negative news emerges).
Priority: Hold Short positions at higher levels and add to Shorts when the price retraces to form a new H1 peak, as shown in the chart.
Strategy: Focus on Long Scalping first, then switch to Swing Short immediately after.

BTCUSD 8H: Trendline Pressure and Key Support Test🔥 BTCUSD 8H Deep Dive
1️⃣ Trendline Pressure: Bears controlling the market with a strong descending trendline.
2️⃣ Support Zone Strength: $77,500-$80,000 is a key demand area. Previous bounce shows buyers stepping in.
3️⃣ Liquidity Hunt? Price might sweep the support zone before reversal.
4️⃣ Volume Check Needed: Low volume = fakeout risk. High volume = potential breakout.
🎯 Targets
Bullish Breakout: $85,000-$87,500
Bearish Breakdown: $77,500-$75,000
📍 Eyes on next 8H close.

BTCUSDT NEXT MOVEBINANCE:BTCUSDT
BTCUSDT might sweep down side liquidity first to move upwards around 31000 again.
both side EQL & EQH formed .
BTC is waiting for the event to move one side

BTCUSDT PATTERNHello,
There is a positive mismatch in the BTCUSDT parity. Although the signals are weak on the MACD, I think the DMI indicator supports the RSI indicator when we look at the return areas.
This analysis is not an investment recommendation. I'm showing my own ideas.
--------------------------------------------------------------------------------------------------------------------------
Merhabalar,
BTCUSDT paritesinde bir pozitif uyumsuzluk söz konusu. MACD'de sinyaller zayıf olmasına rağma DMI indikatörü dönüş alanlarına baktığımızda RSI indikatörünü desteklediğini düşünüyorum.
Bu analiz bir yatırım tavsiyesi değildir. Kendi fikirlerimi göstermekteyim.


Btcusd Short opportunity INDEX:BTCUSD
Btc bleeding
Btc having Two strong supply Zone for shorting
First target pervious low
Second target - 14k

BTCUSDT Positional ViewWE are looking BTCUSDT Positional Sell towards Target Of 27000
Its purely Based On Cycles
It might Hit Before MAY end (Its just Expectation)
48000 Level We keep Stop Loss

BTCUSDT - Analysistoday i am sharing btcusdt analysis. i am prediciting first btc will go 32300 then it will go upto 62500 then it will come around 30k again and form a range and then it will follow the 95k target
thanks


BTCUSDT - A Bearish Market scenario of Cryptocurrency MarketThis is just an idea of BTCUSDT, If market fall again and where it will go next and where to enter ..
this is not a financial advise.. Do your own research before investing
This is an analysis of BTC in worst case scenario
1. We can see a divergence in 1D chart where price creating a LL and RSI is creating a HH
2. AB=CD patterns show market likely to reach 1st demand zone
3. major demand zone is a fresh zone and never retested
4. mini trend lines show a bearish market
If market get into a bearish momentum you can add some extra positions from the major demand zone i mentioned in the chart.
At this point we cant predict what happens next, But we can add some extra positions if market come to this levels with less risk reward ratio.
And another factor is human emotions. everyone is expecting a bull move and whales can manipulate market easily
do your own research before investing

BTCUSDT Short My IdeaBTCUSDT Short
R/R= 1:2
I'm just beginner, Ready to learn. If I do any mistake, Please guide me. thank you
