Dilip Buildcon Ltd forms Bottom Triangle/Wedge + Divergence
A Bottom Triangle/wedge shows two converging trendlines as prices reach lower highs and higher lows.
The price breaks above the upper trendline with a noticeable increase in volume, confirming this bullish pattern as a reversal of the prior downtrend.
There is divergence seen Price vs RSI and Price Vs MACD .
PLEASE NOTE THAT:
This chart analysis is only for reference purpose.
This is not buying or selling recommendations.
I am not SEBI registered.
Please consult your financial advisor before taking any trade
Search in ideas for "divergence"

Medplus Bullish Divergence seenMedplus Bullish Divergence seen on daily tf
positional view will be for 900 from 813 above with
risk reward ratio of 2.08
dc : only for educational purpose

How to trade using RSI Divergence?To identify any divergence, first of all look at the current structure that the price is forming like the above case, Bharti Airtel is forming lower lows clearly and when we look at RSI it is forming up Higher lows.
Therefore RSI contradicts the price and this tells us that RSI doesn't support what the price is doing so it's a bullish RSI Divergence. RSI here is not in line with the price so we will be adhering to what the RSI is doing.
For taking entry, we would wait for the price to break first lower low that indicates that price is now ready to bounce back and we will enter by keeping previous low as Stop Loss.
This is an example of Bullish RSI divergence.
Now for spotting Bearish RSI divergence the price must be forming higher highs whereas the RSI will be forming Lower highs which is an early signal that price is going against the RSI and hence we will short here.
That's how RSI divergence works, hope I made it simple!
Happy Trading!

Sail- bullish divergenceSail has bullish divergenceon 2hr TF with a major support at 56 currently in weekly demand zone...

AUDUSD rebounds within falling wedge supported by +divergence AUDUSD has rebounded from the falling wedge pattern in which it has been moving from past one year. The bounce was supported by the positive divergence between the price and RSI indicated by blue lines. The upwards thrust can bring the prices to 0.68676. The stop loss for the entire trade will be at 0.66582.

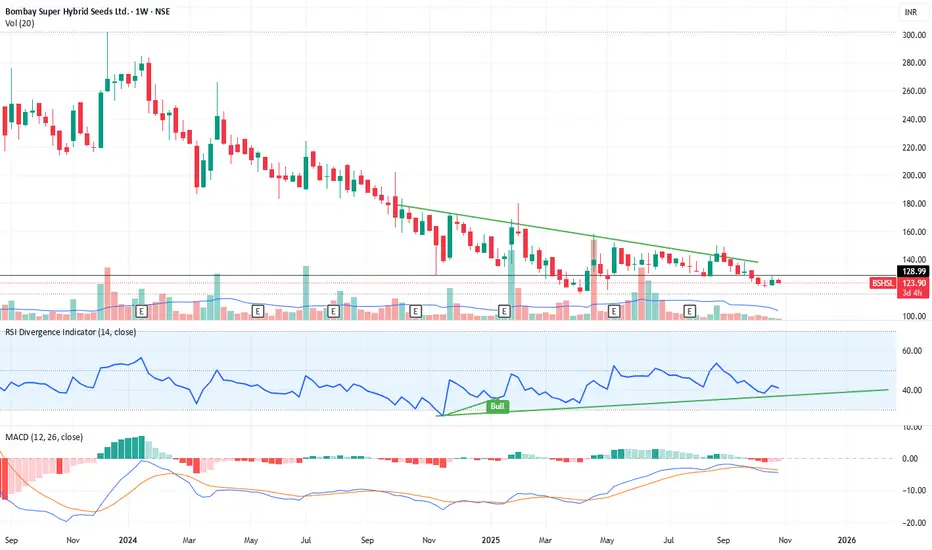
Bullish RSI Divergence & Potential Trend Reversal ( BSHSL )💡 Strategy Description (Study Idea):
This study highlights a bullish reversal setup developing on the weekly timeframe for Bombay Super Hybrid Seeds Ltd (NSE).
The stock has been in a prolonged downtrend, forming lower highs under a descending trendline, but momentum indicators suggest a possible bottoming phase.
Key Observations:
RSI Bullish Divergence:
Price is making lower lows while RSI is forming higher lows — indicating weakening selling pressure.
RSI is currently near the 40 zone, suggesting limited downside risk and potential for an upward move.
MACD Convergence:
The MACD histogram shows fading bearish momentum.
A bullish crossover between the MACD and signal line could confirm a reversal.
Trendline Resistance Zone:
The descending resistance line lies around ₹135–₹140.
A breakout and close above this zone on strong volume may trigger a trend reversal.
Volume Behavior:
Gradual accumulation observed at lower levels.
A volume spike during breakout would strengthen the bullish case.
📝 Notes:
This study is based on technical divergence and trend reversal principles.
Always wait for breakout confirmation with volume before taking directional exposure.
Ideal for positional/swing traders monitoring early trend reversals.
The chart currently indicates a base formation; premature entries below ₹130 could face short-term volatility.
Not financial advice — purely for educational and analytical study purposes.
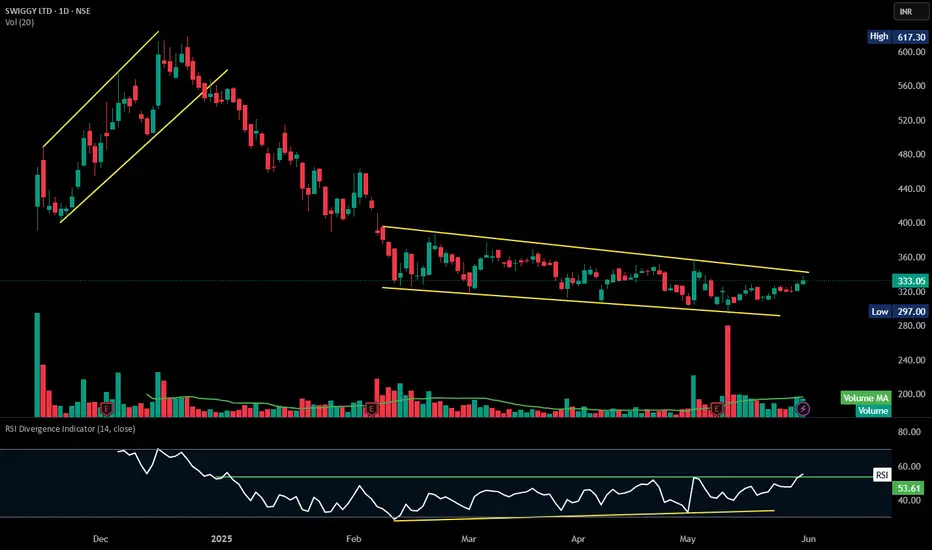
SWIGGY | Positive Divergence |RSI breakout - watchlist ### **Technical Analysis of Swiggy Ltd. (NSE)**
The chart highlights a **descending channel breakout**, indicating a potential trend reversal.
### **Key Observations:**
1. **Descending Channel Formation:**
- Price has oscillated within two downward-sloping trendlines from **January to June 2025**, creating a bearish trend.
- **Breakout above 333.05 INR** suggests buyers may be gaining control.
2. **Volume & Price Action:**
- **Current price:** **333.05 INR**, up **1.28% (+4.20 INR)**.
- **Volume (20-period moving average):** **19.7M vs. 21.35M**—watch for a sustained increase to confirm the breakout.
3. **RSI Divergence:**
- RSI is **55.23**, indicating improving momentum but not yet in overbought territory.
- Divergence suggests weakening bearish pressure, strengthening bullish reversal potential.
- **Support & Resistance:**
- **Support:** **297.00 INR**, the lower boundary of the previous range.
- **Resistance:** **352INR**, the prior high acting as an upside target.
ICICI Bank Divergence: Reversal or just a halt?Higher TFs have alreadyy thrown a nice breakout to the ATH. Monthly RSI is overbought now. Looking at the price action, I don't see a big reversal of any sorts.
There is a nice 3 Bar Negative Classical Divergence (NCD) in the Daily. Also, it being at the ATHs and overbought levels make it more strong. The last candle was an upside rejection candle, again showing exhaution in momentum.
In the 75 min again, we see a nice wide NCD. Once the TL is broken and price makes a LL, one can look to enter short Intraday provided an opportunity arrives in the 15 min TF for a quick and small move.


Nifty 04 Feb’21: Fractal Divergences Thanks to banking stocks and especially SBIN, the benchmark Nifty posts fourth consecutive positive daily close. Targets/ resistances from one of the rising channel's upper border at 14,900 is now taken care and if this kind of momentum continues then we should be headed towards (15,200-15,300). But there is a little element of caution we should pay attention to. A negative price-momentum divergence on the daily and 75min chart of Nifty at the current juncture. Such divergences generally indicate some consolidation or slow down going ahead and not necessarily a reversal. Considering the momentum with which we had this rally, I sense that the index will face some profit taking/ consolidation on the last trading session of the week.
Thank you for following my work and please feel free to share your thoughts and suggestions.
Trade Well. Trade Wise.

DMart form Bearish RSI Divergences on Daily ChartHi Trader,
Dmart form Bearish RSI Divergences on Daily Chart.
Bearish View on stock till 200 sma :
1) D'Mart has faced resistance at zone of 1510 -1530 & downtrend started
2) Dmart form Bearish RSI Divergences on Daily Chart - RSI making low high & price making higher high.. See the chart for visual details
3) RSI taken support at 50 level many times , if rsi breaches this level it will freefall as bear fully control stock.
4) More Bearish if price breaches uptrend channel & 200 sma.
Target : 1425 (200 dma)
Strict Stoploss: Above Swing high of 1510 -1530 (Resistance zone)
Happy Learning );
Disclaimer : This is post only for educational purpose . Do your analysis before taking position or trading.

Divergence In Quant Price and OI data: Is A Reversal On the HoriDivergence In Quant Price and OI data: Is A Reversal On the Horizon?
The rising Open Interest figures suggest a disparity with the current price trend, hinting at an impending market upturn.
The Quant price may bottom out if the bulls are able to reclaim the $100 level and sustain above it.
The broader crypto market is on an upward trajectory intraday, attempting to offset recent declines. Leading the charge, Bitcoin has risen by 2.35%, while Ethereum has also seen a 1.65% increase compared to its previous day's close.
In tandem with these market giants, the altcoin Quant is making similar progress, having risen by approximately 1.92% at the time of writing. Moreover, a noticeable divergence between open interest data and price points to a potential trend reversal in the crypto sphere.
Let's explore more using the metrics and try to find insights into potential price movements in upcoming trading sessions.
Open Interest data and Price is showing a divergence!
According to information from the financial analytics platform app.santiment.net, a noticeable divergence has emerged between the price of Quant and the aggregate value of open contracts denominated in USD. Specifically, since May 5th, there has been a consistent uptrend in Open Interest data.
Conversely, during the same timeframe, the price of QNT has been on a decline, further accentuating the divergence. This increase in Open Interest suggests that major players may be positioning themselves in anticipation of a price reversal, despite the ongoing price decline.
The uptick in Open Interest could signal an upcoming reversal for QNT. Nevertheless, investors should look for confirmation in both price and trading volume before drawing conclusions.
Could Quant Crypto Bottom Out If the Market Recovers.
Quant's price trajectory has been on a downward trend, facing significant resistance around the $110 mark before falling below the key $100 level.
Currently, the price hovers around $90, aligning with its prior low point. Now, If the bulls manage to uphold this level and the $90 mark, it could potentially lead to the formation of a double bottom pattern.
Furthermore, A successful ascent above the $110 neckline might then signal a reversal in Quant's price direction. This scenario, however, hinges on a broader market revival.
Conversely, should the decline persist, Quant could descend to new multi-month lows, perpetuating the current bearish momentum.
Conclusion.
The crypto market is rebounding, with Bitcoin and Ethereum posting intraday gains. Quant's price has also surged by 1.92%, despite a divergence between rising Open Interest and falling prices since May 5th, hinting at a potential reversal.
As of Now, Investors should seek confirmation in price and volume. Quant faces a critical juncture: if it maintains the $90 level, a double bottom pattern could indicate a trend reversal, contingent on broader market recovery. Otherwise, the downtrend may continue, leading to new lows for Quant.

Negative Divergence in Nifty Daily on 13th Sept HighNifty Daily creates a negative divergence on 13th Sept, where price attains a HH without RSI follows it (see the brown circles in price/RSI).
Per common wisdom, negative divergence needs to correct below the previous swing low (29th Aug @ ~17200) to correct the divergence.
Now how far?
Well the next Fib support is at golden ratio ~17000.
Just empirical - whatever eyes see in chart.

RSI Divergence (Bearish)Bearish/Negative RSI Divergence observed today on BNF 15min chart. Te gap was just 2 candles and hence a steep fall even though the difference in price/RSI was minimal. Power of RSI divergence.

NIfty Bank | DivergencesHidden & Classic Divergences cast at crucial 0.618 level. Safe to wait for confirmation before going long.
Feedback always appreciated. Thank you.
Click below for other charts

NZDUSD - Bullish Divergence As indicated on CCI a bullish divergence is seen on NZDUSD pair on the daily chart. We can buy this as per the indicated limits.

HDFC Bank class A divergence.HDFC Bank class A divergence seen on chart which is sign of reversal. It may reverse from here for target 1800,2100.

Amar Raja Battries bullish divergence.self explanatory.bullish divergence seen on chart. trend reversal can be seen.

Divergence on the daily, what could happen ?Divergence occurs when the indicator fails to imitate the pattern on the price chart, a sign of trend weakness and likely reversal. In an up-trend, if the price makes a new High (a higher peak than the last) but the indicator fails to do so, that is a bearish divergence.
You can see the supports that can resist the price fall However, 30k is strong support breaking it will get the price to the bottom at 20k.

Bearish divergence in TCSTCS daily and hourly charts are showing bearish divergence. Downside on the cards.

Channel Resistance + RSI divergenceOANDA:XAUUSD showed resistance near channel Trendline along with a bearish divergence.

Auropharma DivergenceI think price should go down, but in short term there might be some increase in price.
In hourly chart price have divergence.
In weekly chart price in range, making several tops but not be able to break them.
P.S. Please like if you find any of these information helpful.

DBL Trading Near a Support and Giving Positive DivergenceDBL is trading Near a Support level and giving a Positive Divergence.
