✅ Ethereum Classic Price Analysis "FW"The above chart of Ethereum Classic (ETC) laid out the falling wedge pattern. In a falling wedge pattern, both the upper trend line which connects the highs and the lower trend line which connects the lows converge downwards. The wedge pattern in general indicates a trend reversal. Especially, the falling wedge signals a bullish reversal.
This pattern indicates a breakout in the price trend towards an upswing. From the above chart, we can interpret that the momentum of the downtrend is slowing down.
Currently, Ethereum Classic (ETC) is in the range of $35.80. If the pattern continues, the price of Ethereum Classic (ETC)might reach the resistance levels of $45.60 If the trend reverses, then the price of Ethereum Classic (ETC) may fall to $33.70
✅Trade Level
Entry Point : $36.70
Target : $45.60
Stop Loss : $33.70
Happy Trading
Search in ideas for "ethereum"

Ethereum Crypto Currency : Low Risk and high reward ratio
Hello All, I am back again, with another profitable trade ... Ethereum Crypto Currency..
As you can see Ethereum is at crucial stage, One can expect a bounce back from this stage, if it does, you can expect a rally of 50% -60% upside…
Pls Note: these are for education purpose, trade as per your understanding and knowledge ....
Risk is to reward ratio is mentioned .... Risk of 5% -6% and reward of 50-6% 🙂

ETH bounced beautifulEthereum against BTC got a beautiful bounce of the support of the rising wedge. Since we're still inside the wedge I'm still incredibly bullish on Ethereum (even more then on Bitcoin). We just flipped the resistance of 0.071139 into support.
The next level that I'm watching is the red line at 0.731. I think we're going to see some action of ETH very soon.
Let's freaking go!

Ethereum Update With Same $6K Target On Strong Bullish Breakout We have the same chart here we looked at on August 4, Ethereum aims at $6000 (see it here) .
We have really strong technicals in favor of the bulls/green side.
The consolidation has been really strong with the price staying above the blue space on the chart (our "last barrier").
The price not dipping lower is a good/positive signal.
The longer we have this type of bullish/sideways consolidation at the top, the better the outlook becomes for the bulls.
Breaking below EMA21 ($3165) would be a bearish signal yet we remain strongly bullish above the EMA50 line at $2680.
Overall the outlook continues to be pretty good.
Ethereum (ETHUSD) continues strong.
Namaste.

Ethereum "Last barrier" | Aims At $6,000We've been looking at Bitcoin lately and neglecting Ethereum and other Altcoins... What a surprise to see the ETHUSD chart.
Join me for some cryptocurrency chart related entertainment.
Ethereum (ETHUSD) Daily TF Chart Analysis by Alan Santana
ETHUSD is now facing resistance while slowly but steadily moving higher...
We can see a strong resistance level between $2700 - $3000, which I am calling the "last barrier".
If this level can be taken out, which seems very likely to happen, we can see Ethereum hit $3800 to move and challenge next its All Time High.
Depending on how the ATH is handled we can aim at $5000+ to hit $6,000... This is all strongly possible in a flash.
The chart we are looking now fully support the scenario I describe above.
We have low volume yet prices are cripping up.
We are in the summer yet crypto remains strong.
We have a very strong RSI and MACD.
If the whales/bots/market makers push the bottoms, we will see massive/sudden bullish action form.
As the last barrier is taken out, we can see ETHUSD hit $6,000+.
This is how Crypto works...
One day it is completely as sleep.
The next day it is worth more than Gold.
Namaste.

Ethereum Bullish Weekly Close | Will It Hit $4,9K or $5,3K Next?We have another very good close for Ethereum (ETHUSD) on the weekly timeframe.
Last week closed above $3,600, this can lead to even higher prices.
Now, $3,900 might sound like a lot but only if you are comparing to earlier prices... Remember when Bitcoin was $3,000?
Bitcoin is now worth over $58,000 for one single coin... Ethereum can go through something similar... Remember that this bull market will last for years to come.
There is a lot of room at this point for a correction to take place... But we are reading charts here, just as we have room for lower prices we also have room for more gains.
Trading or not, buying or not, will depend if you are buying for the short or long-term.
Based on my Fib. projections, ETHUSD can hit over $4900 next.
We are supported by the TD sequential, the RSI and the MACD as well.
This is a tricky one... Make sure to plan before you trade.
Will you hold if you buy and it drops?
If it rises, will you sell, how much, and when?
Let us know in the comments...
Thanks a lot for your support.
Namaste.

Ethereum Moving Below Support, Incoming Drop! (Altcoins Update) Another one of the big buys, Ethereum (ETHUSD), is also aiming lower...
What do you think will happen when big money flows out of Bitcoin, Ripple, and Ethereum?
Where is this money going?
The smaller altcoins of course... We are talking about thousands and thousands of altcoins.
---
Back to Ethereum...
We can see prices moving below EMA10 and the exact same signals we saw on the Bitcoin (BTCUSD) chart.
We have the indicators, MACD and RSI, trending lower as well as bearish divergence with both.
We also have a bearish cross on the MACD and the bear volume being clearly stronger than bull volume since the beginning of the month.
This is no big deal...
This is not a problem...
Prices go down, just as they go up.
You always get a retrace after a strong bullish move.
Conditions for change
We would need to see Ethereum (ETHUSD) move above the last high and staying there for the bearish bias that is developing now to be canceled out.
For now, we are aiming for lower prices.
Thanks a lot for reading.
Namaste.

ETHUSD $170.00 breakout neededEthereum is struggling to recover above the $150.00 resistance level, following last weeks sudden drop towards the $135.00 support zone. ETHUSD bulls need to rally the cryptocurrency above the $170.00 level to change the short-term bearish outlook. Ethereum continues to have a high correlation to Bitcoin and could trade sideways until BTCUSD bulls return.
• If the ETHUSD pair trades above the $150.00 level, key resistance is found at the $158.00 and $170.00 levels.
• If the ETHUSD pair trades below the $150.00 level, key support is found at the $143.00 and $135.00 levels.

Ethereum ETH price analysis: ETH price stuck below $185The queen of cryptocurrency Ethereum (ETH) is volatile Ethereum ETH price analysis charts are a telltale of the thrashing it received for one reason or another. In the past five days, the Ethereum price went up as high st $192. but unable to break through to the previous high of $192.86 on the 29th of October, but unable to break through to the $200 psychological barrier. Read More

Ethereum Price Likely to surge Amid Ethereum future' AnnouncemenHeath Tarbert, head of the United States Commodity Futures Trading Commission (CFTC) talked about the future of cryptocurrency and the government regulations on cryptocurrency as well in the recently held Yahoo Finance’s All Markets Summit in New York City on October 10.
The native derivative cryptocurrency of the Ethereum ecosphere, ETHER was seen as a commodity that is selected in the US to be regulated by CFTC, Ether is supported on a public, open-sourced blockchain-based platform that attributes smart contracts.
Source: TheCoinRepublic

Ethereum’s New Innovation & Pillar named “Athereum”The mysterious group named The Rocket Team uncovered Avalanche which is a ground-breaking understanding component between the new Snow-Avalanche group of conventions, which is presently expedited the main savvy contract stages “Ethereum”. A rising mix of these two is seen in the crypto economy.
Emin Gun Sirer who is Cornell educator and AVA labs organizer unveiled about Athereum in the ongoing held DEVCON 5, Athereum viewed as the Avalanche — put together matrix with respect to AVA, which is bolstered on “Blockchain 3.0” systems. AVA labs detailed with Medium Post that the Athereum task is an “Inviting Fork” which is utilized for the welfare of the Ethereum environment utilizing new advancement and research conceivable outcomes.
Source: TheCoinRepublic

ETHUSD temporary setbackEthereum has pulled back towards its opening weekly price after bulls failed to build bullish traction above the $180.00 level. Weakness in the altcoin space is also weighing on Ethereum from a technical standpoint, as investors increasingly favor Bitcoin. Overall, the ETHUSD pair has strong support from the $160.00 level and is still likely to move back towards the $200.00 level in the medium-term.
If the ETHUSD pair trades below the $170.00 level, key support is found at the $160.00 and $150.00 levels.
If the ETHUSD pair trades above the $170.00 level, key resistance is found at the $180.00 and $190.00 levels.

ETHUSD $220.00 key level to watchEthereum is attempting to recover earlier losses after the second-largest cryptocurrency found strong technical support from just above the $200.00 level. Further technical weakness in the ETHUSD pair should be expected if sellers keep the price below the $220.00 support level. Overall, a major test of the Ethereum’s 200-day moving average, just above the $170.00 level, appears likely at some point.
If the ETHUSD pair trades below the $220.00 level, key support is found at the $200.00 and $170.00 levels.
If the ETHUSD pair trades above the $220.00 level, key resistance is found at the $235.00 and $255.00 levels.

ETHUSD further losses expectedEthereum is under heavy technical selling pressure on Friday after breaking under the important $270.00 support level. The ETHUSD pair is tracking Bitcoin lower and is now trading below the neckline of a head and shoulders pattern with a downside target of around $85.00. The $220.00 support level is the next bearish target if Ethereum sellers continue to hold price under the $270.00 level.
If the ETHUSD pair trades below the $270.00 level, key support is found at the $250.00 and $220.00 levels.
If the ETHUSD pair trades above the $270.00 level, key resistance is found at the $280.00 and $300.00 levels.

ETHUSD still in the danger zoneEthereum has returned towards the $260.00 resistance level as the second largest cryptocurrency tracks the broader market higher on Thursday. Ethereum is still in the danger zone while trading below the $280.00 as the bearish head and shoulders pattern still remaining valid. Overall, the ETHUSD pair is still tracking BTCUSD fairly closely this week and has yet to break the strong correlation.
If the ETHUSD pair trades above the $260.00 level, key resistance is found at the $280.00 and $320.00 levels.
If the ETHUSD pair fails from the $260.00 level, key support is found at the $230.00 and $205.00 levels.

ethereum rsi and macd look bearish. DO NOT SHORT.CONSIDERING BITCOIN WILL GO SIDEWAYS.. ETHEREUM LOOKS BEARISH ON BOTH RSI AND MACD. ITS AT THE GOLDEN POCKET ZONE, WHICH WE NEED TO LOOK AT.. ETHEREUM MAY EVEN GO TO 600 DOLLARS. WE MIGHT SEE A PUMP AS ITS AT THE GOLDEN POCKET ZONE.SO.. ID SAY NOT TRADING IS THE BEST THING TO DO NOW.


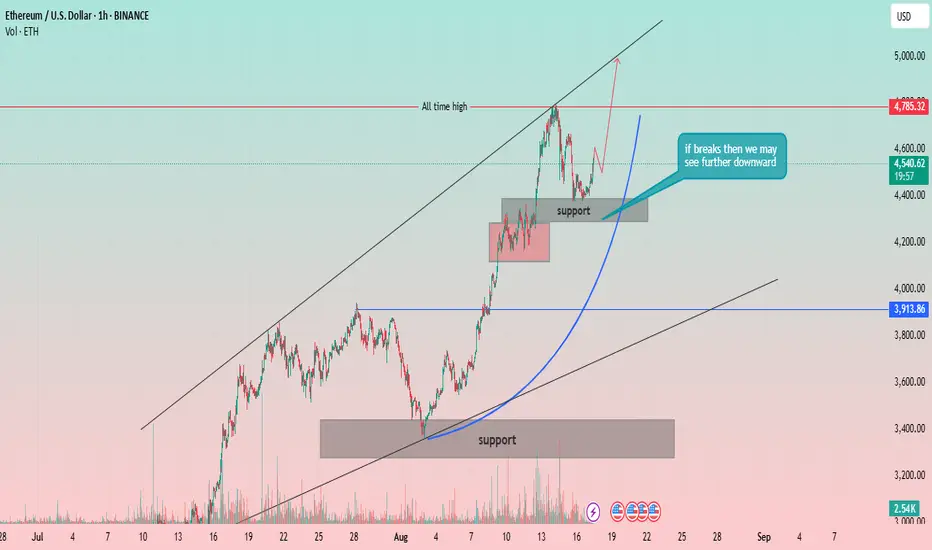
Ethereum (ETH) 1H Chart: Re-testing the All-Time High?Strong Uptrend Channel: The price of Ethereum has been moving within a well-defined ascending channel, indicated by two parallel black trendlines. This strong channel suggests a sustained bullish momentum.
All-Time High: A significant resistance level is marked as the "all-time high" at approximately 4,785.32 USD. The price has recently tested this level.
Support Levels:
Major Support Zone: A broad support zone is identified between approximately 3,300 USD and 3,450 USD. This zone has previously acted as a strong base for a price rally.
Recent Support Zone: A smaller, more recent support zone is marked around 4,200 USD. The price has consolidated within this area after its recent push towards the all-time high.
Price Action and Projections:
The price recently reached a peak near the all-time high and has since pulled back, consolidating within the recent support zone.
A key annotation states, "if breaks then we may see further downward." This highlights the importance of the 4,200 USD support zone. A break below this level could indicate a potential deeper retracement, possibly towards the lower trendline of the channel or the major support zone.
A parabolic arc is drawn (blue line), suggesting a potential trajectory for the price to continue its move higher from the current level, with a goal of re-testing or breaking the all-time high.
Volume: The chart includes a volume indicator, showing significant volume spikes during the major rallies and drops, confirming strong market interest and participation.
Ethereum (ETH/USD) – 4H Chart AnalysisETH is currently trading at $4,717 after a sharp breakout above the descending trendline (red). The move shows strong bullish momentum, taking price back into a critical resistance zone.
Key levels to watch:
🔴 Resistance: $4,718 – $4,879
🟢 Support: $4,098 / $3,900 / $3,700
The RSI (14) stands at 68.76, close to overbought levels, which could suggest short-term exhaustion if buyers fail to sustain momentum.
📌 Bullish Scenario: A breakout and hold above $4,880 could open the door for continuation toward $5,000+.
📌 Bearish Scenario: If resistance holds, ETH may retrace toward $4,100 – $4,000 before attempting another leg up.
⚖️ Outlook: Ethereum has reclaimed strong momentum, but a confirmation above $4,880 is key to validating a bullish continuation.

Eth s targets for sureEthereum 's targets for sure
Logarithmic history has certain basic growth factors , as per the logarithmic growth eth is just starting
Atleast 600% - 630% from the recent deep dip will be there

ETH/USD (Ethereum vs USD) – Daily Chart AnalysisEthereum has pulled back sharply from recent highs and is now approaching a key ascending trendline that has supported the bullish move since early May. Price is hovering just above the dynamic support zone, and momentum seems to be weakening.
Key Technicals:
EMA 20 (green): $3,510
DEMA 50 (red): $3,607
Current Price: ~$3,438
Support Trendline: Near current price
Structure: Higher highs and higher lows still intact, but nearing inflection
Potential Scenarios:
Bullish Case: A bounce from the trendline and reclaim of the 20 EMA could revive bullish sentiment toward $3,700+.
Bearish Case: A breakdown below the ascending trendline and $3,400 level might signal deeper retracement toward $3,200 or $3,000.
📊 Monitor closely for reaction at the trendline. Watch for EMA crossovers or consolidation patterns to confirm the next move.

#Ethereum has printed a rising wedge formation
BINANCE:ETHUSDT
#Ethereum has printed a rising wedge formation on the 1-hour timeframe — a pattern often seen near the end of impulsive moves, hinting at either a breakout continuation or a pullback trigger.
Price has moved from the recent low of $3,481 to a local high near $3,858, hugging the upper trendline of the wedge.
The structure remains intact with consistent higher lows, but current candles show some wicks and slowing momentum at the resistance line.
Immediate Resistance: $3,860 – psychological and structural ceiling
Support Zone: $3,775 and $3,700 (lower wedge edge)
Breakdown Watch: A confirmed close below $3,700 could suggest profit booking or short-term pressure.
If CRYPTOCAP:ETH can consolidate above $3,775 and push past $3,860 with volume, bulls may regain command.
However, a failure to hold the wedge support could trigger a retracement toward the $3,650–$3,600 range for structure revalidation.

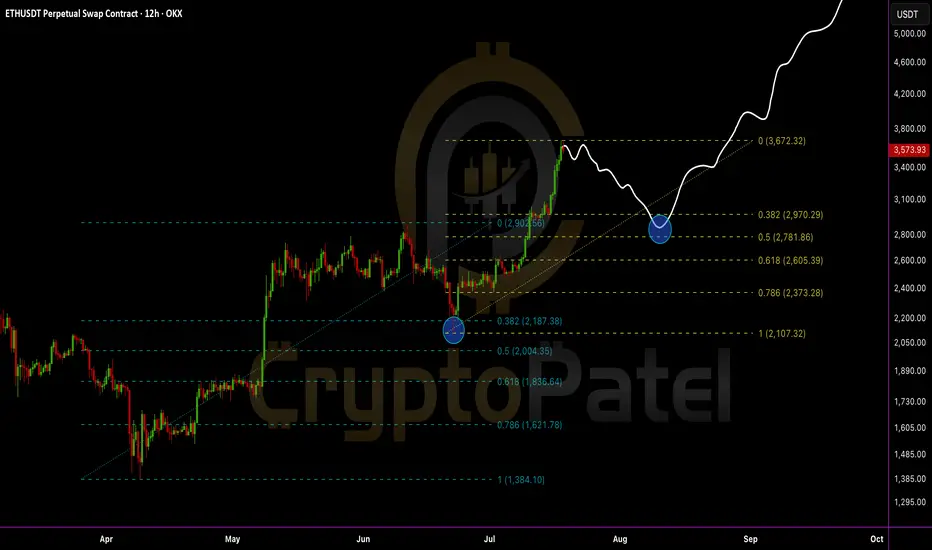
Everyone’s bullish now… but smart traders are waiting for this EEthereum just tapped a key resistance near $3,672 and is starting to show signs of cooling off.
A healthy retracement could bring ETH back to:
0.382 Fib – $2,970
0.5 Fib – $2,781
0.618 Fib – $2,605 (Strong demand zone)
IMO, we can expect ETH to revisit the $2,700–$3,000 zone before the next leg up.
This area will be the golden re-entry for long-term targets of $6,000–$8,000.
Stop-loss: Recent high and candle close above $3,675
Structure remains bullish:
✅ Previous dips into Fibs triggered strong buybacks
✅ Clean higher highs and higher lows
✅ Demand zone + retracement = opportunity
My View: Let price pull back. Then load up again. Bigger wave incoming.
DYOR | NFA