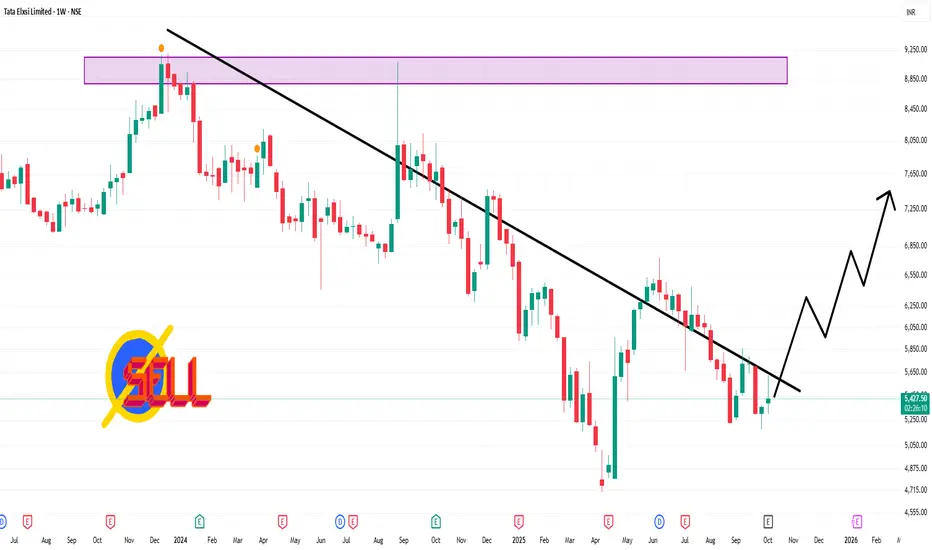
TATAELXSI 1 Week Time Frame 📉 Technical Outlook (Weekly Timeframe)
Technical Rating: The prevailing trend is a strong sell, supported by indicators such as moving averages and oscillators.
Pivot Levels:
Weekly Pivot Point: ₹5,300.33
Support Levels:
S1: ₹5,272.75
S2: ₹5,106.83
Resistance Levels:
R1: ₹5,493.83
R2: ₹5,618.17
Central Pivot Range: ₹5,272.75 – ₹5,300.33 – ₹5,327.92
Relative Strength Index (RSI): The 14-day RSI is approximately 48.6, indicating a neutral condition.
Moving Averages:
50-day MA: ₹5,362.89 (Buy)
200-day MA: ₹5,503.06 (Sell)
5-day MA: ₹5,468.50 (Sell)
10-day MA: ₹5,502.65 (Sell)
20-day MA: ₹5,468.57 (Sell)
Search in ideas for "oscillator"
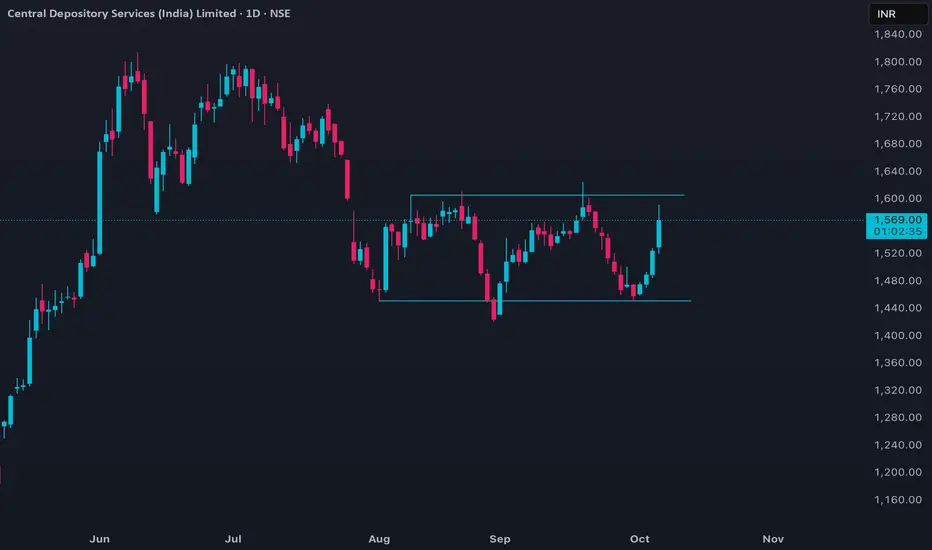
CDSL Price ActionCDSL opened the session with strong buying interest and surged nearly 3% in early trade, reflecting robust momentum and outperforming broader sector trends. The stock is currently trading around 1,570, after touching an intraday high near 1,592 and respecting support at 1,520. Volumes are significantly above the recent average, indicating active participation from both institutional and retail traders.
On the technical front, CDSL continues to trade above its 50-day and 200-day moving averages, maintaining a mildly bullish trend as confirmed by momentum oscillators. The daily charts exhibit a series of higher lows, and the stock has rebounded from its recent base near 1,450. Key resistance is seen at 1,625; a breakout above this zone could trigger a further rally toward 1,800. Immediate support for short-term traders lies at 1,535, and any dip toward this zone may see strong buying interest.
Technically, mixed longer-term indicators suggest some caution—while the RSI remains bullish and the overall trend is favorable, weekly signals like MACD show mild bearishness, indicating some volatility. Still, the overall bias remains positive as long as the price sustains above key support levels, making CDSL a favored pick in the capital market sector for the near term.
NIFTYBANK - Exciting East!Nifty bank back to where it was a month ago, negative for the year so far.
Optically nothing much has changed, we printed out of the box GDP number, higher GST collections, robust SIP numbers. One cannot blame the PSU pack as their weightage is not that great.
Broader profit taking can be the culprit. With inflation assumed to be slowing down, the real print would come post the elections not before. The measures are meant to contain as administrative and thus the markets are not focussing. In any case, the larger picture suggests a better management.
With Bank of Japan, communicating the end of the low interest rate regime, it is clear, monetary policy would continue to be elevated. What one has to wait and see is how the liquidity will be drained by the central Bank's and that would take some more time and the devil is in detail.
Seven Days of Fall and the lower wick of yesterday coming around the LBB and previous move supports a rise first than fall first. This is also aided by the neutrality of the oscillators.
Close above 47000 pushes some hope while bears need below 46000 to assert. Recall this has been very strong support and hence this space likely to get some support. Near term frames 46300-47300 to work.

This stock has turned bearishFib Analysis- 646 is the Fib resistance. It is the 100% of the previous swing. So we have a price resistance.
Candlestick - At the price resistance we have a reversal pattern Railway track which is a directional signal.
RSI & Composite- we have a -ve divergence in both the oscillators.
Conclusion - Use any bounce back to exit this counter. Below 512 exit this counter.

AUDUSD stays bearish unless crossing 0.6950AUDUSD braces for the first monthly loss in four despite Friday’s rebound from the 61.8% Fibonacci retracement of its December 2022 to early February highs. A clear downside break of the two-month-old ascending trend line joins a two-week-old descending trend line to favor sellers. Adding strength to the bearish bias are the downbeat oscillators. The corrective bounce, however, could become important if it manages to cross the convergence of the previous support line and an immediate downward-sloping resistance line, close to 0.6950. Following that, the 100-SMA surrounding 0.6985 and the 0.7000 psychological magnet could act as the final defense of the Aussie bears before giving control to the bulls.
Alternatively, the aforementioned 61.8% Fibonacci retracement level around 0.6830, also known as the golden Fibonacci ratio, puts a floor under the short-term AUDUSD downside. Following that, the 78.6% Fibonacci ratio near 0.6750 may act as an extra filter towards the south. In a case where the Aussie pair remains bearish past 0.6750, the December 2022 low near 0.6630 could lure the sellers.
Overall, AUDUSD’s corrective bounce, if any, remains elusive unless crossing the 0.6950 hurdle.

#USDINRUSD/INR 1W: Nice fusion between EW, PA & oscillators. Didn't surprise me when the run paused at 83. Wave 5 is killer most of the times in currency & commodities. Chart Self-explanatory.

EURUSD buyers need validation from 1.0100 and FedDespite retreating from the 100-DMA during the last week, EURUSD defends the upside break of the 50-DMA and five-month-old descending trend line as traders await the Fed’s verdict on Wednesday. The major currency pair’s latest rebound also gains support from the firmer oscillators. As a result, bulls are hopeful of overcoming the 100-DMA hurdle surrounding 1.0070. Even so, the previous monthly top surrounding 1.0095 and the 1.0100 hurdle could test the upside momentum before giving control to buyers. In that case, a run-up towards the horizontal resistance area comprising multiple levels marked since May 12, close to 1.0360, appears more likely to follow.
Meanwhile, a downside break of the resistance-turned-support and the 50-DMA, surrounding 0.9880, could quickly drag EURUSD towards a five-week-long support line near 0.9780. Should the quote break the nearby trend line support, the 0.9670-60 support region will gain the bear’s attention before targeting the yearly low near 0.9535.
Overall, EURUSD is up for reversing the downward trajectory established in June. However, it all depends upon how well the Federal Reserve policymakers can convince markets of their dovish hike.

#IIFL - Bullish view #ABCD #EWIIFL Finance: It did exactly .382 retracement and surged almost 30% in last 3 weeks to give consolidation breakout. Price trading well above key EMAs supported by positively trending oscillators. Appear it is forming ABCD & as per EW C, which indicates target around 450 & beyond. Good to accumulate on dip between 330-340 (allow DRSI to melt a bit). Keep eyes.

View on Alok Industries LtdHey everyone, here is my view on Alok Industries.
You should wait for several confirmations before taking the trade.
For going short, the Monday candle should close below 27, and a few confirmations on the oscillators.
For going long, look for any bullish candlestick formation. The price should not cross the 27.70 resistance.
Check out the 4 hourly chart here, which is self explanatory! It is bullish on 4 hourly.

Weekly resistance test gold buyers ahead of ECB, US GDPGold extends the bounce off monthly support while picking up the bids near $1,801 during the early Thursday. In doing so, the yellow metal pokes a one-week-old descending resistance line inside a one-month-long rising channel bullish formation. Also keeping the gold buyers hopeful is the quote’s sustained trading beyond 200-SMA and firmer oscillators. Hence, the commodity is likely to overcome the immediate hurdle surrounding $1,801 to aim for 78.6% Fibonacci retracement of September’s fall, near $1,810. It should be noted, however, that the stated channel’s resistance line and the last month’s top, respectively around $1,830 and $1,834 will probe the bulls afterward.
Meanwhile, risk-off mood post the US GDP and ECB outcomes could direct the gold sellers towards challenging the bullish chart pattern by hammering $1,787 support. Should prices remain weak past $1,787, the 200-SMA level of $1,770 may probe the bears. It’s worth noting that multiple supports around $1,750, comprising 23.6% Fibonacci retracement level, will challenge the further downside before eyeing the last month’s bottom close to $1,721. To sum up, gold has a smooth run-up on the north but the fears of tighter monetary policy poke the bulls.

BITSTAMP:ETHUSD Key Levels to trade !!BITSTAMP:ETHUSD
#ETHUSD
All the key levels up dated in chart.
Reach me in case of any clarifications.
No indicators/Oscillators.
Hit like and let me know the feedback to do more charts !!

COINBASE:BTCUSD Key Levels to trade !!COINBASE:BTCUSD
#BTCUSD
All the key levels up dated in chart.
Reach me in case of any clarifications.
No indicators/Oscillators.

MOTHERSONSUMI | BREAKOUT CONFIRMED ON WEEKLY CHARTS | LONG SETUPStock has given a breakout over it's neckline of the inverse head and shoulders pattern, with high volumes and buying crossovers on various oscillators. Stock looks to be in uptrend and buying will remain intact. Pitch right in and go long with the mentioned stop-loss, for the mentioned targets.


SBI Monthly- Strong Downtrend ahead.Once the target of ~ Rs 340 in this November month reaches, expect a downside trend with a sideway range trade(Rs 250 to Rs 315)and further if the momentum continues, maximum fall around Rs 212.
Upcoming trend reversal gets confirmed by confluence of MacD+RSI+Stochastic oscillators.
On chart look at sellers queue at Red Trend Lines and buyers queue at Green Trend Lines . The middle White trend line(Rs 280) is going to the pivot point.
Happy Investing!

MAYURUNIQ: Observation for Investment.Candle Pattern: Harami Cross Bullish.
Volume: More than 3X 20d avgerage.
Observed Divergence in some of the technical indicators & oscillators. ( RSI , MFI, OBV, W%R etc.)
Potentially Strong Above @ 418 - @ 420Treat as Swing Trade Hurdle level.
Once closed above @ 420 with Volume Strong UP move.
Witnessing Strong Volume in Last trading session.
Regular Dividend Paying Company.
...... levels for trade mentioned on chart.
Education purpose only.

DPL: Long Entry Observation Candle Pattern: Inverted Hammer in Last three consecutive days. (Technically Treat as Bullish Reversal)
Observed Divergence in some of the technical indicators & oscillators. (RSI, CCI, W%R etc.)
Hurdle levels @ 116 - @ 118. Once closed above @ 118 with Volume Strong UP move.
Witnessing Strong Volume in Last trading session.
Good Dividend Paying Company. Last Div Rs'. 3.50 on 02 Aig 2018. (More than Interest of SB A/C in PSU's)
...... levels mentioned on chart.
Education purpose only.

TAJGVK: Observation for LONG.Matching LOW Bullish.
Observed Divergence in some of the technical indicators & oscillators.
Probable to form Rounding Bottom in coming days.
...... levels mentioned on chart.
Education purpose only.

NIFTY: What's NEXT? Spot & FUT important Level Weekly BasisSome Fact:
#1. Candle Pattern: Spinning Top on the daily chart => Means that Bulls are not loosening their ground but Bears are putting pressure at higher levels.
#2. Negative Advance-Decline Ratio for the third session in a row accompanied with sell signal on twin momentum oscillators. and the fact that market registered a positive close for 7th day in a row can be a cause for concern and may be pointing towards a Correction or Temporary Ppause of the ongoing upmove,
#3. India VIX fell down by 2.88 percent at 14.14. VIX has to Cool down to extend its Positive momentum.
#4. OPTION Data: Maximum Put OI is placed at 10300 followed by 10200 strikes On the other hand Maximum Call OI is placed at 10500 followed by 10700 strikes.
#5. Tag of War: Significant Put writing at 10500 and 10400 strikes => Shifting its SUPPORT to Higher Side while intact Call writing at 10500 strikes is Restricting its UPside Momentum.
Levels plotted on chart.
Analyze my early post "NIFTY: Some Fact & View ........", what i am saying.
Trade as per Specified level with description.
FUTURE Trader Should take position with Hedge strategy.
Disclosure: Information shared here can be my view or real trades.
As i am not SEBI regd. analyst, Take this information as study/education purpose only.
If Useful Like & Share
For taking trade decision Consult with financial Advisor.
N.B: View may Changed or Reversed if Major NEWS came before Monday Market Opening.

VEDL - BUY - GOOD TO INVESTRef chart.
Bounce back from its 200DMA with good volume. Positive sign from the oscillators. There is a potential for another good rally from this counter. watch this space.

CESC: Lightening Ahead - Result Series.CESC : Lightening Ahead - Result Series .
Reason for LONG:
#1. TENKAN SEN (@ 884.95) & KIJUN SEN (@ 881.15) Bullish Cross OVER
#2. HIGH & CLOSE Above KUMO Cloud
#3. Crossed GANN Arch 3 X 1
#4. Crossed GANN Line 4 X 1 with Volume.
#5. Closed Above FIB Retracement 50% (Recent H-L ).
SUPPORTIVE BREAKOUT ALSO FROM TECHNICAL INDICATORS & OSCILLATORS.
Go LONG: +0.50 to -0.5% of CLOSE.
Best LONG: @ 897 to @ 900
STRONG Bounce Zone @ 889 too @ 884
For Intraday / Swing TARGET: @ 911.60, @ 913.5, @ 916.70 - @ 919 (HZ), @ 925+
More TARGET Levels on Chart .
SL: Below @ 875 (By Closing)
More Updates Later.
FnO Strategy : On QUERY .
If enriched your knowledge and would help you in trading,
Please don't forget to Hit / Click Like button .
Your likes motivate me to post better ideas in future.
Disclaimer: Only For STUDY. For Taking Trade Decision Consult Financial Advisor.

$ZEC Price Analysis — Trend Shift Detected! CRYPTOCAP:ZEC Price Analysis — Trend Shift Detected!
#ZEC recently faced rejection from the $548 resistance, forming a visible descending trendline on the 15-minute chart. After several attempts to reclaim that zone, the price turned lower, confirming short-term weakness.
At the moment, #ZEC is trading around $495, showing a mild continuation of the bearish structure. The Trendlines with Breaks Oscillator has turned red — a sign of bearish momentum building up, with a confirmed downside break signal.
Key Technical Insights
1️⃣ Chart Pattern
ZEC formed a rising wedge, which typically signals exhaustion after a strong push-up. The breakdown confirms that sellers are gaining control again.
2️⃣ Momentum Shift
The oscillator flipped from green to red, and the signal line crossed below zero, indicating that short-term momentum has shifted bearish.
No bullish divergence has appeared yet, suggesting that the drop isn’t overextended.
3️⃣ Support Zones
🔹 Immediate support: $495–$480 (minor zone)
🔹 Major support: $470–$450, where previous consolidation occurred and buyers may defend again.
4️⃣ Resistance Levels
🔸 $520 – First intraday resistance
🔸 $548 – Key rejection zone & descending trendline resistance
5️⃣ Trend Outlook
While above $470, the market could see short-term bounces. But sustained momentum below this range could open the path toward $450–$430.
If the oscillator flips green again near support, it could mark the start of a short-term rebound phase.
🧠 Summary
Current Trend: Bearish bias, early correction phase
Momentum: Negative, gradually increasing strength
Short-Term Range: $470 – $520
Watch Zone: Reversal signals near $470 for possible long scalps
Conclusion - #ZEC shows early signs of a short-term downtrend, driven by lower highs and bearish momentum confirmation. Traders should watch the Trendlines with Breaks Oscillator closely — a flip to green with rising slope could signal a fresh recovery leg toward $540+.

TECHNICAL TRADING CLASS 1Technical traders use unusual options activity as a signal to identify potential trading opportunities. They analyze the options data to determine whether there is a significant change in demand for a particular underlying asset and whether this is likely to result in a price movement.
The Relative Strength Index (RSI)
Moving Average Convergence Divergence (MACD) Indicator.
The Stochastic Oscillator.
Fibonacci Retracement.
Parabolic SAR.
Screener Plus.
Thinkorswim.
Slope of Hope.
