SBIN Point and Figure AnalysisSBIN point and Figure analysis for educational purpose only. The first target was achieved. The second target of 655 is still active.
Search in ideas for "point and figure"

point and figure UPL chart the counter looks highly bearish
with a breakdown on pnf chart clea;ry visible

Caterpillar Inc: The CAT is crawling, is it going into a cocoon Hi Guys,
Today I would like to post about the CAT from a Point and Figure chartists perspective. The data used is Daily OHLC data from July, 2016 to 6th August,2018.
The charts used in the post are Daily 2% X 3 and Daily 1% x3 Close only charts. Both the charts are constructed on the same data set as mentioned above.
As the data is 2 years data and the CAT, more than doubled from the price levels of July, 2016 I am posting zoom in and zoom out chart images for better clarity and understanding.
Let us have a look at the Daily 2% X 3 Close only chart. (Zoom out)
i66.tinypic.com
i66.tinypic.com
The stock is trading above the long term Bullish support line (the green dashed line) marked with green Arrow on the chart. The bearish resistance line from January,2018 high is marked as on the top left hand corner of the chart. The bearish support line(Blue dashed line) is marked with brown Arrow . The highest closing level is marked with Horizontal red dashed line and the recent double top resistance level at 156.38 is marked with solid orange colored line. The break out level is marked with Arrow on the chart@ 159.57. The Point and Figure vertical count down side target 111 is marked with Arrow on the chart.
On this chart the long term trend is intact as the CAT is trading above but the stock is on a SELL signal, a triple bottom sell signal which can be a trend reversal Point and figure signal. The stock will generate a BUY signal(@159.57) if it closes above double top resistance at . The down side vertical count is a t 111 . Please note that the pnf counts may or may not be fulfilled and the is negated if the CAT generates BUY as discussed above.
Now let us have a look at the Daily 1% X 3 Close only chart (Zoom out).
i68.tinypic.com
i63.tinypic.com
Let us have a look at the Daily 1% X 3 Close only (Zoom in) chart and conclude the discussion.
The long term Bullish support line marked with Arrow , invalidated bearish resistance line is marked as at the top left corner of the chart, the adjusted bearish resistance line is marked with Arrow , the bearish support line is marked as blue dashed line on the chart. The price point 133.22 is marked as , the price range 134.56 to 142.93 between the black and solid Horizontal maroon colored line is marked with and the double top resistance break @ 159.63 is marked with .
The stock is trading above the so technically the trend is Up and intact on this chart also. But the last signal is Triple bottom break down signal (below the black horizontal line at 142.93). After generating the triple bottom sell signal the stock tested bearish support at 134.56 above the solid maroon colored Horizontal line and rebounded back to retest the triple bottom break down level.
Then bears pushed the price down into ‘O’ column. If the bears succeed in pushing the price further down to below on a Daily closing basis, then the formation is called Bearish catapult which may accelerate the fall and may be in due course of time the stock may test in that case.
Please note that all the levels discussed above are on Daily closing basis levels.
So to conclude, if the CAT moves in the zone it will crawl (which is the current status), if it goes below it may go into a cocoon and if it breaks above it will emerge with flying colors like a Butterfly.

Long Term to Short term Forecasting by ShreeKrishna I have made efforts in explaining the best methods i know in the Market
I used the Point and figure charting method to analyze the current trend and termination
I request you to kindly go through the Point and figure charting methods read carefully before you apply it on any financial instruments
Good luck

Cupid : Long OpportunitiesNSE:CUPID
Here in Point and Figure chart, there is clear cut breakout of rounding bottom formation and We know that Point and Figure chart is noiseless in nature.
Here it is taken as 0.25% * 3 Reversal Box value.
So, We expect to grow up this cupid share price above 250.
Bullish Above 250
Target : 265, 300, 350+ Levels.
Stop Loss: 210 below.
Time Frame: 3_5 Months roughly.
Here if nifty will bearish, here Its Relative strength has been given positive cross over and Positive RS with its important moving average hence it will not so affect on cupid share price after breakout.
Disclaimer: Risk is yours and Reward is too yours.

btcusd at accumulation form the 200day wildermoving averagemarkup target has been calculated form the point and figure chart , posted in this link below..
tvc-invdn-com.akamaized.net
the 200day wilder moving average and the other picture, complementing the point and figure chart
Disclaimer.. not an investing/trading recommendation

NMDC: In a Steady UptrendPrice has been making progressing up, in a sequence of higher highs and higher lows in this weekly chart. Outlook looks bullish and a rally to the red line may be a reasonable expectation.
Here is the Point & Figure chart. Am posting an external link as Tradingview does not support log scale Point and Figure chart.
d.pr/za8B

HPCL and WTI CRUDE correlation?[/Hi,
Today i would like to present the Point and figure method analysis of correlation between WTI Crude price and stock price of Oil Marketing Companies like HPCL.(HINDPETRO:NSE) The WTI crude corrected 2.38% yesterday. Let us see how the HPCL chart is postioned.The Crude price is a significant influence on balance of payments for India as the Crude is the highetst import biller. And if WTI corrects and sustains below $ 60, that will be a great sign for Indaian economy and stock markets.
The HPCL charts analysis is based on YTD data. And charts used for analysis are logarithmic scaled 1% X 3 Daily High Low chart and Daily High-Low 2% X 3 chart. The WTI Crude Oil chart is constructed with YTD data but the chart is Daily High-Low 2% X 2 chart. The HPCL last traded at 283.90(NSE) and WTI is trading at $ 67.04.
Let us have a look at the WTI Crude chart.
b]
i63.tinypic.com
The WTI is in an Uptrend and the Bullish support line is breached once. But the trend lines on 2 box reversal chart are different than application of the trend lines on 3Box reversal chart. As of now the WTI is in sideways mode. The SELL signal level is 66.44 ( marked with Arrow ‘A’ on the chart)on the downside and 72.03 on the upside. The WTI Crude trend may change to down if it breaks the low of 62.53 marked as on the chart. The WTI breached and genrerated SELL signal yesterday(yesterday's low is $66.32).
Please note the Critical Price Point @ 60.05 is marked as on the chart and note down the monthly marking on the chart during the first quarter of the 2018. Please try to correlate the timing and CPP on HPCL charts with WTI chart.
Looks like if WTI sustains above the CPP that will be a problem for the OMC like HPCL due to subsidy burden.
Let us have a look at the HPCL Daily 1% X 3 High-Low chart.
i64.tinypic.com [/IMG
The chart is showing the price action history for the past two months. The quadruple bottom break down at 301.25 is marked as , the bearish resistance line is marked as , the trend changing point at 289.45 is marked as . The formation (Triple top break out followed by a double top break out) is called Bullish Catapult, which is a reversal signal. The Alert level 272 on the chart is marked as . The Bullish support line is marked with Arrow . The stock tested the yesterday marked with on the chart. Let us see how it will react to the WTI fall today. We can correlate the sideways action on WTI after making a high of $75 and the action here in HPCL stock.
Let us have a look at the Daily 2% X 3 High-Low chart.
i64.tinypic.com
The bearish resistance line is marked as , the Ascending Triple top break out shaded in yellow is marked with and the Trend changing point @ 298 is marked as . Please try to correlate the Critical Price Point on this chart and the WTI chart.
Now the HPCL charts are showing signs of Bias change, can we say WTI will fall from this levels and the bias changes from Up to Down?!
Keep watching the Alert levels marked on both the charts.
Good day

Nifty: Price Breaks Bearish Sequence but...From the chart, it is clear that the bearish sequence was broken when price made a new high above the prior swing high.
We now have a few reference points in the form of downsloping magenta pitchfork and upsloping green one.
A move past the upper parallel of the magenta fork would have bullish implications and price could then move to the middle green line. If this happens, a buy signal in the Point and Figure chart would be triggered and a new bullish sequence of higher highs and higher lows would be underway.
The other scenario is a failure in price and a fall below the recent low of 8002. This would mean continuation of the bearish trend upto 7750-7800 range.
Which scenario will playout? You guess is as good as mine, for the moment. We need more evidence from price to lean one way or the other

Seem Short Position to take in Nifty.NSE:NIFTY
As per as Point And Figure Chart, there seem as 10139/10110 seems to be crucial support area for Nifty.
10380 seems to be a bigger resistance, if doesn't breaks will come up to 9630 / 9400 / 8900
9650 important point for double top

DJIA - forming a base for markupDisclaimer.. not an investing/trading recommendation
the uptarget is based on point and figure chart and is a preliminary one, a conservative approach...
target after formation of LPS last point of support will be updated in duw course

Dharbriya Polywood- operators caught in the actBSE:DHABRIYA
the Point and figure markup target, is a provisional one, the most probable assessment can only be made when the last point of support is confirmed , until then this is the minimum target that should be achieved post reaccumualtion
disclaimer.. not invested, tracking fundamentals and looking for entry
not an investing/trading recommendation

Is Bitcoin ready for a Stepping stone reaccumualtion?Disclaimer... not an investing/trading recommendation
This is not a time oriented analysis, although last 2 times whales took 5 to 7 days to reaccumualte
the pathway of price action as mentioned is not a projection based on TA, rather, a mimic of the textbook wyckoff reaccumualtion schematics...
the markup target can only be calculated accurately , on completio of the Last point of support in Phase D of wyckoff schematics
for now, the 9.9k target has been mentioned on the basis if old point and figure analysis which is linked here in this chart
BITFINEX:BTCUSD COINBASE:BTCUSD BITSTAMP:BTCUSD

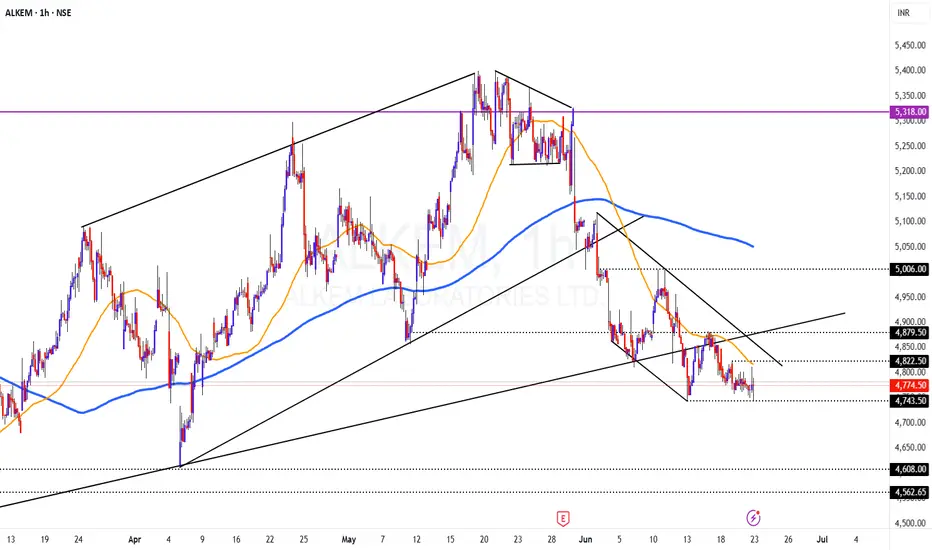
ALKEM - BREAKDOWN on Point and Figure Chart?Alkem looks to offer explosive move in the near term.
Levels are marked in the chart.. Price is at around support, but, breakdown usually happens from support levels only.
With a stop above 4825 (hourly close), this looks like a good RR set up.
On Daily TF:
Price is trading below Cloud
Price is trading below all key moving averages
Price had broken and trading below Super Trend Support on Daily and Weekly TF. Monthly SUperTrdend support is placed at 4200 levels only
In P&F chart set up too, it looks like a breakdown. (chart copied below)
Disclaimer: I am not a SEBI registered Analyst and this is not a trading advise. Views are personal and for educational purpose only. Please consult your Financial Advisor for any investment decisions. Please consider my views only to get a different perspective (FOR or AGAINST your views). Please don't trade FNO based on my views. If you like my analysis and learnt something from it, please give a BOOST. Feel free to express your thoughts and questions in the comments section.
long trade on BALKRISHNA INDSCompared to its competitors, the stock did not take part in the most recent surge. The severe decline in Brent crude prices over the previous few days is the basis for this trade's reasoning and concept. The small stop loss for this trade is set by point and figure charts rather than candlesticks. Stoploss will be lower than 1950.
My stoploss is 1939, and my first target is 2125 as well as the other targets listed above. This trade is positional. NSE:BALKRISIND NSE:BALKRISIND

Nifty update1. Nifty is at strong support zone in terms of both previous support zone of Jun - Jul 21 and adaptive VWAP zone. Levels of 15600 - 15900 is the support zone.
2. Given Inflation data in the US markets and the risk of rate hike, this support zone looks weak.
3. Point and Figure indicates a bottom of 14800 zone and it also coincides with another AWAP level of 14200 - 14700 level.
4. If the level of 15600 breaks, vix can shoot up to 32-36 levels indicating high volatility and less opportunities for shorting the market.
5. At 14800 levels it might become value zone and lot of value and contrarian investors might get active forming a side ways market.
6. 14200 - 14800 is the best time to go long term.

entry based on break on the level of h4 and used some new techsorry for late signal but it will hit it you can ask any question about it
HOW TO USE MULTIPLE TIME FRAME ANALYSIS??
Iam trading for more than 10 years and i used every trading tools and strategies , example; order flow, sentiment, renko system ,point and figure and other very strong strategies but i understood this forex market is fractal(meaning what u see yesterday that repeats again and again in any time frame, so i found that multiple timeframe analysis is best, in past traders use only moving average and 1- days or 10 days closes breaks they generate bout 80% a year that time, but now brain have improved and people found so many techniques with that tools now we can generate any% of money, yes iam serious, now traders making more than banks, at the same time people losing more than bank,, but its natural because when you sell there should be a enough buyer that's vice versa for buying too, so i know so many strategies and in internet there are some 1st grade strategy, what is 1st grade
grades of strategy:
( grades are not based on risk to reward because quality is important more than quantity )
1st grades: minimum more than 90% accurate, minimum 1 risk to reward
2nd grade: more than 75% minimum 1 risk to reward
3rd grade; minimum 60% accurate minimum 1 risk to reward
4th grade: minimum 55% accurate minimum 1.05 risk to reward
i use 1st grade strategy i developed step by step even if i teach you you cannot trade like me because its the personality that matches not the knowledge, you can have 1st grade accurate even if you use only support and resistance but if it not matches your personality(meaning: patience limit, psychology, emotional intelligence, you may ask that if we had that type of accuracy you can become a billionaire yes you can but accuracy is not the judge weather you can earn a billion in trading its, the plan that desides you can make billion or million, you can have 98% accuracy but you cannot make billion or million with 0.01 yes but even you throw 1000 lots you cannot because you got 2% against your winning so you can see the billionaire traders as proof in the real world that accuracy is not matters but risking plan matters
what determines risk?
your risk is determined by the grade you have in the market
here are the risk you can keep for the grade.
1st grade=10% maximum
2nd grade= 7% maximum
3rd grade= maximum 3%
4th grade= maximum 1.5%
I can give you information for free that may increase your win rate; that is what iam going to tell you today
the secret of trading multi time frame is not choosing 2 time frame that you like, but instead choosing what is the pair time frame THAT WORKS!!,you can use.
HERE ARE THE PAIR TIME FRAME THAT GIVES MORE WIN RATE:
SCALPING; 15 MINS- 1 MINS
DAY TRADING; 4H-1H-15MINS
SWING TRADING; W-D-4H
POSITIONAL TRADING; M-W-D (FUNDAMENTAL ANALYSIS NEEDTED )
IN NEXT POST I WILL TEACH ABOUT MIDDLE TF LEVEL OR BIG SCREEN LEVEL THAT WORKS IN THE SMALLER TIMEFRAME ,
THANKS FOR THE TRADINGVIEW TEAM THAT SREADING THIS INFORMATION!!

WHAT IS PAIRED TIMEFRAME AND THE SECRET BEHIND ACCURACY AND RR! sorry for late signal but it will hit it you can ask any question about it
HOW TO USE MULTIPLE TIME FRAME ANALYSIS??
Iam trading for more than 10 years and i used every trading tools and strategies , example; order flow, sentiment, renko system ,point and figure and other very strong strategies but i understood this forex market is fractal(meaning what u see yesterday that repeats again and again in any time frame, so i found that multiple timeframe analysis is best, in past traders use only moving average and 1- days or 10 days closes breaks they generate bout 80% a year that time, but now brain have improved and people found so many techniques with that tools now we can generate any% of money, yes iam serious, now traders making more than banks, at the same time people losing more than bank,, but its natural because when you sell there should be a enough buyer that's vice versa for buying too, so i know so many strategies and in internet there are some 1st grade strategy, what is 1st grade
grades of strategy:
( grades are not based on risk to reward because quality is important more than quantity )
1st grades: minimum more than 90% accurate, minimum 1 risk to reward
2nd grade: more than 75% minimum 1 risk to reward
3rd grade; minimum 60% accurate minimum 1 risk to reward
4th grade: minimum 55% accurate minimum 1.05 risk to reward
i use 1st grade strategy i developed step by step even if i teach you you cannot trade like me because its the personality that matches not the knowledge, you can have 1st grade accurate even if you use only support and resistance but if it not matches your personality(meaning: patience limit, psychology, emotional intelligence, you may ask that if we had that type of accuracy you can become a billionaire yes you can but accuracy is not the judge weather you can earn a billion in trading its, the plan that desides you can make billion or million, you can have 98% accuracy but you cannot make billion or million with 0.01 yes but even you throw 1000 lots you cannot because you got 2% against your winning so you can see the billionaire traders as proof in the real world that accuracy is not matters but risking plan matters
what determines risk?
your risk is determined by the grade you have in the market
here are the risk you can keep for the grade.
1st grade=10% maximum
2nd grade= 7% maximum
3rd grade= maximum 3%
4th grade= maximum 1.5%
I can give you information for free that may increase your win rate; that is what iam going to tell you today
the secret of trading multi time frame is not choosing 2 time frame that you like, but instead choosing what is the pair time frame THAT WORKS!!,you can use.
HERE ARE THE PAIR TIME FRAME THAT GIVES MORE WIN RATE:
SCALPING; 15 MINS- 1 MINS
DAY TRADING; 4H-1H-15MINS
SWING TRADING; W-D-4H
POSITIONAL TRADING; M-W-D (FUNDAMENTAL ANALYSIS NEEDTED )
IN NEXT POST I WILL TEACH ABOUT MIDDLE TF LEVEL OR BIG SCREEN LEVEL THAT WORKS IN THE SMALLER TIMEFRAME ,
THANKS FOR THE TRADINGVIEW TEAM THAT SREADING THIS INFORMATION!!

Nifty Bank Point and Figure Bank Nifty is bullish, has countered the long red vertical column recently and is now moving higher with momentum. Price stalled occasionally exactly at that level before moving higher again(highlighted area). Chart also includes a short term harmonic pattern and gann levels.

TATACONSUMER Double Top in Point and Figure Chart with Breakout Double Top Buying Breakout.
CMP: 679.80;
ATR : 56.10;
Adding into breakout level and making target : 729.30
with SL : 665.10 close base 1 day...
Risk is yours and Reward is too yours totally

Adani Gas : Strong Bullish Pattern Found. Adani Gas :
Formed Point and Figure Chart: Breakout:
Indicator Awesome : BUY Mode.
And also Breakout above 50DMA.
So, if it will breakout 144.05, We should buy it,
For Target : 161.4 (Exit here your half position).
and Stop Loss: 125
And if it will sustain above 161.4, we will hold it with stop loss trailing 139.95 for further upside ...
NSE:ADANIGAS
Moreover Rectangle Pattern formed in Daily Chart in Candlestick Chart pattern too.
Range of Pattern: 17.5 points.
Risk is yours and Reward is too yours totally.

Acrysil- all set to fire upA Little introduction on the fundamentals...
for details on the Q1 financial's analysis, check my post on this thread.... forum.valuepickr.com and here is the summary of the numbers break up... drive.google.com
the cyclical play in quartz as a new age material to grab to sink market share seems to be beginning an uptrend..
acrysil being one of the 4 companies in the world to manufacture these sinks with a distribution network spread over 43 countries, with particular hold of the uk market via a 98percent own subsidiary homestyl uk has the reach to cater to this cycle...
the company's activity speaks for the same, with rapid expansion of capacity, peaking of advertising expenses , opening up new distribution networks and recently grabbing new customers who handle retail chain internationally, successful pass through of the inflated input cost to the customers, finally a robust q1 result with drastic uptick of realization in the sink business at the same time adequate clearing of inventory during the quarter, should tickle the market to give the valuations the company deserves...
while the company has been maintaining the bullish stance on the bath segment, which is yet to show the traction street expects, the subsidiaries put up a lukewarm show in the number sin the quarters, putting up a record low ebitda margin..
how ever the sink business with good volume growth and realization was enough to absorb the head winds from the muted subsidiary business numbers, forex losses on finance cost and a 40percent inflation of input const since 1 year and has ended the quarter with commendable margin of 13.4% , which is near equivalent to q1fy19 when the crude was low and the resin costs hadnt gone up 2.5x and the rupee was high...
the company guidance to the street was 20percent uptick in the topline with margins of around 16 percent...
in the quarter they finished with 30percent yoy and 19% qoq topline growth, with ebitda growing 90percent in the standalone business..
EBITDA- 808.26L
EBITDA adjusted with forex loss/gain-
growth is 38.63% yoy and 64.6% qoq
PAT growth yoy 16.66% and qoq is 77.14%
maintaining the current runrate, over next 3 quarters, the company would end up with 40percent growth in earnings after tax..
further tailwinds from softening crude , appreciating rupee , sternhagen bath sgment launch into the uk market which is planned from q2, and better performance from the subsidiaries, should lead to further growth over next few quarters..
the other expense segment has shown a uncanny uptick this quarter, reason for which i will be clearing in the concall, most probably there would be some one off item there, which if is not incurred in the following quarters , will aid the margins further....
foot note, the sternhagen concrete tiles which the company will be starting production this financial year, regarding which the company is very bullish, not only as a branded product but also oem supplying opportunities , might also be priced in soon enough at the top of the euphoria, as the company is going to be the second one in the world to be producing the segment...
Considering the scenario where the business is back on track after the shock from the input cost hyperinflation, and the demand uptick to absorb the newly installed incremental capacity,
price targets are as high as 1079 on the charts...
how ever a modest target of 795 seems easily achievable over the next six months...
targets have been derived from the point and figure chart
disclaimer.... invested
not an investing/trading recommendation

HINDUSTAN UNILVER POINT AND FIGURE CHARTIT IS SHOWING DOUBLE TOP WITH THIS CHART BUT IF A CROSS CLOSES ABOVE LINE IT MAY SHOW SOME UP MOVE
