BITCOIN 3 rd wave in progress.this weekly chart of BITCOIN has tried to capture its wave progression .
1st wave of of ungoing 3 rd wave is in progress.
2 nd wave in this main chart has retraced 50 percent of 1 st wave. in november 2022.
Now 5 th wave of 3 rd wave is in progree.
normally it should terminate at 127000.
This is not any trading recommendation.
It is my study only.
But bullishness of Botcoin is obvious.
If this study helps you like this post.
follow me to get updates.
Search in ideas for "prog"

Aarti Industries: Elliott Wave Analysis – Progression ...Aarti Industries: Elliott Wave Analysis – Progression of Intermediate Wave 4
Aarti Industries, a key player in the specialty chemicals sector, is currently progressing through Intermediate Degree Wave 4 in its broader Elliott Wave structure. This analysis outlines the key phases of Aarti Industries' price action, including the formation of its primary and intermediate waves, and provides insights into the current corrective phase.
Aarti Industries is currently in the process of forming Intermediate Degree Wave 4, with a triangle pattern likely unfolding. The stock has completed the initial corrective waves (A, B, and C) and is now expected to progress through Wave D and Wave E before completing the pattern.
The targets for the remaining waves are as follows:
Wave D is expected to target Rs. 685-700.
Wave E may bring the stock price down to the Rs. 500-520 range.
It’s important to note that this analysis is based on the principles of Elliott Wave theory and is subject to change as market conditions evolve. This report is for informational purposes only and does not constitute a buy or sell recommendation.

Advanced Enzymes - Progressive breakoutWith progressively good results..the company could move ahead.
New breakout above 395 with stoploss below 365.
Once the stock can cross 417 there will be much more progress.

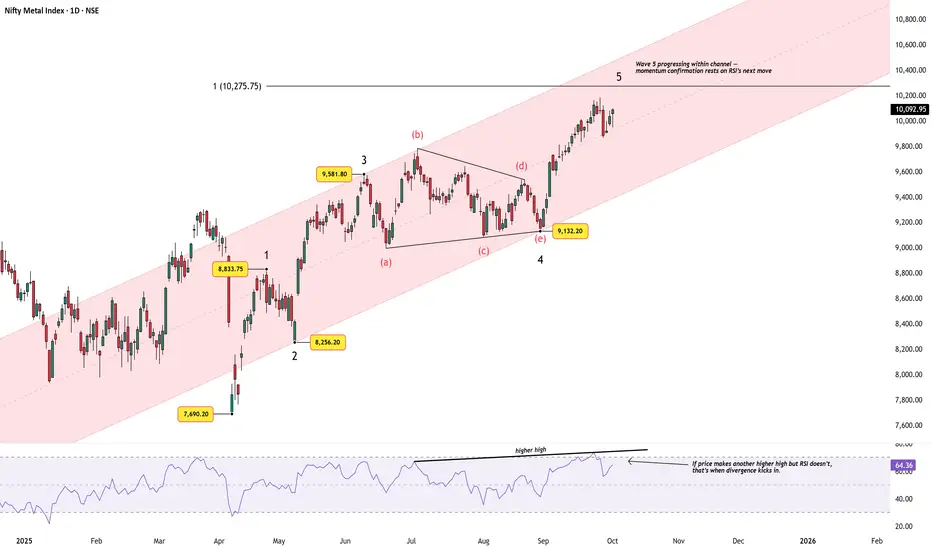
Nifty Metal Index – Fifth Wave Progression Within ChannelChart Structure:
The Nifty Metal Index continues to respect its rising channel, now advancing in Wave 5 after a clean contracting triangle in Wave 4. The impulse structure remains intact, with price steadily hugging the channel’s midline and now stretching toward the upper half.
Elliott Wave View:
Wave 1 topped near 8,833.75, after a strong rally from 7,690.20.
Wave 2 retraced into 8,256.20, holding close to the 0.382 retracement of Wave 1.
Wave 3 extended sharply to 9,581.80.
Wave 4 unfolded as a clean contracting triangle (a–b–c–d–e), ending at 9,132.20.
Wave 5 is currently progressing within the channel, with price advancing to 10,275.75, towards the 1.0x Fib extension level of Wave 1 projected from Wave 2.
Momentum Check:
RSI has confirmed the latest higher high, keeping momentum aligned with price. The key to watch now: If price makes another higher high but RSI fails to do so, that’s when bearish divergence would emerge.
Summary:
The index maintains a constructive Elliott Wave structure, but we are in late-wave territory. The channel provides a natural guide — holding the midline favors further upside, while a sustained breach of the lower channel would warn that Wave 5 has matured.
Disclaimer: This analysis is for educational purposes only and does not constitute investment advice. Please do your own research (DYOR) before making any trading decisions.
XAUUSD GOLD Wave C down in progressXAUUSD 4H chart : trading in a channel with ABC CORRECTIVE WAVE..
of which wave C is in progress hence "sell on rise" mode..
Within WAVE C internal impulse 5 wave down in progress... of which wave 3 down in progress
confluence level comes near $2385.. if broken than more downside towards 2265-2250

UNO Minda – Potential Wave V Extension in Progress - BuyUNO Minda completed its larger degree Wave V on 8 Jul 2024, followed by a correction in the form of a flat, which ended on 7 Apr 2025.
Since then, the stock has been in a fresh impulsive sequence:
Wave (i) completed on 21 Apr.
Wave (ii) unfolded as a simple flat, ending on 2 May.
Wave (iii) matched the length of Wave (i) (equality).
Wave (iv) again unfolded as a simple flat.
With Wave (i) and (iii) being equal in length, there is a high probability of a Wave (v) extension.
Currently, Wave (v) is unfolding:
Sub-wave (1) ended on 11 Jun.
A larger flat correction followed, completed on 1 Aug 2025.
Strong results for Q1’26, combined with increasing volumes and strong candles, confirm the possibility of a Wave V extension.
ub-wave (3) of (v) is now in progress.
Trading View
Buy at current levels (in which case maintain a stop loss of 1055) or buy on next correction.
Wave V extensions can stretch up to maximum of 1.618 × of Wave 0–iii.

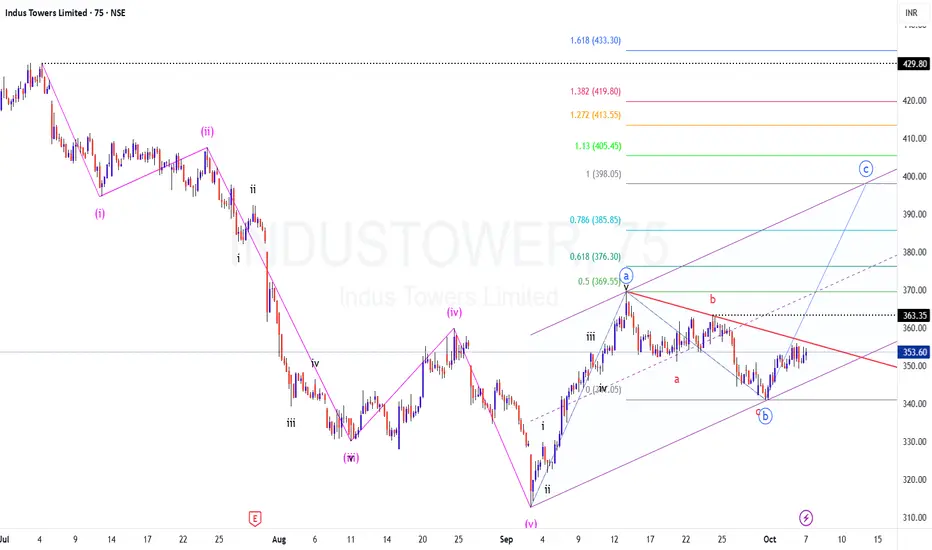
INDUSTOWER - Corrective Rise C in progress?
CMP: 352.5
TF: 75 Minutes
After a 5 wave decline from July 2025, the price seems to be going up now in corrective ABC rise.
The internal wave counts along with fib extensions are marked in this chart for better understanding.
The C wave in corrective patterns is more or less equal to 3rd wave in Impulse structures. hence, this move could be the most rewarding one.
Ideal target is AB=BC, 100% extension.. but in worst case scenario, 0.618-0.786 can be expected on the safer side. In here, the levels are placed at 375-385-395
Lets see how it progresses from here on..
Entry could be after the breakout & retest of the falling trendline (Red)
Disclaimer: I am not a SEBI registered Analyst and this is not a trading advise. Views are personal and for educational purpose only. Please consult your Financial Advisor for any investment decisions. Please consider my views only to get a different perspective (FOR or AGAINST your views). Please don't trade FNO based on my views. If you like my analysis and learnt something from it, please give a BOOST. Feel free to express your thoughts and questions in the comments section.
BSE Ltd – Corrective W–X–Y In ProgressThe previous impulsive wave topped at ₹3030, marking an all-time high.
Since then, the structure has unfolded as a W–X–Y corrective double three. The market is now progressing within Wave Y, with Wave (a) already driving price down to ₹2090.
For Wave (b), watch for price rejection either at the midline of the channel or the upper boundary. A rejection from these levels should lead Wave (c) lower, targeting the 0.5–0.618 retracement zone between ₹2128 and ₹1915, where Wave Y may complete.
RSI is oversold and continues to print lower lows, showing no bullish divergence yet — momentum still favors the bears.
Bearish invalidation sits at ₹2550 — any sustained move above this would negate the immediate bearish view.
Disclaimer: This analysis is for educational purposes only and does not constitute investment advice. Please do your own research (DYOR) before making any trading decisions.

Nifty Auto - Good setup in progressDisclaimer- Details shared here for learning purpose only. Do your individual analysis or consult an advisor before taking a trade.
Nifty auto - Good setup is progress. ~24230-24240 is key. Post that should see a good movement. Of course all this is subject to the tariff tantrums. Look for strong stocks within the index or explore the ETF route to plan your trade.

Sinclair Hotels Ltd. – IPO Base Breakout in Progress.Sinclair Hotels Ltd. – IPO Base Breakout in Progress 🏨
Key Insights:
1️⃣ Breakout Potential:
The stock is testing the April 2024 resistance level and is on the verge of an IPO base breakout.
A confirmed entry above ₹138.5, preferably after a day-close confirmation, strengthens the setup.
2️⃣ Volume Surge:
Recent sessions have witnessed 5x volume spikes, indicating strong institutional or retail interest, which adds credibility to the breakout attempt.
3️⃣ Fundamentals:
Solid ROE (Return on Equity) and ROCE (Return on Capital Employed) metrics highlight financial strength.
However, as a microcap, it requires extra caution due to potential volatility.
Trading Strategy:
Primary Setup:
Entry: Above ₹138.5 (post a daily close confirmation).
Stop Loss (SL): ₹117 (Closing Basis).
Target Zones: Medium-term upside could be significant, depending on momentum post-breakout.
Risk Management:
Position sizing is critical, given the stock's microcap nature, which may result in sharp moves.
Key Notes for Traders:
Watch for volume confirmation during the breakout attempt. Sustained high volumes would validate the move.
Be mindful of broader market conditions, as microcaps are particularly susceptible to bearish sentiment.
Sinclair Hotels Ltd. presents an exciting breakout opportunity for those willing to embrace calculated risk. Patience is key—let the stock confirm its strength!
And please, as always, Do your research. Enter only if you understand the risk. GoodLuck!

UNITDSPR - United Spirits - 4th wave In Progress?CMP: 1516
TF: Daily and 75 Minutes
from the Swing low of 712, it appears that the script has completed 3 waves so far and 4th in play.
On Shorter TF, it looks like A and B are done.. C is in progress. If this plays out, the fall will be quick and strong.. on watchlist for the next couple of weeks (Dec 9 to 25)
There is also a case for Inv H&S formation.. Something the people with Bullish view can keep an eye on..
For my short bias, the SL is 1561
I am not a SEBI registered Analyst. Views are personal and for educational purpose only. Please consult your Financial Advisor for any investment decisions.

4th wave in progress Major 3rd wave, in that minor 4th wave is in progress. All levels are mentioned on the chart. Wave 2 is short, so we can expect the 4th wave to be deep, possibly retracing more significantly before the final 5th wave upward completes the structure

Correction in progress,Bull market is on.The study for nifty is from june 2022.
of course I may update this study with another
weekly chart.there we can see major out look.
From june 2022 five wave up move completed on dec 22
that is wave 1 shown in bracketed black lettered 1.
There was 50 percent pull back of this wave in wave 2
which ended in marvh 23.that I have lebelled as bracketed black
lettered wave 2.
from march 23 another up move started.
and it has completed five wave,in which 3 rd wave is extended in sept23.
I have market as larger letter 1 in black and its pull back is now in progress.
still the braketted 3 in black colour pending,
this up move from march 23 to sept 23 can't be bracketed 3 as in that case
it will be shorter than bracketed 1 which was completed in dec 22.
Bull market in indian stock market is still on.
the present pull back has already retraced 23.6 percent.
we may discuss in hourly chart what is happening in shorter time frame.
if this post helps you then please like it.
Follow me to get up dates.

Nifty Reversal ,Progress and Current Status In the video I explained how Nifty got reversed, progressed and current status Also the trades one could do Positional as well as intraday

Equitas Small finance bank - Trend reversal in progressEquitas Small finance bank - Trend reversal in progress. Looking good for a target of 70 with a small SL below of 48.

Lauras Labs - Stage 4 in progressLauras Labs - Stage 4 in progress. Entire sector facing headwinds.
Only for educational purposes.

Divis Laboratories - Stage 4 in progressDivis Laboratories - Stage 4 in progress. Severe breakdown after poor future outlook after results commentary. Head and shoulder breakdown. Lower low formation. Key support broken.
Only for educational purposes.

R K Forge - Base formation in progressR K Forge - Base formation in progress. Can look for breakout after base completion.
Let's see how results come out.
Only for educational purposes.

Nifty 50 Double Top Formation in progressNifty 50 Double Top Formation in progres
targets are mentioned in chart
DT will success below 16462
target 16134

Sequent Scientific - New 52 week low...stage 4 in progressSequent Scientific - New 52 week low...stage 4 in progress. Sector headwinds.
Case study of stage analysis.
Only for educational purposes.

SBILIFE long trade in demand zone and bullish candle in progressSBILIFE looks good long trade as a bullish engulfing candle in Daily timeframe demand zone is in progress. Entry 1140-1144 with stoploss of 1104 for targets 1180,1210.

#WIPRO - Bulling harmonics formation in progress#WIPRO - Bulling harmonics formation in progress. Expecting a good up move. Let's see

ZEEL Flag pattern in progressZEEL seems to be very bullish.
A clear flag pattern formation in progress. It can blast of any time.
My analysis says: Once It reaches RSI ~ 63, this event could take place. Do keep a watch. RSI Trendline has been marked in the chart.
Current price level is supported by a major long term support (represented by dotted line).
Disclaimer: I am not sebi registered. This chart is for educational purpose. Pls consult your technical advisor before investing.
