"TCS" Short A Sensible Trade A nice Pick for a swing/ positional trade for this week is a short trade of TCS, Because the market NIFTY is overbought & is the world's most expensive market based on PE valuation so its better to short rather than to buy anything in nifty 50, and a recent filter showed TCS as overbought technically and seems to have formed a double top and is moving down, The Targets and the Resistance are marked on the chart, the indicators that were conforming the short were MACD, RSI, STOCHASTICS, BOLLINGER BANDS, ADX.
The Target 1 -Level is a stronger level because of Fibbonacci reteracements 0.61.8 & is a swing low.
Good Luck.
Search in ideas for "stochastic"

Coal India - Long term investment BUYA clean A-B-C structure
A clean 5 wave sub-wave structure in C
A falling wedge
Positive divergence in RSI ( 9 and 14 period )
Positive divergence in MACD ( Fast and Slow )
Positive divergence in Slow Stochastics
Bearish below 225 on weekly closing basis.

L&T Finance Holdings Theta DecayL&TFH isnt able to break 210 handle as u see doji/shooting star/spinning tops it seems there is pressure on upper side
North Korea problem has resurfaced so my bet is that it would be hard to Breach 210 for this Month
Macd seems to be going to converge on side side
Stochastics shows overbought stock so it will retrace or consolidate before new rally
L&TFH 210 CE is @ 3.45 so 3.45*4500=15525 profit if L&TFH stays below 210 at expiry
you can book profit midway or trail it with stoploss once in profit and if it Breachs 210 then we book our Losses

Bullish Hidden Divergence On Cards For “PEL”Targets :3015-3235 Buy range :2850-2870 Stoploss :2710 Duration :4-5 weeks
Outlook :
The key observation on the price chart of Piramal Enterprises is that the stock has recently registered a breakout above the upper band of the falling channel encompassing the entire decline since June 2014 high of Rs 3088.95. It signals end of the corrective phase and start of a fresh up leg.
The stock currently rebounded taking support at or around the crucial support area of Rs.2775-2780 being the 61.8% retracement of the previous rally from Rs.2582.55 to Rs.3088.95, which also coincides with the monthly pivot levels as can be seen in the adjacent chart. In the process the stock has formed a major higher trough in the Daily chart
In the process charts also witnessed A “Hidden Bullish divergence in which stock prices making a Higher Highs, whereas oscillators(14-RSI), making a Lower Lows, which Indicates underlying strength and which occurs during retracements in an uptrend, suggesting good entry levels.
Stock is trading above its medium term (50-DMA) and Longer term(200-EMA), among oscillators the daily stochastics has recently generated a buy signal and +DI has crossed above -DI thus validates positive trend in price
We expect the stock to continue its current uptrend and head towards its previous highs in the coming weeks and hence recommend a Buy in this particular stock. Entry and Exit levels are mentioned above.

Nandan Denim - Buy Target 160Nandan Denim - Buy Target 160
Based on Stochastics and resistance/support

RELIANCE ShortReliance has been a true star that practically carried Nifty for some time.
Now it's time for a breather. The rally looks tired.
Notice the indecisive price action at 1600 level (encircled).
Also there is divergence in the stochastics as seen in CCI.
Should be a low risk trade to go short with a stop above 1620 and target of 1505 (just before 1500 to be safe)

Tata Steel: May offer a better buy priceThe stock moved out of the triangle pattern on the hourly chart, made a high of 525.65 and has been consolidating since then.
On the hourly chart the price action is indicating that the stock might pullback below 521 level before continuing the up move.
Reasons being:
1. Lot of volume effort at the 521-526 level with little action on the upside.
2. Secondly, stochastics has been showing signs of divergence.
I would rather wait for the pullback and confirmation signal before buying near 505-515 zone.
#One has to be careful as the stock pulls back deep into the patterns or the ranges from which it breaks out (means wider SL needed if buying).
This is just an analysis and not an investment advice.
Analysis on hourly time frame means it is for short to medium term.
Thanks

Inverted Head and Shoulder likely in a day or twoNSE:ABBOTINDIA
screencast.com
Very optimistic about AbbotIndia breaking the crucial resistance of 4330 in a day or two and completing inverted head and shoulder pattern. Bullish divergenes on both Stochastics and RSI is further evidence of strong bullish sentiments. Go long as soon as it crosses 4330-4035 with high volume.

Edelwiess - Dark Cloud CoverThis is a classic pattern that has formed with Edelwiess. This dark cloud cover pattern meets all the criteria that you would look for while trading such patterns.
1. The previous white candle body is long
2. There is a recent spike in volumes in the earlier trading ranges
3. The previous white candle has a gapped up opening
4. Stochastics are at an overbought position
5. The dark candle opens much above previous days trading range
On the lighter side, when stocks are featured in major news channels, it is a good time to take the opposite position in the markets.

Axis Bank review before results1) 3 rd wave looks like to complete
2) extended AB=CD
3) 61.8 RET. of full upward swing
4) rsi oversold zone 4
5) positive divergence on slow stochastics
6)Any good pullback from here is good selling opp...

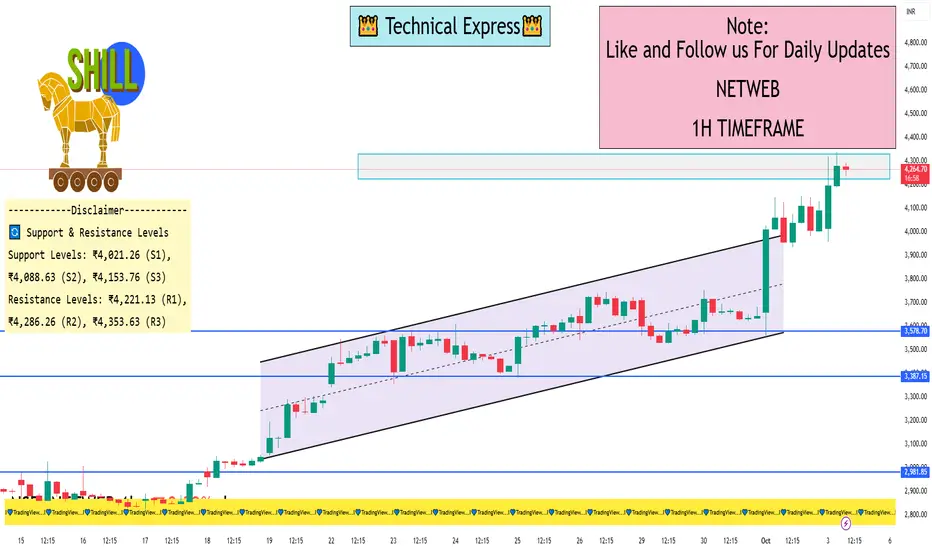
NETWEB 1 Hour ViewNETWEB is trading at ₹4,216.00, reflecting a 3.79% increase from the previous close.
📈 1-Hour Technical Analysis (as of 10:43 AM IST)
Based on intraday data, here are the key technical indicators for NETWEB on the 1-hour timeframe:
Relative Strength Index (RSI): 81.37 — indicates the stock is in the overbought zone, suggesting potential for a short-term pullback.
Moving Average Convergence Divergence (MACD): 395.90 — confirms a strong bullish momentum.
Average Directional Index (ADX): 60.55 — suggests a strong trend in the market.
Stochastic Oscillator: 89.93 — indicates the stock is in the overbought zone.
Super Trend: ₹3,386.37 — supports the current upward movement .
Williams %R: -4.50 — suggests the stock is in the overbought zone.
🔄 Support & Resistance Levels
According to pivot point analysis, the key support and resistance levels for NETWEB are:
Support Levels: ₹4,021.26 (S1), ₹4,088.63 (S2), ₹4,153.76 (S3).
Resistance Levels: ₹4,221.13 (R1), ₹4,286.26 (R2), ₹4,353.63 (R3).
The current price of ₹4,216.00 is near the R1 resistance level, indicating potential for a breakout if the price surpasses this level.
📊 Trend Analysis
The stock is exhibiting strong bullish indicators across multiple timeframes, including the 1-hour chart. The RSI, MACD, and ADX all suggest a continuation of the upward trend. However, the overbought conditions indicated by the RSI, Stochastic Oscillator, and Williams %R suggest that traders should be cautious of potential short-term pullbacks.
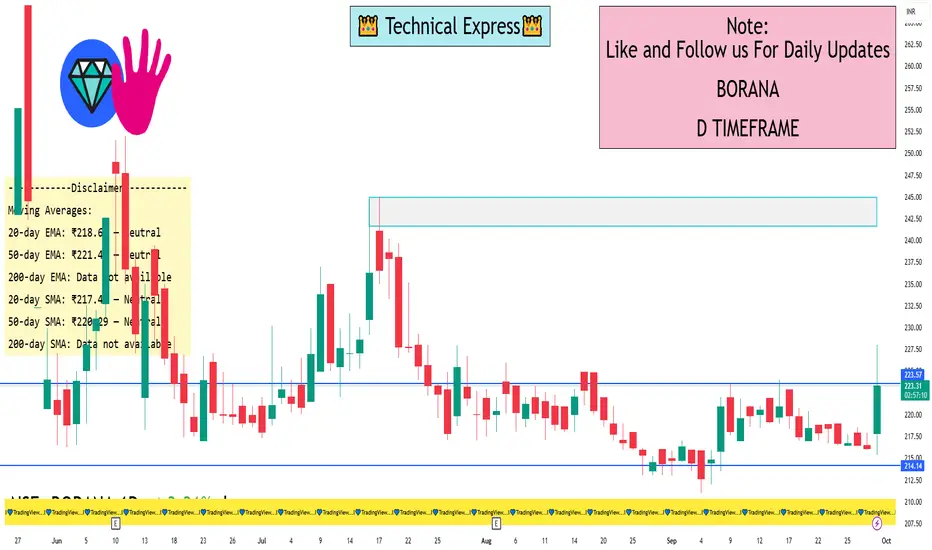
BORANA 1 Day ViewBORANA is trading at ₹222.33, reflecting a 2.86% increase for the day.
📈 1-Day Technical Overview
Opening Price: ₹217.85
Day’s Range: ₹215.35 – ₹228.00
Closing Price: ₹222.33
Volume: Approximately 166,570 shares traded
🔍 Key Technical Indicators
RSI (14): 60.94 — Neutral to bullish, indicating moderate buying interest
MACD: 0.24 — Bullish, suggesting upward momentum
ADX (14): 19.01 — Neutral, implying no strong trend direction
Stochastic RSI: 0 — Strong downtrend, caution advised
Williams %R: -37.15 — Neutral, no clear overbought or oversold signal
Moving Averages:
20-day EMA: ₹218.62 — Neutral
50-day EMA: ₹221.40 — Neutral
200-day EMA: Data not available
20-day SMA: ₹217.44 — Neutral
50-day SMA: ₹220.29 — Neutral
200-day SMA: Data not available
📊 Summary
The stock is experiencing a positive intraday movement, trading above its opening price and near the day's high. While the RSI and MACD indicate moderate bullishness, the Stochastic RSI suggests a potential downtrend. Investors should monitor these indicators closely for any signs of trend reversal or continuation.
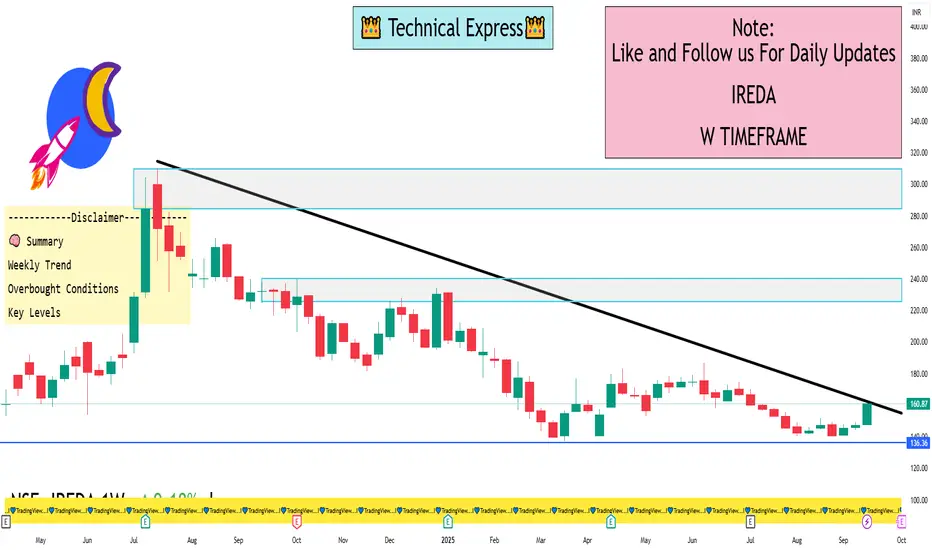
IREDA 1 Week View📈 Current Price & Trend
Latest Price: ₹160.87
Weekly Change: +9.14%
52-Week Range: ₹137.01 – ₹239.90
Market Cap: ₹45,192 Cr
🔍 Technical Indicators (Weekly)
RSI (14): 62.41 — Neutral to Bullish
MACD (12,26): 0.05 — Slight Bullish Crossover
ADX (14): 23.78 — Neutral Trend Strength
Stochastic RSI: 85.02 — Overbought Signal
Williams %R: -9.76 — Overbought Signal
CCI (14): 171.45 — Overbought Signal
ROC (14): 6.10 — Bullish Momentum
📊 Moving Averages (Weekly)
5-Day EMA: ₹149.41 — Bullish
10-Day EMA: ₹147.30 — Bullish
20-Day EMA: ₹146.27 — Bullish
50-Day EMA: ₹150.48 — Bullish
100-Day EMA: ₹158.11 — Bearish
200-Day EMA: ₹172.56 — Bearish
🔁 Pivot Levels
Support Levels: ₹145.02 (S1), ₹142.23 (S2)
Resistance Levels: ₹161.88 (R1), ₹158.12 (R2)
Pivot Point: ₹151.57
🧠 Summary
Weekly Trend: Bullish momentum with a strong uptrend.
Overbought Conditions: Indicators like Stochastic RSI, Williams %R, and CCI suggest potential short-term pullback.
Key Levels: Watch for support at ₹145.02 and resistance at ₹161.88.
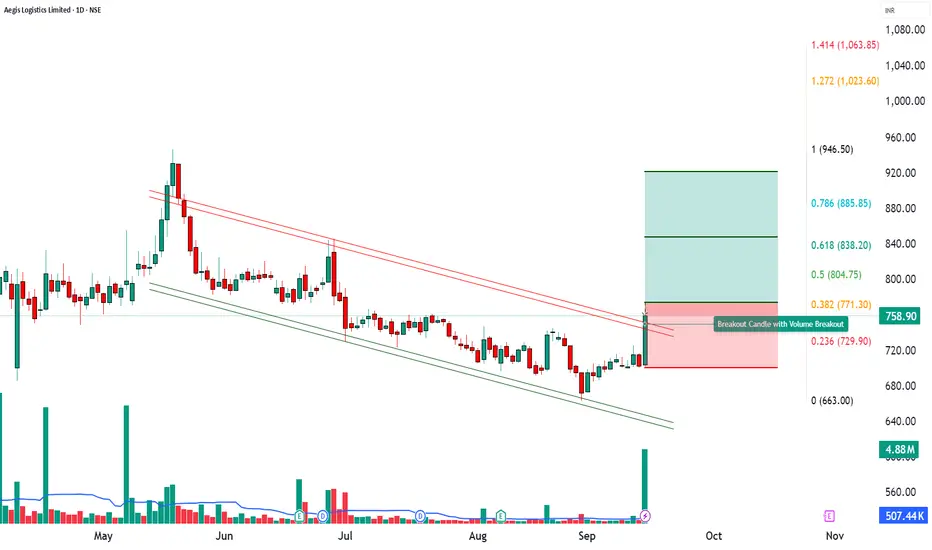
“Aegis Logistics | 20x Volume Breakout Signals Fresh Upside MomAegis Logistics Ltd (CMP: ₹758.90 | +8.07%)
🔎 Technical Outlook:
Aegis Logistics witnessed a 20-day volume breakout with an extraordinary 20X spike in price-volume activity, signaling strong market participation. The stock formed a powerful bullish candle, indicating robust momentum and accumulation interest.
The breakout above recent consolidation zones suggests the potential for a trend continuation if follow-up buying sustains.
________________________________________
📈 Key Levels:
Entry Zone: ₹774
Stop Loss: ₹700.25
Support Levels: 715.5 / 672.1 / 642.85
Resistance Levels: 788.15 / 817.4 / 860.8
Major Resistance Zone: ₹946 – ₹995
________________________________________
🎯 Upside Targets:
Target 1 → ₹847.75
Target 2 → ₹921.50
Target 3 → ₹995.25
Target 4 → ₹1,069
________________________________________
⚡ Why Bullish?
20-Day & 52-Week Volume Breakout confirmation
RSI, Stochastic & MACD supporting bullish bias on daily & weekly charts
Strong momentum candle near breakout zone
Rising interest seen from institutional volumes
________________________________________
📢 Summary:
Aegis Logistics is entering a high-momentum zone. Sustaining above ₹774 can trigger multi-level rallies toward ₹921–₹1,069 in the coming sessions. However, a dip below ₹700 will negate this bullish structure.
📰 Latest News
Aegis Logistics shares surged ~10% in a single day, driven by strong volumes. It was the stock’s highest single-day gain since March. Trading volume hit a four-month high (~31 lakh shares) much above its 20-day average. Business Today
The stock exceeded its 50-day moving average around ₹724, touching resistance zones around ₹763 to ₹772 (100- & 200-day moving averages). Business Today
Additional longer-term news: The joint-venture Aegis Vopak Terminals (AVTL) is planning a ₹2,800 crore IPO to reduce debt and fund expansion; Aegis Logistics has ~50.1% stake in that JV. The Economic Times
Also, an in-principle approval for a new LPG siding (rail facility) at Panambur (New Mangalore Port) for AEGIS Vopak was granted by Palakkad railway division. This could improve LPG logistic flows. The Times of India
📈 Investment Outlook
Aegis Logistics delivered a strong 20-day volume breakout (VolX ≈ 20x) with a sharp bullish candle. Technical momentum plus upcoming catalysts like the JV IPO and new LPG siding approval are fueling sentiment.
________________________________________
📈 Bullish Case – Why the stock could go up
High-volume breakout (20x average) signals institutional accumulation.
Momentum indicators: RSI 63, CCI 177, Stochastic 86 – still bullish.
Sustaining above ₹774 can open upside toward ₹847 – ₹921 initially, then ₹995 – ₹1069.
Positive news: JV IPO plans and LPG siding approval provide structural growth drivers.
📉 Bearish Case – Potential downside risks
Resistance near ₹788 – ₹817 may trigger profit booking.
Failure to sustain above ₹774 could lead to correction back toward ₹729 – ₹715.
Sectoral risks: energy/logistics costs, regulatory delays may hurt sentiment.
⚡ Momentum Case – Short-term Trading Edge
20x volume + bullish MACD on daily and weekly = strong near-term edge.
Bollinger Band breakout adds volatility momentum.
Holding ₹774 may fuel a rally toward ₹847 – ₹921 in 2–5 sessions.
📅 Short-term vs Long-term Perspective
Short-term (1–2 weeks): Test of ₹847–₹921 likely; supports 729–715 are critical.
Long-term (1–3 months): Sustained breakout plus IPO news flow can re-rate stock higher toward ₹995–₹1069.
________________________________________
⚠️ Disclaimer – Please Read Carefully
The information shared here is meant purely for learning and awareness. It is not a buy or sell recommendation and should not be taken as investment advice. I am not a SEBI-registered investment advisor, and all views expressed are based on personal study, chart patterns, and publicly available market data.
Trading — whether in stocks or options — carries risk. Markets can move unexpectedly, and losses can sometimes exceed the money you have invested. Past performance or past setups do not guarantee future results.
If you are a beginner, treat this as a guide to understand how the market works — practice on paper trades before risking real money. If you are experienced, always assess your own risk, position sizing, and strategy suitability before entering trades.
Consult a SEBI-registered financial advisor before making any real trading decision. By engaging with this content, you acknowledge full responsibility for your trades and investments.
💬 Found this useful?
🔼 Give this post a Boost to help more traders discover clean, structured learning.
✍️ Drop your thoughts, questions, or setups in the comments — let’s grow together!
🔁 Share with fellow traders and beginners to spread awareness.
👉 “If you liked this breakdown, follow for more clean, structured setups with discipline at the core.”
🚀 Stay Calm. Stay Clean. Trade With Patience.
Trade Smart | Learn Zones | Be Self-Reliant 📊
WIPRO 1D Time framw📈 Price Action
Previous Close: ₹255.75
Today's Close: ₹256.50
Daily Range: ₹253.00 – ₹257.00
Volume: 804,499 shares (significantly higher than the 50-day average of 369,496 shares)
52-Week Range: ₹228.00 – ₹324.55
🔧 Technical Indicators
Relative Strength Index (RSI): 63.59 — Indicates bullish momentum.
MACD: Positive — Suggests upward trend.
Moving Averages:
5-day MA: ₹254.50
50-day MA: ₹249.00
200-day MA: ₹265.00
Trend: Bullish, as the stock is trading above short-term moving averages.
Stochastic Oscillator: 76.47% — Indicates overbought conditions, suggesting potential for a pullback.
Average True Range (ATR): ₹0.05 — Indicates low volatility.
📊 Support & Resistance Levels
Immediate Support: ₹253.00
Immediate Resistance: ₹257.00
Pivot Point: ₹255.00
🧠 Trend Analysis
Trend: Bullish
Momentum: Positive
Volatility: Low
Summary: Wipro's stock is exhibiting a bullish trend with positive momentum. The current overbought condition, as indicated by the stochastic oscillator, suggests that the stock may experience a short-term pullback before continuing its upward trajectory. Traders should monitor the support and resistance levels for potential entry and exit points.

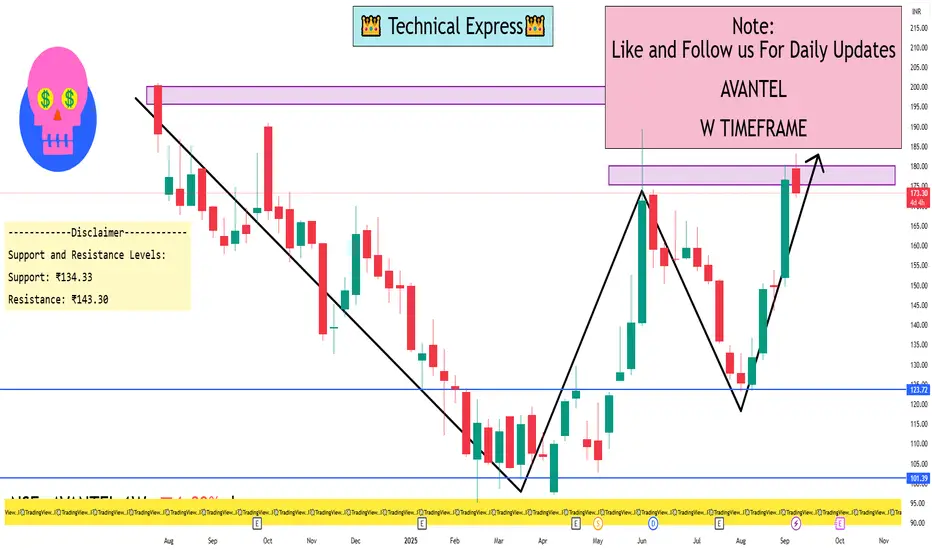
AVANTEL 1 Week ViewKey Technical Indicators:
Moving Averages: The stock is trading above its 200-day exponential moving average (EMA), indicating a long-term uptrend.
Stochastic RSI: The stochastic RSI is in the overbought zone, suggesting potential for a short-term pullback.
MACD: The Moving Average Convergence Divergence (MACD) is above the signal line, supporting the current bullish momentum.
Support and Resistance Levels:
Support: ₹134.33
Resistance: ₹143.30
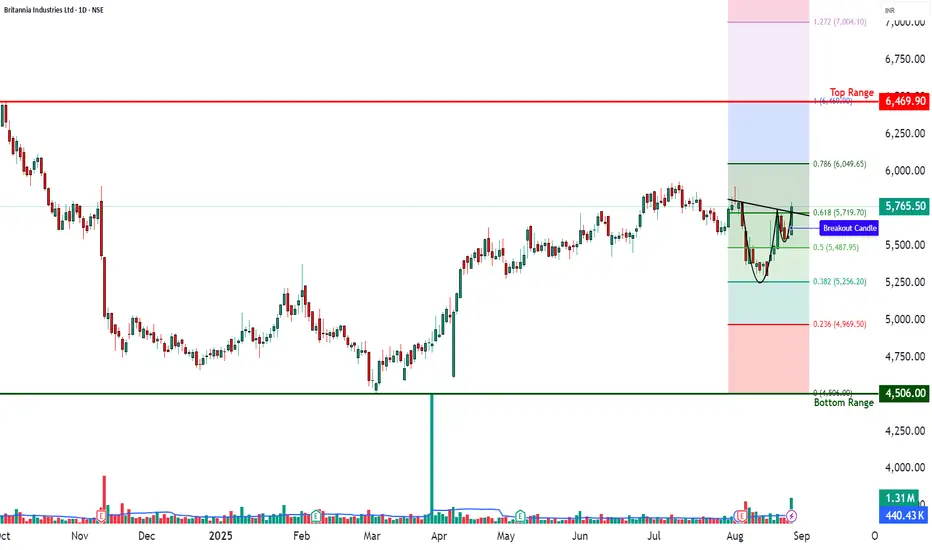
BRITANNIA - Cup & Handle Breakout Attempt📊 BRITANNIA – Technical & Fundamental Educational Snapshot
Ticker: NSE: BRITANNIA | Sector: FMCG – Packaged Foods & Biscuits
CMP: ₹5,765.50
Rating: ⭐⭐⭐⭐ (Bullish Setup – For Educational Purposes Only)
Pattern Observed: ☕📈 Cup & Handle Breakout Attempt
📊 Technical Observations
BRITANNIA (CMP: ₹5,765.5) is exhibiting a Cup & Handle breakout formation, confirmed by a strong bullish candle on heavy volumes. The stock has moved up from a recent bottom zone near ₹5,256–₹5,487 towards the neckline at ₹5,794, with key resistances placed at ₹5,848, ₹5,931, and ₹6,068, while supports are noted at ₹5,628, ₹5,491, and ₹5,408.
Technical indicators show RSI at 59 (breakout zone), a bullish MACD crossover, CCI at 76, and Stochastic at 94, highlighting strong upward momentum. The price action is supported by VWAP strength, and a Bollinger Band squeeze-off breakout, suggesting a possible trend continuation.
Volume surged to ~1.31M shares, significantly higher than the 20-day average of ~0.44M, indicating institutional participation. Based on the current momentum and technical structure, there is a strong possibility of breakout continuation; however, traders should carefully monitor the ₹5,628 and ₹5,518 levels as critical supports for risk management.
Britannia Industries has been in focus after analysts at PL Capital named it among their top stock picks, citing its strong positioning to benefit from India’s consumption revival. In its Q1 FY26 results, the company reported a consolidated net profit of ₹521 crore, up ~3% YoY, with revenues rising ~9% to ₹4,622 crore, though profitability fell short of street expectations due to higher input costs. Standalone performance was softer, with net profit down 0.8% YoY to ₹498 crore despite an 8.8% increase in revenue, reflecting margin pressure from raw material cost inflation. On the positive side, Britannia highlighted broad-based demand growth across both rural and urban markets and announced steps to boost the nutritional profile of its products by increasing whole grain content while reducing sugar and sodium, aligning with health-conscious consumer trends.
From a sentiment standpoint, the stock currently reflects a neutral to slightly positive bias. Bullish triggers include the ongoing consumption recovery, strong rural demand, analyst endorsements, product innovation, and sequential revenue growth. On the bearish side, rising input costs, weak standalone profitability, and rich valuations (P/E ~60) pose risks to near-term upside.
From an investment perspective, the outlook for Britannia remains mixed but constructive. On the bullish case, volume-led demand growth, health-focused innovation, and strong brand positioning could support further upside. On the bearish case, margin pressure and stretched valuations may limit near-term gains. In the short term (next few sessions), price action appears momentum-driven, supported by a bullish cup-and-handle breakout setup and strong institutional participation, making a continuation move possible in the next 1–2 days. Over the longer term (6–12 months), Britannia’s growth story remains intact provided cost pressures ease and the company sustains its demand momentum, aligning with PL Capital’s positive stance on the FMCG leader.
📊 STWP Trade Analysis – Under the STWP trade framework, one illustrative breakout scenario could involve a long entry near ₹5,794.50, with a protective stop at ₹5,518.40. In comparable past structures, price has tended to extend towards zones such as ₹5,848–₹5,880 (approx. 1:1 risk–reward), ₹5,931 (around 1:1.5 R:R), and ₹6,049–₹6,071 (approx. 1:2 R:R). If momentum accelerates, a stretch target may open towards ₹6,068 → ₹6,347.
An alternative, more conservative illustration could be a pullback entry in the ₹5,545–₹5,525 zone, with a tight invalidation stop at ₹5,518. A quick reaction pullback may also occur around the Fibonacci level of ₹5,719.70, before attempting a continuation higher. Upside zones remain aligned with the same resistance ladder (₹5,848–₹5,880 → ₹5,931 → ₹6,049–₹6,071 → ₹6,347).
Possible Demand Zone (Illustrative): ₹5,608.50 – ₹5,545
Stop Loss (tight): ₹5,537.90
Approximate Risk: ~₹70 per lot
⚠️ Risk Reminder:
Price momentum is strong but Stochastic readings are elevated, which may lead to volatility or shakeouts. Traders should trail stops actively (e.g., move SL to breakeven after T1, and under higher lows after T2). Market volatility, raw material cost changes, and broader FMCG index sentiment can influence outcomes. Past price behavior and backtests are illustrative only and do not guarantee future performance.
⚠️ Disclaimer – Please Read Carefully
The information shared here is meant purely for learning and awareness. It is not a buy or sell recommendation and should not be taken as investment advice. I am not a SEBI-registered investment advisor, and all views expressed are based on personal study, chart patterns, and publicly available market data.
Trading — whether in stocks or options — carries risk. Markets can move unexpectedly, and losses can sometimes exceed the money you have invested. Past performance or past setups do not guarantee future results.
If you are a beginner, treat this as a guide to understand how the market works — practice on paper trades before risking real money. If you are experienced, always assess your own risk, position sizing, and strategy suitability before entering trades.
Consult a SEBI-registered financial advisor before making any real trading decision. By engaging with this content, you acknowledge full responsibility for your trades and investments.
💬 Found this useful?
🔼 Give this post a Boost to help more traders discover clean, structured learning.
✍️ Drop your thoughts, questions, or setups in the comments — let’s grow together!
🔁 Share with fellow traders and beginners to spread awareness.
👉 “If you liked this breakdown, follow for more clean, structured setups with discipline at the core.”
🚀 Stay Calm. Stay Clean. Trade With Patience.
Trade Smart | Learn Zones | Be Self-Reliant 📊
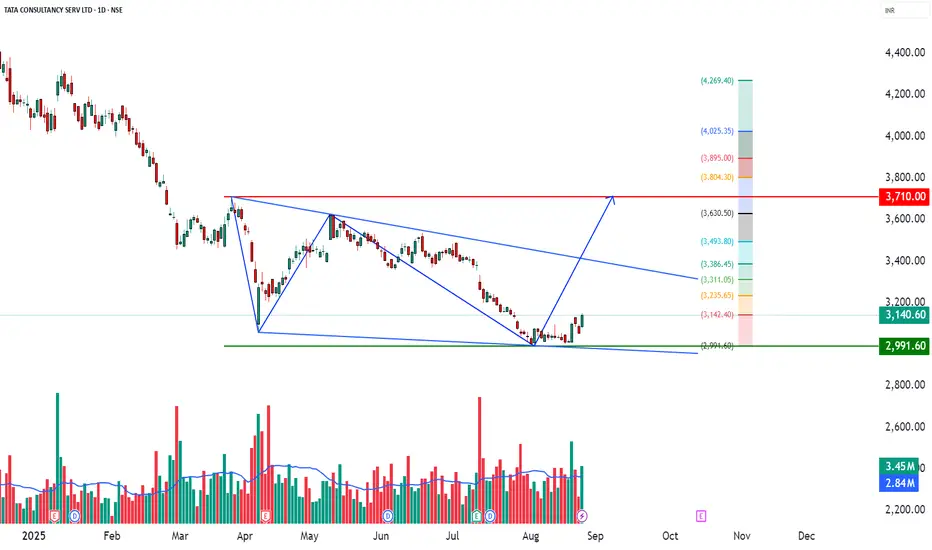
TCS – upport Bounce with Volume Confirmation📊 TCS – Technical & Educational Snapshot
Ticker: NSE:TCS | Sector: 💻 IT Services
CMP: ₹3,140.60 ▲ (+2.84% | 26 Aug 2025)
Learning Bias (for study purpose): ⭐⭐⭐ (Cautiously Bullish)
Pattern Observed: 📈 Support Bounce with Volume Confirmation
📰 Sentiment Analysis
👉 Overall Sentiment: Moderately Positive ✅
Bullish Drivers:
• Bounce from strong support near ₹3,000 with bullish candle & above-avg volume
• RSI breakout + Bollinger Band expansion → fresh buying interest
• Publicly available analyst reports indicate average estimates around ₹3,725; strong bullish case highlighted up to ₹4,610
• IT sector optimism for H2 FY26 earnings recovery
Risks (Bearish Case):
• Broader trend still marked Downtrend ⚠️
• Stochastic at 92 → overbought in short-term
• Employee layoffs & union protests (~12K–30K) may dampen sentiment
• Failure to hold ₹3,047 (support) could trigger deeper correction
Short-term Outlook: Upside momentum possible towards ₹3,160–3,200, but resistance supply zone must be watched.
Long-term Outlook: Positive — strong fundamentals, debt-free balance sheet, consistent dividends, and sector recovery cues.
📊 Technical Snapshot
TCS has formed a support bounce near the ₹3,000 bottom range, supported by a strong bullish candle and above-average volume.
Indicators: MACD bullish on daily/weekly, neutral-to-bearish on monthly.
RSI ~54 → healthy momentum without being overheated.
Trend direction still tagged as Downtrend, hence positional caution is advised.
📊 Volume Check
🔹 Current Volume: 3.45M
🔹 20 SMA Volume: 2.84M ✅
💥 Above-average participation → validates breakout reliability.
💡 Interpretation: Stronger demand from institutions/traders supporting price action.
💡 Learnings
Support bounces near psychological zones (₹3,000 in this case) often attract buying interest.
When combined with RSI breakouts, Bollinger Band expansion, and volume confirmation, the setup becomes more reliable.
However, overbought stochastic warns of possible near-term pullbacks — hence, stop-loss discipline is key.
📌 Key Levels
Resistance: 3,169 | 3,198 | 3,244
Support: 3,094 | 3,048 | 3,019
Fibonacci Reference Levels: 2,991 | 3,142 | 3,235 | 3,311 | 3,386 | 3,494 | 3,631
🎯 STWP Learning Reference
• Observed bounce zone: ~₹3,152
• Key support level: ~₹3,047
• Upside reference zones (if momentum continues): 3,200 | 3,244 | 3,310
• Pullback watch zone: 3,048–3,095
• Invalidation reference: Below 2,991 → momentum weakens
⚠️ Disclaimer – Please Read Carefully
This post is shared only for educational and informational purposes. It is not investment advice or a recommendation to buy/sell any security. I am not a SEBI-registered investment advisor. Please do your own research or consult a SEBI-registered advisor before making trading or investment decisions.
Trading and investing involve risk. Past performance or past setups do not guarantee future results. Always use stop-loss, proper position sizing, and risk management.
💬 Found this useful?
🔼 Boost this post to help more traders discover clean setups.
✍️ Share your thoughts, setups, or questions in the comments — let’s learn together.
🔁 Repost to spread awareness among traders & beginners.
✅ Follow simpletradewithpatience for clean charts, price action insights & beginner-friendly setups.
🚀 Stay Calm. Stay Clean. Trade With Patience.
Trade Smart | Learn Zones | Be Self-Reliant 📊
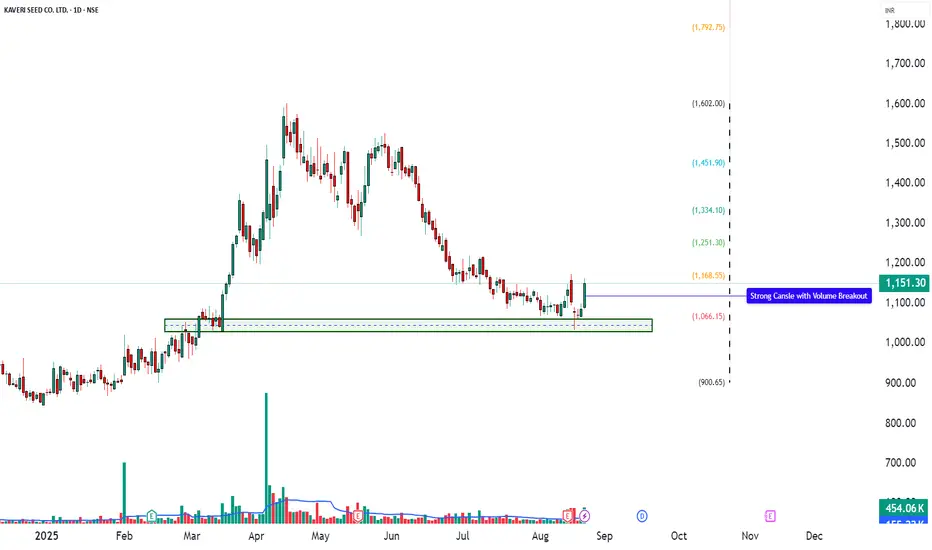
KSCL – Technical & Educational Snapshot📊 KSCL – Technical & Educational Snapshot
Ticker: NSE: KSCL | Sector: 🌱 Seeds & Agro
CMP: ₹1,151.30 ▲ (as of 21 Aug 2025)
Rating (for learning purpose): ⭐⭐⭐⭐
Pattern Observed: 📉 Double Top + Descending Wedge (target near ₹1,000 completed)
KSCL earlier formed a Double Top followed by a Descending Wedge breakdown, with the projected bearish reference zone being successfully achieved. With that completion, the stock has now entered a new phase, displaying fresh bullish momentum. A strong bullish candle, RSI breakout, and Bollinger Band expansion from a squeeze highlight renewed buying strength.
This technical shift points towards a possible trend reversal or at least a medium-term bounce, provided the price sustains above key resistance levels. Supporting indicators (MACD, CCI, Stochastic) are aligned in favor of momentum continuation, adding weight to the bullish case.
📊 Momentum Snapshot:
Momentum indicators are tilting to the bullish side. While Stochastic (84) is moderately elevated, the confluence of RSI breakout, MACD bullish crossover, and strong CCI indicates that momentum could sustain until higher resistance levels are tested.
📊 Volume Check
🔹 Current Volume: 454.06K
🔹 20 SMA Volume: 155.22K ✅
💥 Nearly 3x average volume – confirms strong institutional / broad-based buying interest!
💡 Interpretation:
When volume is well above the 20-period average, it strengthens the reliability of a breakout.
This shows the move is not just retail-driven but likely backed by larger participants.
High-volume breakouts tend to sustain better compared to low-volume moves.
💡 Learnings:
Breakouts emerging from a Bollinger Band Squeeze often lead to strong trending moves as volatility expands. When supported by confirmations such as RSI and MACD turning positive together, the reliability of the breakout improves significantly.
Elevated CCI values reflect strong buying momentum, though traders should remain mindful of possible pullbacks. Above all, defining clear stop-loss and invalidation levels ensures disciplined trade management.
📌 Fresh bullish signals are emerging → but confirmation only comes on sustained move above ₹1,180–1,209. Failure to hold above ₹1,100 may keep it in sideways consolidation or trigger further downward pressure.
🔑 Key Levels
Resistance: 1180 | 1209 | 1256
Support: 1104 | 1057 | 1028
Fibonacci Levels: 900.65 | 1066.15 | 1168.55 | 1251.30 | 1334.10 | 1451.90 | 1602
Pullback Level: Around 1104–1110 zone (first support & prior base)
Invalidation Level: Close below 1057 (would negate the bullish setup)
📝 STWP Trade Setup
📌 Entry (Long): Above 1,162
🛡 Stop Loss: 1,059 or below
🎯 Reference Levels: 1264 | 1366
⚠️ Disclaimer – Please Read Carefully
The information shared here is meant purely for learning and awareness. It is not a buy or sell recommendation and should not be taken as investment advice. I am not a SEBI-registered investment advisor, and all views expressed are based on personal study, chart patterns, and publicly available market data.
Trading — whether in stocks or options — carries risk. Markets can move unexpectedly, and losses can sometimes exceed the money you have invested. Past performance or past setups do not guarantee future results.
If you are a beginner, treat this as a guide to understand how the market works — practice on paper trades before risking real money. If you are experienced, always assess your own risk, position sizing, and strategy suitability before entering trades.
Consult a SEBI-registered financial advisor before making any real trading decision. By engaging with this content, you acknowledge full responsibility for your trades and investments.
💬 Found this useful?
🔼 Give this post a Boost to help more traders discover clean, structured learning.
✍️ Drop your thoughts, questions, or setups in the comments — let’s grow together!
🔁 Share with fellow traders and beginners to spread awareness.
✅ Follow simpletradewithpatience for beginner-friendly setups, price action insights & disciplined trading content.
🚀 Stay Calm. Stay Clean. Trade With Patience.
Trade Smart | Learn Zones | Be Self-Reliant 📊
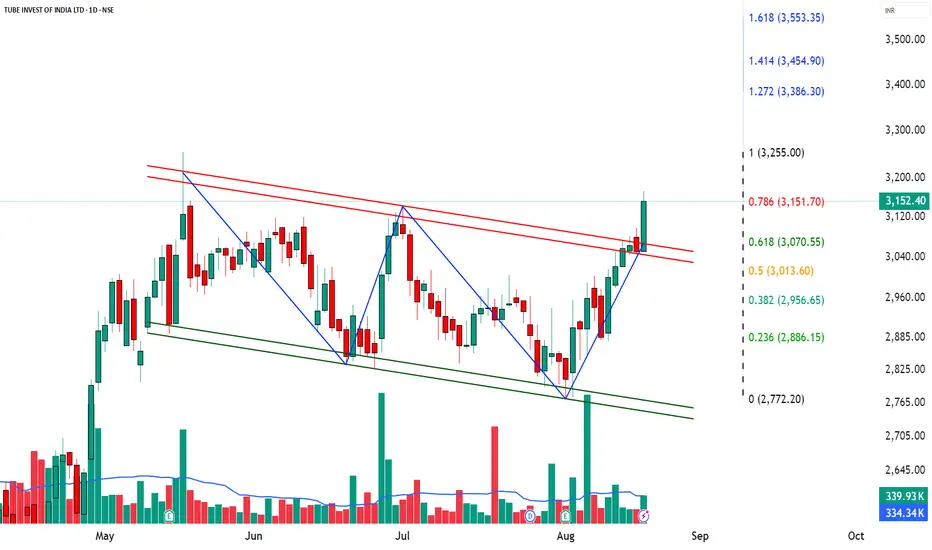
TIINDIA – Technical & Educational Snapshot📊 TIINDIA – Technical & Educational Snapshot
Ticker: NSE: TIINDIA | Sector: 🏭 Industrial Manufacturing
CMP: ₹ ▲ (as of 20 Aug 2025)
Rating (for learning purpose): ⭐⭐⭐⭐
Pattern Observed: 📈 Channel Breakout
TIINDIA is showing strong bullish momentum across multiple technical indicators. The presence of a strong bullish candle, combined with an RSI breakout at 68, indicates significant buying pressure. The Bollinger Band breakout and BB Squeeze-Off suggest increased volatility and the potential for a strong upward move. Bullish VWAP confirms the trend is supported by average price strength, while MACD bullish, CCI at 178, and Stochastic at 95 all point to strong near-term momentum, signaling a likely continuation of the upward trend.
📊 Volume Check:
🔹 Current Volume: 339.93k
🔹 20SMA Volume: 334.34k ✅
💥 Slightly above average – confirming possible buying interest!
💡 Learnings:
Breakouts with above-average volume are more reliable as they indicate real buying interest.
RSI, MACD, CCI, and Stochastic together provide a strong confirmation of momentum.
Bollinger Band squeeze-offs often precede strong directional moves – a good cue for potential entry. Identifying pullback areas and invalidation levels helps manage risk effectively.
Key Levels:
Resistance: 3200 | 3248 | 3323
Support: 3077 | 3002 | 2954
Pullback Area: 3013–3070
Invalidation Level: Close below 2956
STWP Trade Setup:
Entry (Long): Above 3172.90
Stop Loss: 3039.80 or below
Reference Levels: 3306 | 3439
⚠️ Disclaimer – Please Read Carefully
The information shared here is meant purely for learning and awareness. It is not a buy or sell recommendation and should not be taken as investment advice. I am not a SEBI-registered investment advisor, and all views expressed are based on personal study, chart patterns, and publicly available market data.
Trading — whether in stocks or options — carries risk. Markets can move unexpectedly, and losses can sometimes be larger than the money you have invested. Past performance or past setups do not guarantee future results.
If you are a beginner, treat this as a guide to understand how the market works — practice on paper trades before risking real money. If you are an experienced trader, remember to assess your own risk, position sizing, and strategy suitability before entering any trade.
Consult a SEBI-registered financial advisor before making any real trading decision.
By reading, watching, or engaging with this content, you acknowledge that you take full responsibility for your own trades and investments.
💬 Found this useful?
🔼 Give this post a Boost to help more traders discover clean, structured learning.
✍️ Drop your thoughts, questions, or setups in the comments — let’s grow together!
🔁 Share with fellow traders and beginners to spread awareness.
✅ Follow simpletradewithpatience for beginner-friendly setups, price action insights & disciplined trading content.
🚀 Stay Calm. Stay Clean. Trade With Patience.
Trade Smart | Learn Zones | Be Self-Reliant 📊
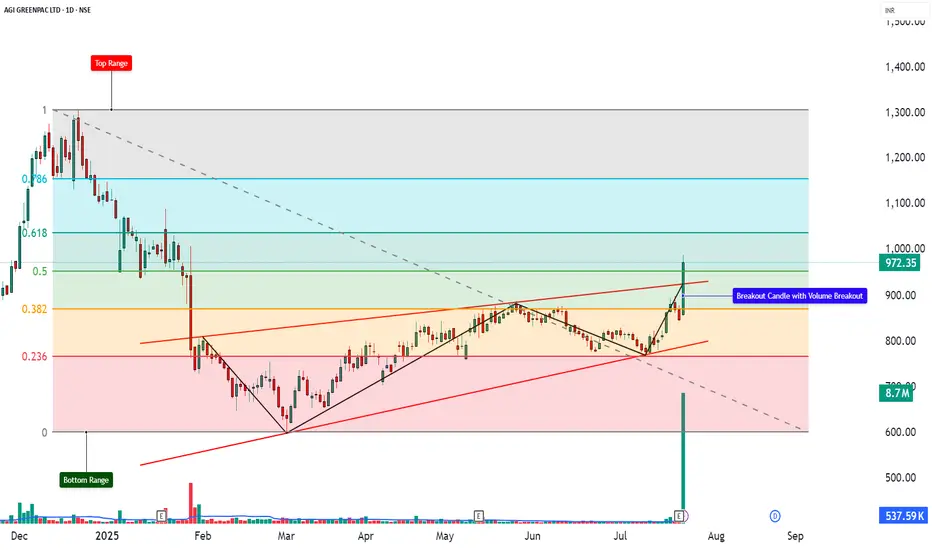
AGI - Breakout Alert – Strong Volume, Clear Trend, Smart Zones! ________________________________________________________________________________
📈 AGI GREENPAC LTD – AGI GREENPAC Breakout Alert – Strong Volume, Clear Trend, Smart Zones! Breakout
🕒 Chart Type: Daily Chart
📆 Date: July 22, 2025
________________________________________________________________________________
📌 Price Action:
AGI GREENPAC has staged a textbook breakout above its rising channel, with a massive +14.83% rally, closing the day at ₹972.35. The price not only cleared a medium-term resistance level but also broke above critical Fibonacci levels, reclaiming bullish control. This is not just a price breakout — it's a structure + volume + indicator alignment, offering a compelling bullish setup with potential for follow-through.
________________________________________________________________________________
📊 Chart Pattern:
✅ Rising Channel Breakout – A bullish continuation pattern formed over several months
✅ Breakout occurred near the channel’s upper boundary with explosive volume
✅ Price cleared 0.5 (₹950.50) and 0.618 (₹1037.15) Fibonacci retracement levels from the prior fall
✅ The structure was backed by a base formation, indicating accumulation beneath resistance. This pattern signals a potential transition from slow ascent to impulsive trend phase — a powerful sign when backed by volume and momentum indicators.
________________________________________________________________________________
🕯️ Candlestick Pattern:
✅ Wide-Range Bullish Candle
✅ Open = Low formation (strength from the first tick)
✅ Strong follow-through above consolidation
✅ Classic “Buy Today, Sell Tomorrow” price action
✅ Confirms structural breakout from channel top
________________________________________________________________________________
🔊 Volume Analysis:
AGI GREENPAC saw a big jump in trading volume, with over 8.7 million shares traded — that’s more than double the usual average of the past 20 days. This kind of volume shows that a lot more people were actively buying the stock, and it wasn’t just a one-time spike — the buying continued throughout the day. What makes this even more special is that it comes after many days of low activity, which often means big investors were slowly building their positions. When such quiet periods are followed by a big volume and price breakout, it usually signals the start of a strong uptrend. Also, this is the highest volume in the past 52 weeks, which gives even more strength to this breakout and shows serious buying interest.
________________________________________________________________________________
📈 Technical Indicators:
The technical indicators are showing strong signs of bullish momentum in AGI GREENPAC. The RSI is at 73, which means the stock is trending strongly and buyers are in control. The MACD, a popular momentum indicator, has given a bullish crossover both on the daily and weekly charts — this is a positive signal that the trend may continue. The CCI, which tracks the speed and strength of price moves, is at 274, indicating very strong upside pressure. The Stochastic is at 93, which means the stock is in the overbought zone, but still confirming the ongoing strength. The price is trading above the VWAP (Volume Weighted Average Price), showing that buyers are dominating the day. Lastly, the stock has broken out of a Bollinger Band squeeze — a setup where the price was moving in a tight range and has now burst out with momentum. When all these indicators point in the same direction, it gives us a high-confidence signal that the breakout is genuine and may continue.
________________________________________________________________________________
🧱 Support & Resistance:
🔻 Supports:
• ₹887.83 – Immediate support (breakout zone)
• ₹803.32 – Mid-structure base
• ₹752.93 – Last support before invalidation
• Bottom Range: ₹599.10 – Historical demand base
🔺 Resistance Zones:
• ₹1022.73 – First resistance (Fibonacci level)
• ₹1073.12 – Previous swing top
• ₹1157.62 – 0.786 Fib level and prior rejection area
• Top Range: ₹1307.90 – Final upside Fibonacci target
________________________________________________________________________________
👀 What’s Catching Our Eye:
What really makes this setup stand out is that everything is coming together at once — and that doesn’t happen often. The stock has broken out of a rising channel, which is a strong chart pattern. It also crossed important Fibonacci levels, showing strength in the move. The volume is more than double the average, which tells us that serious buyers are stepping in. Momentum indicators like RSI and CCI are showing strong upward energy. On top of that, the price has broken out of a tight Bollinger Band range and is staying above VWAP, which adds more strength to the trend. When so many signals align like this, it usually means the stock has a good chance of moving even higher — this is what we call a high-confidence breakout.
________________________________________________________________________________
🔍 What We’re Watching For:
The key thing now is whether the stock can stay above the ₹950–₹960 zone over the next few days. If it does, it will confirm that the breakout is strong and has the potential to move higher. However, if the price dips slightly into the ₹900–₹915 range with low volume, it could be a good opportunity for a safe re-entry. On the other hand, if the stock closes below ₹887, it may be a warning sign that the breakout is failing. This zone is very important — it’s the make-or-break level that will decide if the uptrend continues or fades away.
________________________________________________________________________________
✅ Best Buy Levels (Low Risk Idea):
🔹 Entry: On pullback to ₹861.7–₹864.9 zone with SL ₹848.54
🔹 Low Risk Entry: ₹851.12 with Stop Loss: ₹833.72 (closing basis)
🔹 Risk-Reward: 1:1 | 1:2 +
📌 Avoid chasing — let the price validate the breakout
________________________________________________________________________________
💼 Sector Tailwinds:
AGI GREENPAC is in a business that’s currently seeing strong demand — especially from sectors like real estate, pharmaceutical packaging, alcohol bottling, and FMCG (like food and household products). These industries need high-quality glass and packaging, which is exactly what AGI provides. With growth happening in these areas, the company stands to benefit. This means that the fundamentals are also supporting the chart breakout, making the overall setup even stronger.
________________________________________________________________________________
⚠️ Risks to Watch:
Even though the chart looks strong, there are a few things to be careful about.
First, indicators like RSI and Stochastic show that the stock is in the overbought zone, which means a small pullback or correction is possible. If the price closes below ₹887, it could mean the breakout has failed. Also, if you start seeing red candles with low volume, it might be an early sign that buying interest is fading. Most importantly — don’t invest all your money at once. It's always better to enter with proper risk management and a clear plan, especially after a sharp move.
________________________________________________________________________________
🔮 What to Expect Next:
If AGI GREENPAC stays above the ₹950–₹960 range, it can likely move up to ₹1022–₹1073 in the short term. If the momentum continues and the stock breaks above ₹1073, it could head even higher toward ₹1157–₹1300 in the coming weeks. But if the price drops below ₹887, it could mean the breakout has failed, and the upward trend might not continue. So, the next few days are very important to confirm whether the breakout is real and sustainable.
________________________________________________________________________________
🧠 How to Trade AGI GREENPAC (For Educational Use Only):
🔹 Breakout Plan
• Entry: ₹988.60 or Pullback Zone ₹903–₹915
• SL: ₹842 (Closing basis)
• Risk-Reward: 1:1 | 1:2 +
• Position Sizing: Never all-in — always size by risk
________________________________________________________________________________
⚠ Disclaimer (Please Read):
• These Trades are shared for educational purposes only and is not investment advice.
• I am not a SEBI-registered advisor.
• The information provided here is based on personal market observation.
• No buy/sell recommendations are being made.
• Please do your own research or consult a registered financial advisor before making any trading decisions.
• Trading involves risk. Always use proper risk management.
I am not responsible for trading decisions based on this post.
________________________________________________________________________________
💬 Found this Helpful?
How would you trade this — chase momentum or wait for pullback entry?
👇 Drop your thoughts or questions below
🔁 Share this post with your trading community – let them benefit from clean charts, structured setups, and zone-based learning.
✅ Follow simpletradewithpatience for charts, clean setups, and educational content based on price action, zones, and risk-managed trades.
🚀 Trade with patience, trust your charts, and stay clear-headed!
Be Self-Reliant | Trade with Patience | Learn with Charts & Zones 📊________________________________________
Top 5 Essential Indicators for BeginnersBuild a strong foundation with these must-know tools.
Starting out in technical analysis can feel overwhelming. With hundreds of indicators available on platforms like TradingView, where do you begin?
The truth is, you don’t need dozens of tools just a few reliable, beginner-friendly indicators that help you understand market trends, momentum, and entry/exit points.
Here are the top 5 essential indicators every new trader should learn:
1. Moving Average (MA)
Why it matters: Moving Averages help smooth out price action and identify the direction of the trend.
There are two common types:
Simple Moving Average (SMA): Basic average over a set period
Exponential Moving Average (EMA): Gives more weight to recent prices
Use it to spot trend direction:
Price above MA = uptrend
Price below MA = downtrend
Beginners often start with the 50 and 200 EMA for swing trading or 9 and 21 EMA for intraday setups.
2. Relative Strength Index (RSI)
Why it matters: RSI is a momentum oscillator that helps spot overbought or oversold conditions.
RSI above 70 = Overbought (possible reversal or pullback)
RSI below 30 = Oversold (possible bounce)
It’s a great tool for spotting divergences and potential turning points, especially when the price reaches a key support/resistance level.
3. MACD (Moving Average Convergence Divergence)
Why it matters: MACD reveals momentum and potential trend reversals through moving average crossovers.
It includes:
MACD Line
Signal Line
Histogram
When the MACD line crosses above the signal line, it’s a bullish signal. When it crosses below, it’s bearish.
It’s a favorite among traders who want a blend of trend and momentum analysis.
4. Bollinger Bands
Why it matters: Bollinger Bands show price volatility and help spot potential breakout zones.
They consist of:
A middle line (SMA)
Upper and lower bands based on price volatility
Price touching the upper band may indicate overbought conditions, while the lower band can signal oversold. When bands contract, expect a volatility breakout soon.
5. Stochastic Oscillator
Why it matters: Another momentum tool, it compares a security’s closing price to its price range over a period.
Above 80 = Overbought
Below 20 = Oversold
It works well in range-bound markets and helps confirm reversal zones, especially when paired with support/resistance.
Conclusion
You don’t need to master every tool at once. These five indicators MA, RSI, MACD, Bollinger Bands, and Stochastic Oscillator give you a solid, practical starting point to read charts and make smarter trading decisions.

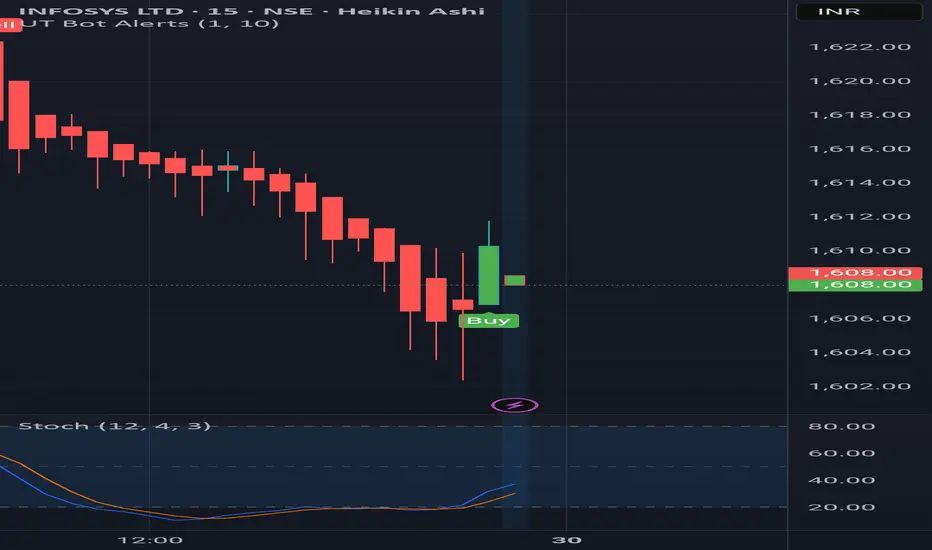
bot alerts2 signal compare stochastic and ut bot alert, without changing the settings only stochastic changes to be made to 12,4,3, it should be helpful to decide the stock tou trade after using a reliable scanner you can also use it on different time frames