ITC 1 Day View📉 Key Support Levels (1H Timeframe)
₹5,436.67 – Immediate support level.
₹5,357.00 – Next support zone.
📈 Key Resistance Levels (1H Timeframe)
₹5,629.00 – Immediate resistance level.
₹5,708.67 – Next resistance zone.
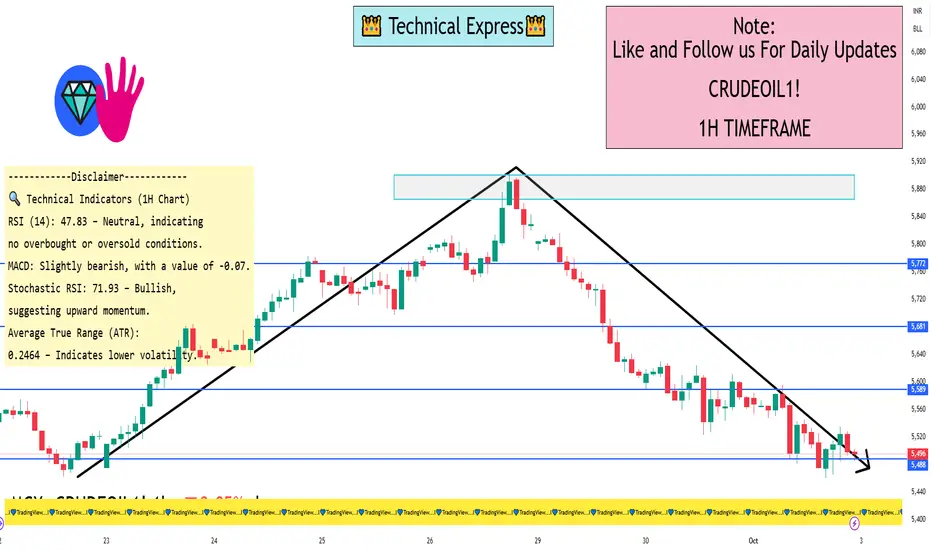
🔍 Technical Indicators (1H Chart)
RSI (14): 47.83 – Neutral, indicating no overbought or oversold conditions.
MACD: Slightly bearish, with a value of -0.07.
Stochastic RSI: 71.93 – Bullish, suggesting upward momentum.
Average True Range (ATR): 0.2464 – Indicates lower volatility.
Overall, the 1-hour chart shows a neutral to slightly bullish trend, with price action confined between ₹5,436.67 and ₹5,629.00. A breakout above ₹5,629.00 could target ₹5,708.67, while a drop below ₹5,436.67 may lead to retesting lower support levels.
Search in ideas for "stochastic"
ADANIPORTS 1 Hour View📊 1-Hour Timeframe Technical Overview
Current Price: ₹1,392.00
Day’s Range: ₹1,390.30 – ₹1,416.70
Volume: ~1.9 million shares
Price Change: -1.08%
Technical Strength Index: Mild Bearish
📈 Key Indicators
Supertrend: 1460.9 (Mild Bearish)
Parabolic SAR: 1458.77 (Mild Bearish)
RSI (Relative Strength Index): Data not specified
MACD: Data not specified
ADX (Average Directional Index): Data not specified
Stochastic Oscillator: Data not specified
Rate of Change (ROC): Data not specified
Chaikin Money Flow (CMF): -0.05 (Bearish)
Williams %R: Data not specified
Pivot Levels: Data not specified
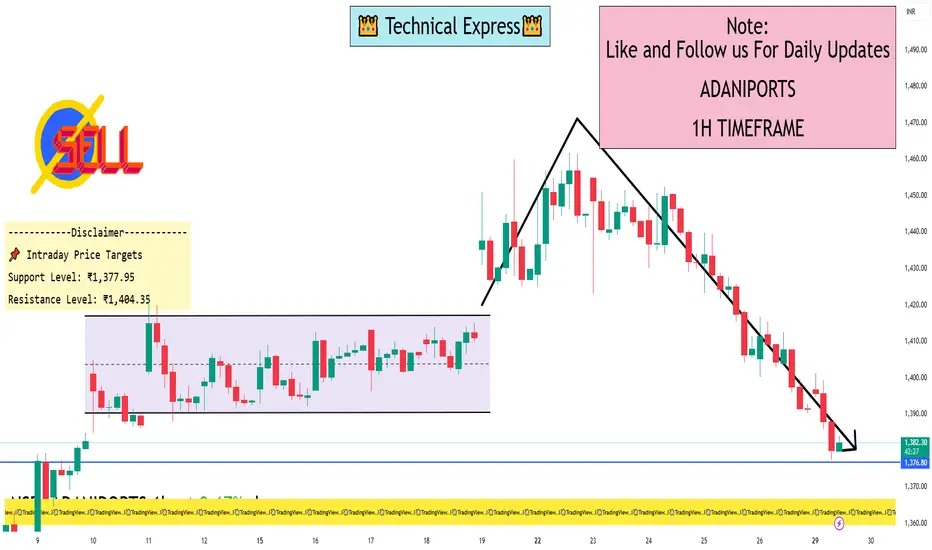
📌 Intraday Price Targets
Support Level: ₹1,377.95
Resistance Level: ₹1,404.35
🔍 Summary
Adani Ports is currently exhibiting a mild bearish trend on the 1-hour chart, with key indicators such as the Supertrend and Parabolic SAR suggesting downward momentum. The Chaikin Money Flow (CMF) is also negative, indicating potential selling pressure.
Intraday traders should monitor the support level at ₹1,377.95 and the resistance at ₹1,404.35. A break below support could signal further downside, while a move above resistance may indicate a reversal or continuation of the uptrend.
Please note that technical analysis is subject to market conditions and should be used in conjunction with other forms of analysis and risk management strategies.
HINDZINC 1 Day View📊 Intraday Support & Resistance Levels
Immediate Support: ₹442.00 – A level where buyers have previously shown interest.
Immediate Resistance: ₹455.90 – A recent high that may act as a barrier to upward movement.
Additional Resistance Levels:
₹461.80
₹470.70
₹479.60
₹494.00
Additional Support Levels:
₹427.50
₹436.40
🔍 Technical Indicators
Relative Strength Index (RSI): Approximately 41.05, indicating a neutral to bearish momentum.
Moving Average Convergence Divergence (MACD): At -1.680, suggesting a bearish trend.
Average Directional Index (ADX): Around 21.33, indicating a weak trend strength.
Stochastic Oscillator: Approximately 63.96, pointing to neutral momentum.
⚠️ Trade Considerations
Bullish Scenario: If the price sustains above ₹442.00, there may be potential for a rebound towards ₹455.90.
Bearish Scenario: A drop below ₹442.00 could lead to further declines, possibly testing lower support levels.
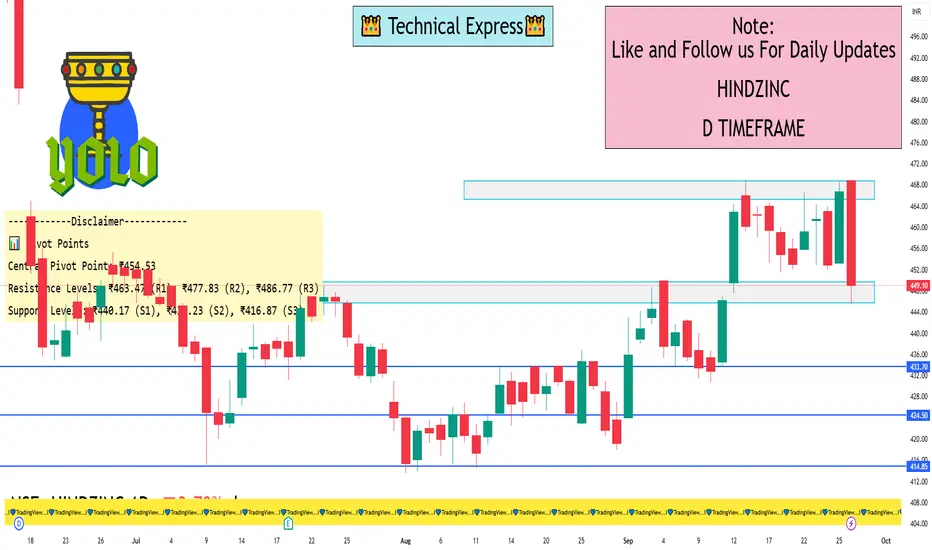
📊 Pivot Points
Central Pivot Point: ₹454.53
Resistance Levels: ₹463.47 (R1), ₹477.83 (R2), ₹486.77 (R3)
Support Levels: ₹440.17 (S1), ₹431.23 (S2), ₹416.87 (S3)
📝 Outlook
Bullish Scenario: If the price sustains above ₹442.00, there may be potential for a rebound towards ₹455.90.
Bearish Scenario: A drop below ₹442.00 could lead to further declines, possibly testing lower support levels.
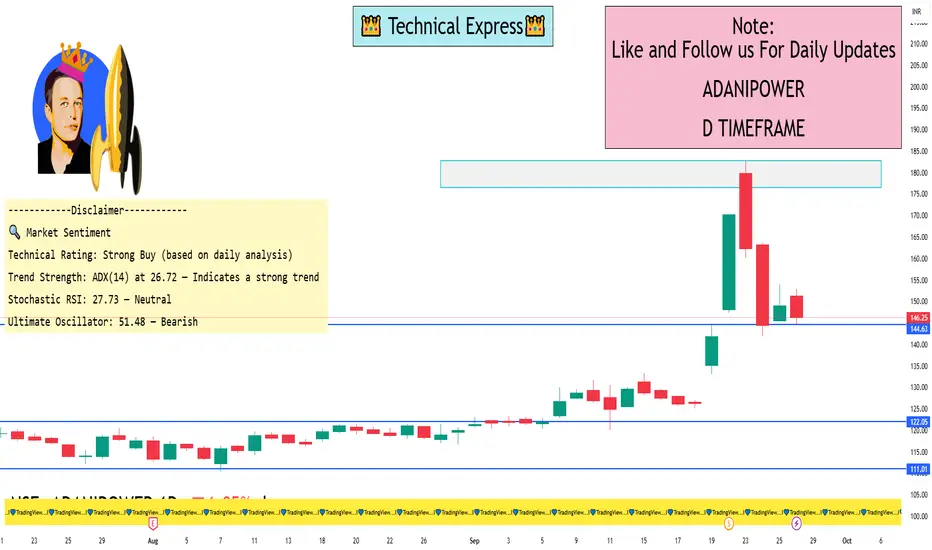
ADANIPOWER 1 Day View📈 Support & Resistance Levels
Classic Pivot Points:
Resistance: ₹151.20 (R1), ₹156.15 (R2), ₹159.40 (R3)
Support: ₹139.75 (S1), ₹143.00 (S2), ₹134.80 (S3)
Pivot Point: ₹147.95
Fibonacci Levels:
Resistance: ₹151.08 (R1), ₹153.02 (R2), ₹156.15 (R3)
Support: ₹142.88 (S1), ₹144.82 (S2), ₹139.75 (S3)
Pivot Point: ₹147.95
Camarilla Levels:
Resistance: ₹147.00 (R1), ₹147.75 (R2), ₹148.50 (R3)
Support: ₹144.00 (S1), ₹144.75 (S2), ₹145.50 (S3)
Pivot Point: ₹147.95
📊 Technical Indicators
RSI (14-day): 44.06 — Neutral to slightly bearish
MACD: -0.840 — Bearish trend
Moving Averages:
20-day EMA: ₹135.67 — Neutral
50-day EMA: ₹127.34 — Neutral
100-day EMA: ₹121.00 — Uptrend
200-day EMA: ₹116.62 — Uptrend
🔍 Market Sentiment
Technical Rating: Strong Buy (based on daily analysis)
Trend Strength: ADX(14) at 26.72 — Indicates a strong trend
Stochastic RSI: 27.73 — Neutral
Ultimate Oscillator: 51.48 — Bearish
📉 Recent Performance
Recent Decline: Adani Power reported a 15.5% decline in its first-quarter profit, with consolidated net earnings dropping to ₹33.05 billion from ₹39.13 billion the previous year. The decline is attributed to subdued power demand and increased coal import costs
📌 Conclusion
Adani Power is currently in a neutral to slightly bearish phase on the daily chart, with key support around ₹139.75 and resistance near ₹151.20. The technical indicators suggest a cautious outlook, with the RSI and MACD indicating a bearish trend. However, the strong trend strength (ADX) and positive moving averages indicate potential for upward movement if the stock breaks above resistance levels.
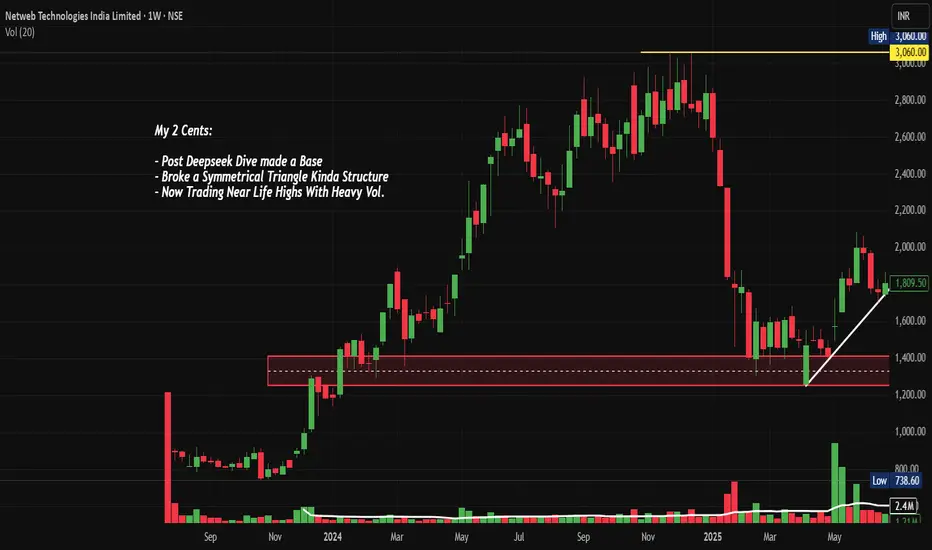
NETWEB: AI Infrastructure Goldmine ? Chart of the MonthNSE:NETWEB MarchingTowards 4,000: Is This the AI Infrastructure Goldmine You've Been Waiting For? Let's analyze in the "Chart of the Month".
As per the Latest SEBI Mandate, this isn't a Trading/Investment RECOMMENDATION nor for Educational Purposes; it is just for Informational purposes only. The chart data used is 3 Months old, as Showing Live Chart Data is not allowed according to the New SEBI Mandate.
Disclaimer: "I am not a SEBI REGISTERED RESEARCH ANALYST AND INVESTMENT ADVISER."
This analysis is intended solely for informational purposes and should not be interpreted as financial advice. It is advisable to consult a qualified financial advisor or conduct thorough research before making investment decisions.
Price Action Analysis:
- Current Price: ₹3,695.40
- 52-Week Range: ₹738.60 - ₹3,745.00
- Recent Performance: +64% gain in a Month with strong momentum
- Price structure shows consistently higher highs and higher lows pattern
- Stock has demonstrated remarkable resilience with a 380% rally from its 52-week low
Volume Spread Analysis:
- Volume surge visible during recent breakout phases
- High volume of 24.25M shares traded, indicating institutional participation
- Volume expansion coinciding with price breakouts confirms genuine buying interest
- Strong volume accumulation during consolidation phases suggests smart money positioning
Chart Patterns Identified:
- Symmetrical Triangle Breakout: Successfully broken above the triangle pattern
- Ascending Triangle: Multiple resistance tests followed by decisive breakout
- Flag and Pennant Patterns: Short-term consolidation after sharp moves
Key Technical Levels:
Support Levels:
- Immediate Support: ₹3,200 (recent consolidation zone)
- Strong Support: ₹2,800 (previous resistance turned support)
- Major Support: ₹2,400 (trendline support and psychological level)
- Critical Support: ₹2,000 (long-term ascending trendline)
Resistance Levels:
- Immediate Resistance: ₹3,745 (52-week high)
- Next Resistance: ₹4,000 (psychological round number)
- Extended Resistance: ₹4,400 (measured move projection)
- Long-term Resistance: ₹5,000
Base Formation:
- Primary Base: ₹1,200-₹1,600 range (established during deep consolidation)
- Secondary Base: ₹2,400-₹2,800 range (recent re-accumulation zone)
- The stock has clearly established a strong foundation above the ₹2,400 levels
Technical Indicators Assessment:
Momentum Indicators:
- RSI is in overbought territory but showing positive divergence
- MACD showing bullish crossover with expanding histogram
- Stochastic indicates strong upward momentum
- ADX suggesting strong trending behaviour
Moving Averages:
- Price trading well above all major moving averages
- 20 EMA, 50 EMA, and 200 EMA in perfect bullish alignment
- Strong uptrend confirmed by ascending moving averages
- No signs of trend reversal in the near term
Sectoral and Fundamental Backdrop:
AI Infrastructure Sector Outlook:
- India's IndiaAI Mission with ₹10,372 crore budget creating massive opportunities
- Government's push for sovereign AI infrastructure benefiting domestic players
- Global demand for AI computing infrastructure is experiencing exponential growth
- Limited domestic competition in the high-end computing solutions space
Company-Specific Fundamentals:
- Netweb's supercomputers have appeared 15 times across three entries in the global Top 500 supercomputers ranking
- The company is almost debt-free with a market cap of ₹20,936 crore
- Recent order wins worth ₹1,734 crore for IndiaAI Mission and ₹450 crore additional order
- Order pipeline of ₹4,142.1 crore as of June 2025, excluding new mandates
Key Growth Catalysts:
- Delivery of servers built on NVIDIA's Blackwell Architecture for India's Sovereign AI System
- Expanding presence in high-performance computing and AI systems
- Strong relationships with global technology partners
- Beneficiary of the government's Digital India and AI initiatives
Financial Performance Metrics:
- Strong revenue visibility from a large order book
- Improving profit margins due to premium product offerings
- Healthy cash flows supporting future expansion
- Zero debt structure providing financial flexibility
Strategic Outlook:
- Expect continued momentum driven by the AI infrastructure theme
- News-driven volatility possible around order execution updates
- Sector rotation into a technology infrastructure play is expected
- Quarterly results will be the key catalyst for sustained momentum
- India's AI infrastructure buildout is a multi-year opportunity
- The company is well-positioned to capture significant market share
Risk Factors to Monitor:
Technical Risks:
- Overbought conditions may lead to profit-taking
- High volatility expected given the stock's momentum
- Any break below ₹3,000 would signal trend weakness
Fundamental Risks:
- Execution risk on large government orders
- Competition from global players in AI infrastructure
- Technology disruption risks in a rapidly evolving sector
- Dependence on government spending cycles
Market Risks:
- Overall market correction could impact high-beta stocks
- Sector rotation away from technology themes
- Global supply chain disruptions affecting component availability
My 2 Cents:
NSE:NETWEB presents a compelling technical setup with strong fundamental support from India's push for AI infrastructure. The stock's breakout from multiple chart patterns, combined with substantial order wins and sector tailwinds, creates an attractive risk-reward proposition. However, position sizing and disciplined risk management remain crucial given the stock's high volatility and premium valuation.
Full Coverage on my Newsletter this Week
Keep in the Watchlist and DOYR.
NO RECO. For Buy/Sell.
📌Thank you for exploring my idea! I hope you found it valuable.
🙏FOLLOW for more
👍BOOST if you found it useful.
✍️COMMENT below with your views.
Meanwhile, check out my other stock ideas on the right side until this trade is activated. I would love your feedback.
As per the Latest SEBI Mandate, this isn't a Trading/Investment RECOMMENDATION nor for Educational Purposes; it is just for Informational purposes only. The chart data used is 3 Months old, as Showing Live Chart Data is not allowed according to the New SEBI Mandate.
Disclaimer: "I am not a SEBI REGISTERED RESEARCH ANALYST AND INVESTMENT ADVISER."
This analysis is intended solely for informational purposes and should not be interpreted as financial advice. It is advisable to consult a qualified financial advisor or conduct thorough research before making investment decisions.
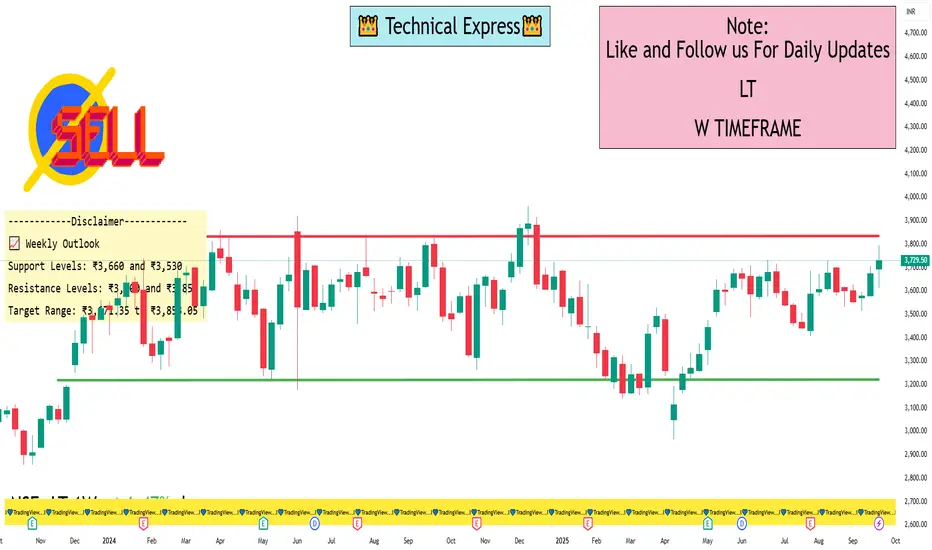
LT 1 Week View📊 Weekly Price Range (Sep 22–26, 2025)
High: ₹3,794.90
Low: ₹3,661.00
Closing Range: ₹3,642.15 – ₹3,731.10
Average Closing Price: ₹3,673.80
Trading Volume: Significantly above average, with 241,575 shares traded on September 26, compared to the 50-day average of 126,661 shares.
🔧 Technical Indicators
Relative Strength Index (RSI): Indicates bullish momentum.
Moving Averages: Both 50-day and 200-day moving averages suggest a positive trend.
MACD & Stochastic Oscillator: Both indicators are aligned with upward momentum.
Volume Delivery: High delivery volumes suggest strong investor confidence.
📈 Weekly Outlook
Support Levels: ₹3,660 and ₹3,530
Resistance Levels: ₹3,800 and ₹3,850
Target Range: ₹3,671.35 to ₹3,853.05
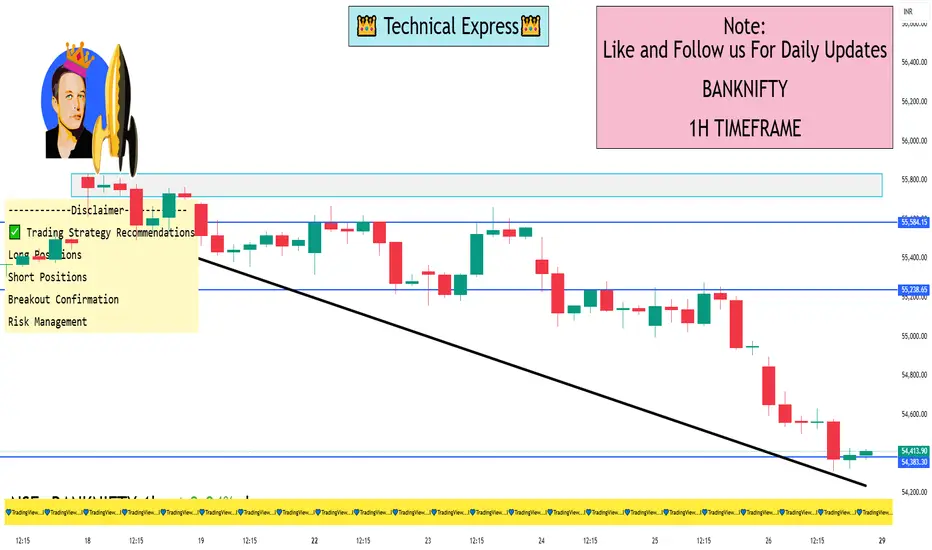
Bank Nifty 1 Hour View📊 Bank Nifty 1-Hour Time Frame Analysis
🔹 Current Market Snapshot
Closing Price (Sep 26, 2025): ₹54,389.35
Day's Range: ₹54,310.95 – ₹54,897.00
52-Week Range: ₹47,702.90 – ₹57,628.40
Trend: Neutral
🔹 Key Support and Resistance Levels
Opening Support/Resistance Zone: ₹54,935 – ₹54,971
Immediate Resistance: ₹55,167
Last Intraday Resistance: ₹55,368
Last Intraday Support: ₹54,698
Deeper Support: ₹54,545
🔹 Market Scenarios
Gap-Up Opening (200+ points):
A gap-up above ₹55,150–₹55,200 will immediately test the Opening Resistance at ₹55,167. Sustaining above this zone may extend the rally towards the last intraday resistance at ₹55,368.
A breakout above ₹55,368 could invite further bullish momentum.
However, if Bank Nifty fails to hold above ₹55,167, it may retrace back to the support zone around ₹54,971.
Educational Note: Gap-ups often invite early profit booking. Always confirm sustainability above resistance levels before initiating aggressive long trades.
Flat Opening (within ±200 points):
A flat start near ₹54,900–₹55,000 means Bank Nifty will trade directly around the Opening Support/Resistance Zone (₹54,935 – ₹54,971).
Holding above ₹54,971 will give buyers confidence to push towards ₹55,167 → ₹55,368.
A failure to sustain above this zone may drag the index down towards ₹54,698 and possibly ₹54,545.
Educational Note: Flat openings provide clearer setups as price tests both support and resistance zones naturally, giving traders better confirmation of direction.
Gap-Down Opening (200+ points):
A gap-down below ₹54,750 will put immediate pressure on Bank Nifty, exposing the Last Intraday Support at ₹54,698.
Use hourly candle close for stop-loss confirmation to prevent whipsaws.
Avoid naked options in high volatility; instead, use spreads (like Bull Call or Bear Put spreads) to limit premium decay.
Maintain a strict 1:2 risk-to-reward ratio.
Never chase trades out of emotion. Scale into trades gradually rather than going all-in at once.
📈 Technical Indicators Overview
Trend: Neutral
Moving Averages: Not specified
RSI (Relative Strength Index): Not specified
MACD (Moving Average Convergence Divergence): Not specified
Stochastic Oscillator: Not specified
Volume: Not specified
✅ Trading Strategy Recommendations
Long Positions: Consider initiating long positions if Bank Nifty sustains above ₹55,167, with a target towards ₹55,368.
Short Positions: Be cautious of short positions unless a clear breakdown below ₹54,698 is observed, with a subsequent target towards ₹54,545.
Breakout Confirmation: Always wait for confirmation (e.g., a 15-minute close) above or below key levels before entering trades.
Risk Management: Employ stop-loss orders to protect against adverse market movements.
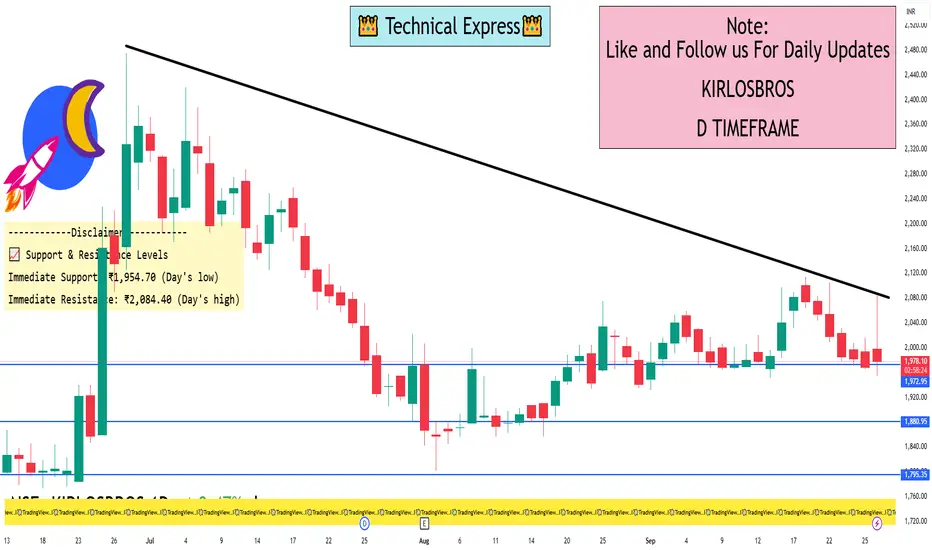
KIRLOSBROS 1 Day View📊 1-Day Technical Summary
Current Price: ₹2,030.50
Open: ₹1,998.00
High: ₹2,084.40
Low: ₹1,954.70
Close: ₹2,030.50
Volume: 177,664 shares
VWAP: ₹2,029.19
Price Change: -0.67%
🔍 Technical Indicators
RSI (14-day): 39.91 — Indicates a bearish trend, approaching oversold conditions
MACD: -16.34 — Suggests a bearish momentum
Moving Averages: All short-term and long-term moving averages (MA5 to MA200) are signaling a Strong Sell
Stochastic RSI: In a bearish zone, reinforcing the downward momentum
📈 Support & Resistance Levels
Immediate Support: ₹1,954.70 (Day's low)
Immediate Resistance: ₹2,084.40 (Day's high)
⚠️ Conclusion
The 1-day technical indicators for Kirloskar Brothers Ltd. suggest a bearish outlook, with the stock trading below key moving averages and exhibiting negative momentum. Traders should exercise caution and consider waiting for a confirmation of trend reversal before initiating long positions.
INFY 1D Time frame📊 Daily Snapshot
Closing Price: ₹1,484.65
Day’s Range: ₹1,476.50 – ₹1,502.70
Previous Close: ₹1,494.60
Change: Down –0.64%
52-Week Range: ₹1,307.00 – ₹2,006.45
Market Cap: ₹6.17 lakh crore
P/E Ratio (TTM): 22.62
Dividend Yield: 2.90%
EPS (TTM): ₹65.63
Beta: 1.09 (indicating moderate volatility)
🔑 Key Technical Levels
Support Zone: ₹1,469 – ₹1,473
Resistance Zone: ₹1,485 – ₹1,490
Pivot Point: ₹1,480.97 (Fibonacci)
All-Time High: ₹2,006.45
📈 Technical Indicators
RSI (14-day): 44.45 – approaching oversold territory, suggesting potential for a rebound.
MACD: Negative at –6.34, indicating bearish momentum.
Moving Averages: Trading below the 50-day (₹1,511.06) and 200-day (₹1,495.15) moving averages, indicating a bearish trend.
Stochastic RSI: Between 45 and 55, indicating a neutral condition.
CCI (20): Between –50 and 50, implying a neutral condition.
📉 Market Sentiment
Recent Performance: Infosys experienced a decline of 0.64% on September 25, 2025, underperforming the broader market.
Volume: Trading volume was significantly higher than its 20-day average, indicating increased investor activity.
📈 Strategy (1D Timeframe)
1. Bullish Scenario
Entry: Above ₹1,485
Stop-Loss: ₹1,469
Target: ₹1,490 → ₹1,500
2. Bearish Scenario
Entry: Below ₹1,469
Stop-Loss: ₹1,485
Target: ₹1,460 → ₹1,450
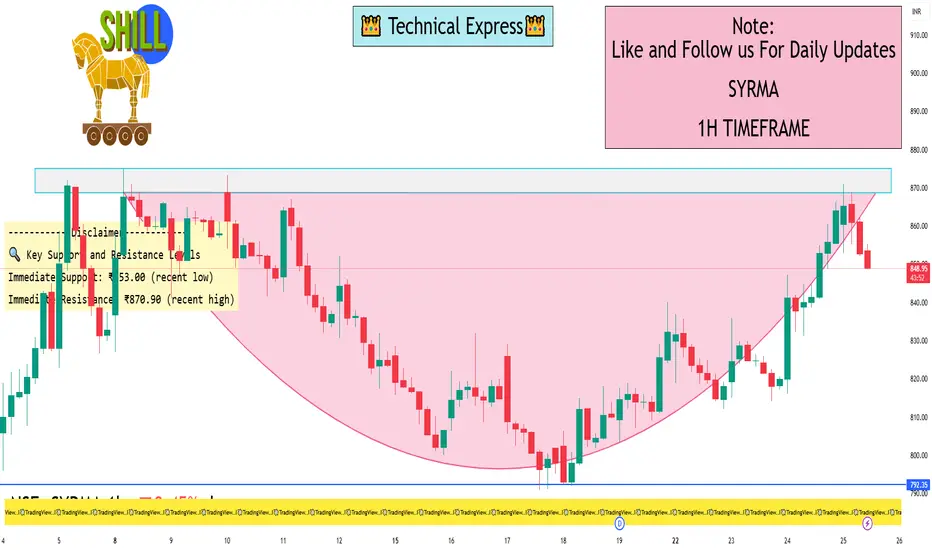
SYRMA 1 Hour View📈 1-Hour Time Frame Technical Overview
Based on recent intraday data, here’s a snapshot of SYRMA’s 1-hour technical indicators:
Relative Strength Index (RSI): 67.55, indicating bullish momentum.
Moving Average Convergence Divergence (MACD): 26.80, suggesting upward momentum.
Average Directional Index (ADX): 25.47, reflecting a moderately strong trend.
Stochastic Oscillator: 56.86, showing no overbought or oversold conditions.
Supertrend: ₹765.70, indicating a bullish trend.
Parabolic SAR (PSAR): ₹792.41, supporting the bullish trend.
Chaikin Money Flow (CMF): 0.110, suggesting accumulation of shares.
These indicators collectively point towards a bullish short-term trend for SYRMA.
🔍 Key Support and Resistance Levels
Immediate Support: ₹853.00 (recent low)
Immediate Resistance: ₹870.90 (recent high)
A breakout above ₹870.90 could signal further upside potential, while a dip below ₹853.00 might suggest a pullback.
For real-time intraday analysis on a 1-hour time frame, you can utilize the following platforms:
TradingView: Offers a comprehensive technical analysis overview, including indicators like RSI, MACD, and moving averages
Chartink: Provides customizable candlestick charts with various time frames and technical indicators
Investing.com: Features candlestick charts with pattern recognition and technical indicators
TopStockResearch: Delivers interactive charts with real-time updates and technical analysis tools
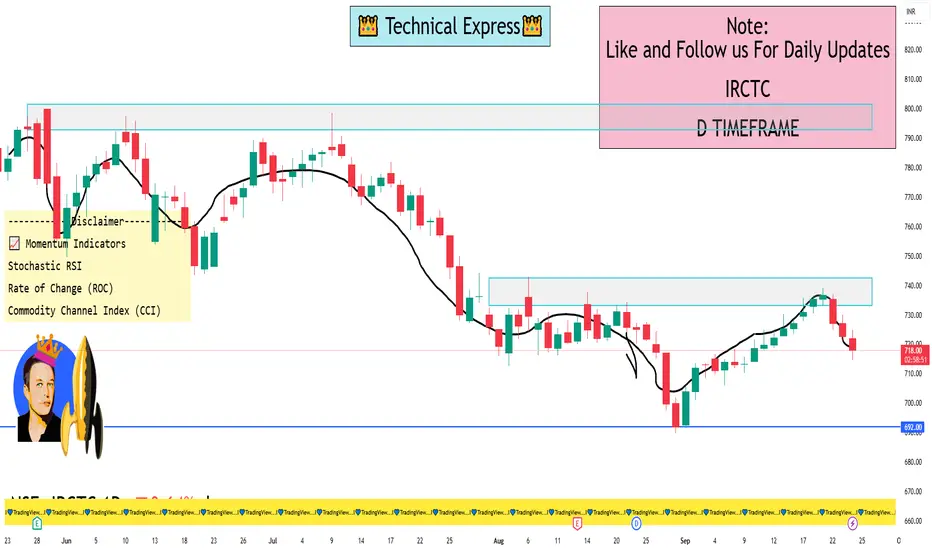
IRCTC 1 Day View📈 Key Intraday Levels
Opening Price: ₹722.05
Day’s High: ₹724.85
Day’s Low: ₹714.60
Closing Price: ₹719.20
🔍 Technical Indicators
Support Level: ₹719.20 – This level is backed by accumulated volume, suggesting it may act as a reliable support point.
Resistance Level: ₹729.30 – The short-term moving average indicates this as a potential resistance point.
Volatility: The stock exhibited a 1.25% intraday range, with average daily volatility around 1.12%, indicating relatively stable movements.
📊 Momentum Indicators
Stochastic RSI: Currently in a neutral zone, suggesting neither overbought nor oversold conditions.
Rate of Change (ROC): Indicates a neutral condition, with no strong momentum in either direction.
Commodity Channel Index (CCI): Also in a neutral range, reflecting a lack of strong trend.
🛡️ Risk Management
Suggested Stop-Loss: ₹683.68 – Given the stock's low daily volatility, this stop-loss level offers a conservative risk management approach.
📌 Summary
IRCTC's stock is currently trading within a defined range, with support at ₹719.20 and resistance around ₹729.30. Momentum indicators suggest a neutral stance, indicating a wait-and-watch approach may be prudent for short-term traders. For those considering a longer-term perspective, the stock's low volatility and established support levels could present opportunities for accumulation, especially if it maintains above the ₹719.20 support.
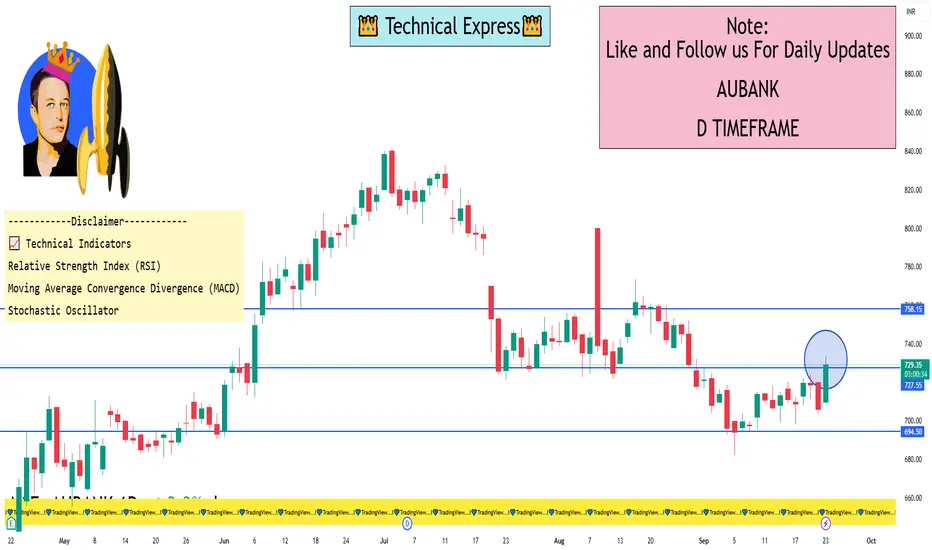
AUBANK 1 Day View📊 Intraday Technical Levels (1-Day Time Frame)
Based on pivot point analysis and Fibonacci retracements, here are the key support and resistance levels for today:
🔹 Standard Pivot Points
Support Levels: S1: ₹709.93, S2: ₹693.88, S3: ₹683.92
Resistance Levels: R1: ₹725.98, R2: ₹732.07
🔹 Camarilla Pivot Points
Support Levels: S3: ₹701.64, S2: ₹703.11, S1: ₹704.58
Resistance Levels: R1: ₹707.52, R2: ₹708.99, R3: ₹710.46
🔹 Fibonacci Retracement Levels
Support Levels: S1: ₹700.01, S2: ₹693.06
Resistance Levels: R1: ₹719.85, R2: ₹725.72
🔹 Woodie's Pivot Points
Support Levels: S1: ₹698.02, S2: ₹692.91
Resistance Levels: R1: ₹708.96, R2: ₹714.08
🔹 Demark Pivot Points
Support Levels: S1: ₹696.92
Resistance Levels: R1: ₹712.98
📈 Technical Indicators
Relative Strength Index (RSI): Currently at 60, indicating a bullish trend with room for further upside.
Moving Average Convergence Divergence (MACD): The MACD line is above the signal line, suggesting upward momentum.
Stochastic Oscillator: Reading between 55 and 80, indicating a bullish condition.
🔍 Summary
AU Small Finance Bank Ltd is exhibiting a bullish trend in the 1-day time frame, trading above key pivot levels. The RSI and MACD indicators support this positive outlook. Traders may consider monitoring the stock for potential breakout opportunities above resistance levels.
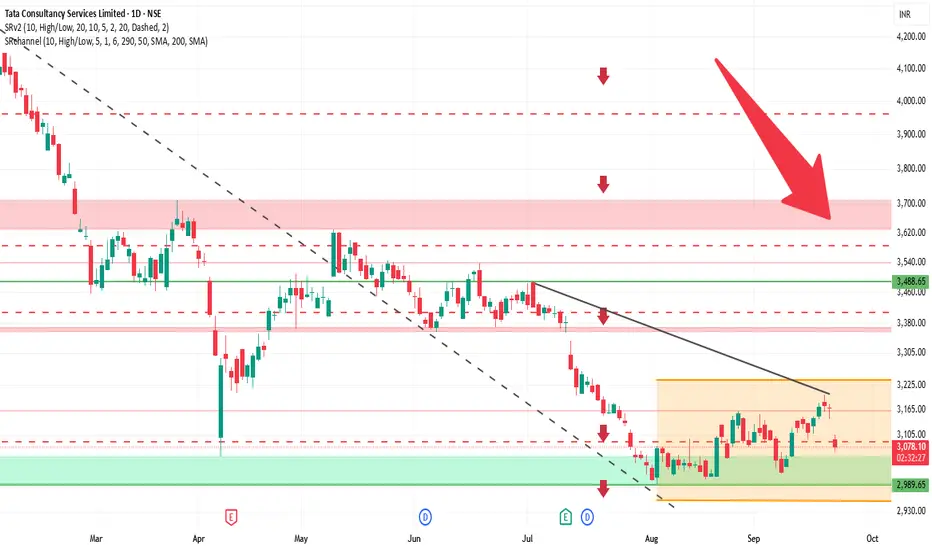
TCS 1D Time frame🔍 Current Price & Context
Trading around ₹3,089
Day’s range: ₹3,065 – ₹3,107
Previous close: ₹3,171
Market sentiment: Bearish, influenced by external factors affecting IT stocks.
📊 Technical Indicators
Moving Averages: Short-term averages are slightly above current price, acting as resistance.
RSI (14): ~30, indicating oversold conditions.
MACD: Negative, showing bearish momentum.
Stochastic Oscillator: Oversold, may suggest a short-term reversal.
CCI (20): Below zero, confirming bearish trend.
ROC (20): Negative, indicating declining momentum.
🧮 Strategy / Trade Ideas
Long Setup:
Entry near support (~3,050) if bullish reversal appears
Stop Loss: Below 3,000
Targets: 3,100 first, then 3,150
Short / Pullback Setup:
Entry if price fails near resistance (~3,100)
Stop Loss: Above 3,150
Targets: 3,050 first, then 3,000
✅ Summary
TCS on daily chart is bearish but oversold. Watch immediate support (~3,050) for potential reversal, and resistance (~3,100 – 3,120) for pullback risk. A breakout above resistance could target 3,150+, while failure of support may lead toward 3,000.
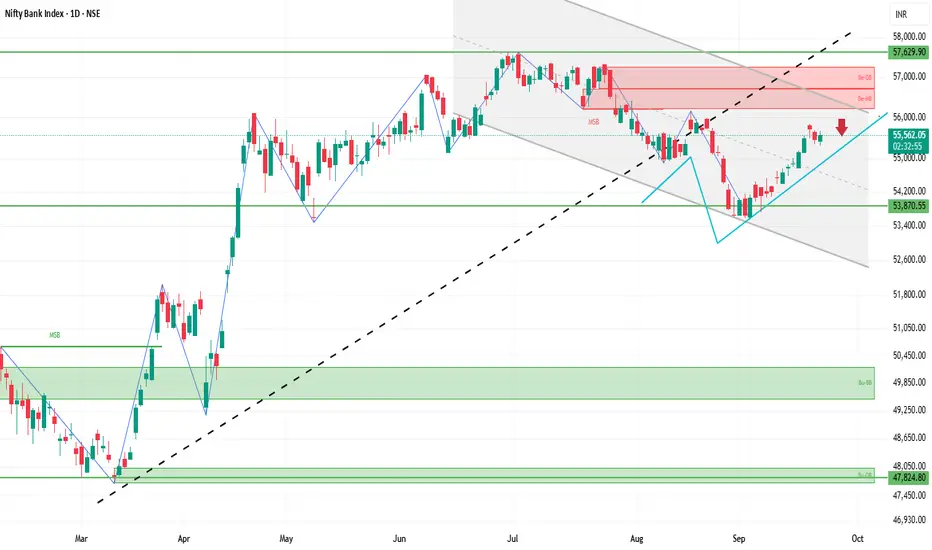
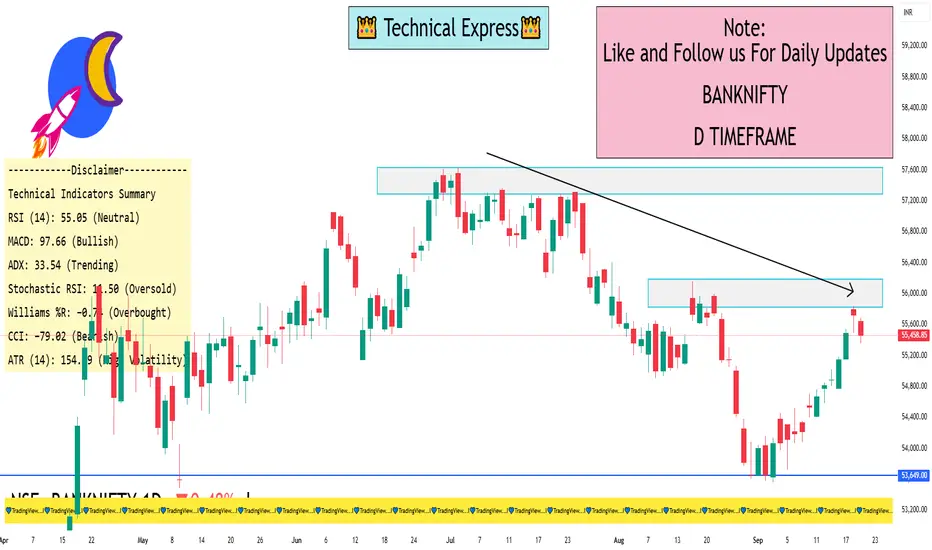
BANKNIFTY 1D Time frame🔍 Current Market Snapshot
Current Level: ₹55,541.30
Day’s Range: ₹55,315.55 – ₹55,666.35
52-Week Range: ₹47,702.90 – ₹57,628.40
Previous Close: ₹55,458.85
Market Sentiment: Neutral to mildly bearish
📊 Technical Indicators
Moving Averages: The BANKNIFTY index is trading slightly below its short-term moving averages, indicating potential resistance.
RSI (14): Approximately 50, suggesting a neutral stance with no clear overbought or oversold conditions.
MACD: Neutral, with the MACD line and signal line close together, indicating indecision in market momentum.
Stochastic Oscillator: Neutral, fluctuating around the midline, reflecting a lack of strong directional movement.
🧮 Strategy / Trade Ideas
Long Setup:
Entry: Consider entering near support levels (~₹55,300) if bullish reversal signals appear.
Stop Loss: Place below ₹54,800 to manage risk.
Target: First resistance around ₹55,800, then ₹56,200.
Short Setup:
Entry: If price fails to break above resistance (~₹55,800) and shows signs of reversal.
Stop Loss: Above ₹56,300.
Target: Downside toward ₹55,300, then ₹54,800.
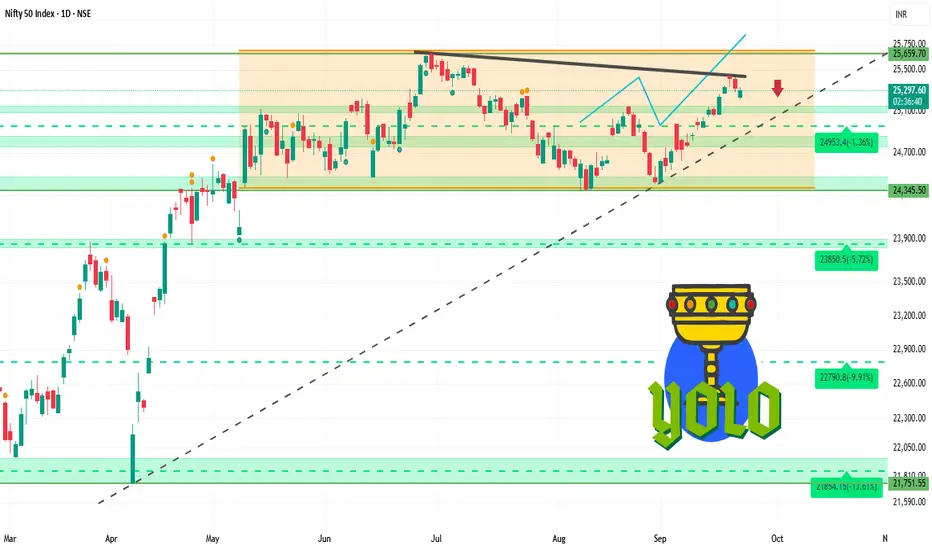
NIFTY 1D Time frame🔍 Current Market Snapshot
Current Level: ₹25,292.45
Day’s Range: ₹25,211.60 – ₹25,331.70
Previous Close: ₹25,327.05
Market Sentiment: Neutral to mildly bearish
📊 Technical Indicators
Moving Averages: The Nifty 50 index is trading slightly below its short-term moving averages, indicating potential resistance.
RSI (14): Approximately 50, suggesting a neutral stance with no clear overbought or oversold conditions.
MACD: Neutral, with the MACD line and signal line close together, indicating indecision in market momentum.
Stochastic Oscillator: Neutral, fluctuating around the midline, reflecting a lack of strong directional movement.
🧮 Strategy / Trade Ideas
Long Setup:
Entry: Consider entering near support levels (~₹25,200) if bullish reversal signals appear.
Stop Loss: Place below ₹24,800 to manage risk.
Target: First resistance around ₹25,400, then ₹25,700.
Short Setup:
Entry: If price fails to break above resistance (~₹25,400) and shows signs of reversal.
Stop Loss: Above ₹25,800.
Target: Downside toward ₹25,200, then ₹24,900.
Nifty Bank Index 1 Day View📉 Daily Price Action (Sep 19, 2025)
Closing Price: 55,458.85 (−0.48%)
Open: 55,647.95
High: 55,688.75
Low: 55,355.30
Volume: 190.00M
🔍 Technical Indicators
Relative Strength Index (RSI): Indicates momentum strength.
Moving Average Convergence Divergence (MACD): Shows trend direction and potential reversals.
Stochastic RSI: Assesses overbought or oversold conditions.
Super Trend: Signals the prevailing trend direction.
Parabolic SAR: Highlights potential reversal points.
Chaikin Money Flow (CMF): Measures the accumulation or distribution of money.
Average Directional Index (ADX): Determines trend strength.
🧭 Market Sentiment
The Nifty Bank Index experienced a decline on September 19, 2025, primarily due to profit-booking in major banking stocks, particularly HDFC Bank and ICICI Bank. Despite this, the index remains above the 55,000 level, indicating underlying strength. A sustained move above 55,600 could lead to further upside, while a break below 55,000 might indicate a bearish trend.
IPL (India Pesticides Limited) Price ActionIPL (India Pesticides Limited) closed today at ₹235.84, after trading within an intraday range of approximately ₹217 to ₹239. The stock showed strength supported by steady volumes.
Technically, IPL shows a mixed to neutral outlook. The shorter-term moving averages (10, 20, 30, 50-day EMAs and SMAs) are signaling sell, while longer-term moving averages (100 and 200-day) show buy signals, indicating some consolidation or indecision near current levels. Momentum oscillators like RSI (around 46) and MACD are neutral to slightly bearish, with some buy signals from momentum and stochastic RSI.
Support is visible near ₹220–225, with resistance near ₹240–245. Sustained trading above resistance could open bullish momentum toward ₹260, while a drop below support might trigger short-term weakness to around ₹200.
In summary, IPL sits in a cautious consolidation zone with mixed technical signals but potential for a directional move on breakout or breakdown.

LT - Technical & Trade Analysis📊 Larsen & Toubro (L&T) – Technical & Trade Analysis
________________________________________
1️. Price Action
L&T has displayed a powerful bullish move, closing at ₹3,667.80 (+2.28%) with a strong green candle on the daily chart. The price has broken above the neckline at 3,649, which coincides with the 0.786 Fibonacci retracement level, confirming a bullish reversal from recent lows. With this breakout, the stock is now well-placed to test higher levels at ₹3,731, ₹3,802, and eventually ₹3,931, while key support zones remain intact near ₹3,615 – ₹3,535. This price action clearly indicates a shift in momentum from weakness to strength.
Key Levels:
🔴 Resistance: 3696.83 | 3725.87 | 3777.73
🟢 Support: 3615.93 | 3564.07 | 3535.03
________________________________________
2️. Volume Analysis
The bullish breakout is strongly validated by volume data. On the breakout day, L&T recorded a traded volume of 2,928,060 shares, which is more than 2.38 times its 20-day average volume (1,376,896 shares). Such a significant spike in activity signals institutional buying and strong market participation, a hallmark of reliable breakouts. A VolX reading of 2.38 highlights that the move is not a random uptick but a surge backed by heavy accumulation, adding conviction to the ongoing rally.
________________________________________
3️. Technical Indicators
The technical setup offers multiple confirmations for the bullish bias. The yellow-tagged highlights show that the stock has given an RSI breakout, MACD crossover, Bollinger Band breakout, bullish VWAP signal, and a BB squeeze release, all pointing towards the start of a momentum expansion phase. Additionally, the multi-timeframe indicator table on the top right reinforces this view: Stochastic and CCI are bullish across daily and weekly timeframes, while the MACD is bullish on daily and weekly but still bearish on the monthly, hinting at some caution for long-term investors. Meanwhile, RSI at 61 signals healthy strength without yet entering overbought territory. Together, these indicators align to support the short-term bullish momentum in L&T.
________________________________________
4. Latest Update
Larsen & Toubro (L&T) has been in the spotlight recently with a series of significant developments. The company’s Heavy Civil Infrastructure vertical secured a “significant” order worth ₹1,000–2,500 crore from NPCIL for the Kudankulam Nuclear Power Project (Units 5 & 6) in Tamil Nadu, while it also bagged a major contract from NHSRCL to construct 156 km of ballastless track for the Mumbai–Ahmedabad bullet train corridor. On the flip side, L&T has expressed its intent to exit the Hyderabad Metro Phase I operations citing financial and operational challenges and confirmed it will not participate in the Phase II expansion. Financially, the company posted nearly 30% YoY profit growth in Q1FY26, supported by strong execution and a robust order book, further boosted by these fresh wins. Meanwhile, Chairman S. N. Subrahmanyan highlighted long-term succession planning and clarified remarks on work culture that recently drew public debate.
________________________________________5. Investment Outlook
📈 Bullish Case – Why L&T could go up
Breakout above neckline with volume confirmation
RSI & MACD both turning positive on Daily
Strong support zone at 3615–3560 ensures limited downside
Sectoral rotation into infra/engineering plays could fuel upside
📉 Bearish Case – Potential downside risks
Heavy resistance around ₹3,731–₹3,777 (previous supply zone)
If it fails to hold above ₹3,649, profit booking may drag it back to ₹3,585 / ₹3,535
Macro headwinds (interest rate or project delays) could stall the momentum
⚡ Momentum Case – Short-term Trading Edge
Current move shows "Buy Today – Sell Tomorrow" setup
Entry @ ₹3,674, SL @ ₹3,590.44, Target 1: ₹3,757.56, Target 2: ₹3,841.12
Risk Reward is favorable, supported by strong bullish volume
________________________________________
📅 Short-term vs Long-term Perspective
Short-Term (Swing Trade): Strong bullish case, momentum intact, low risk with clear entry/SL/targets.
Medium-Term (1–3 months): Stock can test ₹3,900–₹4,000 zone if momentum sustains.
Long-Term: Monthly MACD still bearish; investors should add gradually only above ₹3,800+ confirmation.
________________________________________
📝 STWP Trade Analysis
📊 Daily Closing Basis Trade
Entry 3,674, SL 3,590.44, T1 3,757.56 (R:R 1:1), T2 3,841.12 (R:R 1:2).
📊 Swing Trade Setup
Entry 3,674, SL 3,545.40, T1 3,802.60 (R:R 1:1), T2 3,931.20 (R:R 1:2).
Pullback level for Intraday Traders: 3643
Pullback level for swing Traders: 3585
________________________________________
Final Outlook
Momentum: Strong | Trend: Bullish | Risk: Low | Volume: High
________________________________________
💡 Learning Note
This setup demonstrates the power of combining price action, Fibonacci levels, and volume confirmation. A bullish breakout above the neckline with heavy volume plus indicator alignment is one of the most reliable swing trade setups. Double Bottom breakouts with neckline retests + volume confirmation are among the highest probability setups in technical trading
________________________________________
📈 Chart Pattern Analysis
L&T on the daily timeframe has given a Double Bottom Pattern breakout, a classic bullish reversal setup. The two bottoms were formed near the 3,535–3,560 zone, showing strong demand absorption at that level. The neckline breakout came at 3,649, confirmed with a big green candle and 2.38× average volume, which validates institutional participation. This pattern indicates that sellers failed to push the stock lower twice, and buyers have now taken control, opening the path for higher targets. Based on the pattern projection, the upside potential extends towards 3,802 → 3,931, aligning with the Fibonacci extension levels.
⚠️ Disclaimer – Please Read Carefully
The information shared here is meant purely for learning and awareness. It is not a buy or sell recommendation and should not be taken as investment advice. I am not a SEBI-registered investment advisor, and all views expressed are based on personal study, chart patterns, and publicly available market data.
Trading — whether in stocks or options — carries risk. Markets can move unexpectedly, and losses can sometimes exceed the money you have invested. Past performance or past setups do not guarantee future results.
If you are a beginner, treat this as a guide to understand how the market works — practice on paper trades before risking real money. If you are experienced, always assess your own risk, position sizing, and strategy suitability before entering trades.
Consult a SEBI-registered financial advisor before making any real trading decision. By engaging with this content, you acknowledge full responsibility for your trades and investments.
💬 Found this useful?
🔼 Give this post a Boost to help more traders discover clean, structured learning.
✍️ Drop your thoughts, questions, or setups in the comments — let’s grow together!
🔁 Share with fellow traders and beginners to spread awareness.
👉 “If you liked this breakdown, follow for more clean, structured setups with discipline at the core.”
🚀 Stay Calm. Stay Clean. Trade With Patience.
Trade Smart | Learn Zones | Be Self-Reliant 📊

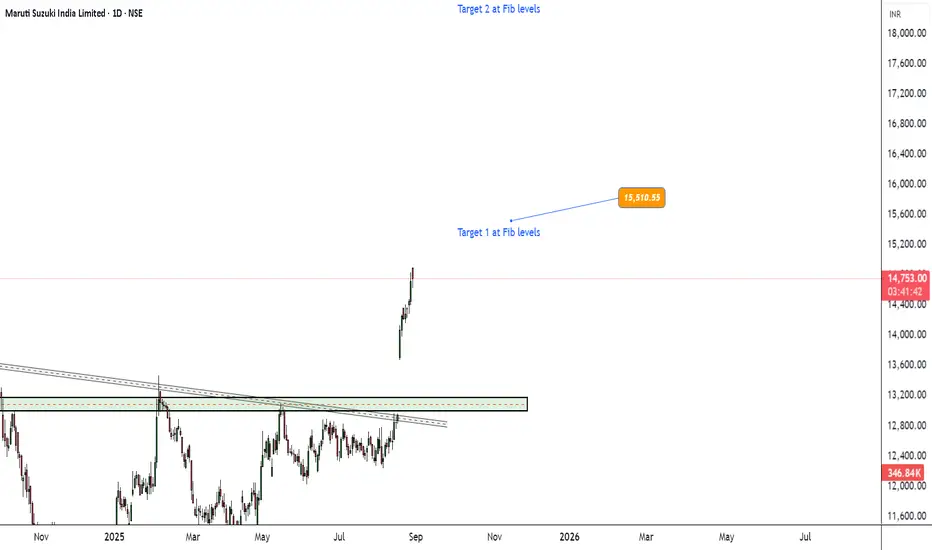
Maruti Suzuki: Strong Breakout and Key Support Levels – Sept 25The Maruti Suzuki India Limited chart displays a strong upward trend with recent price action indicating a potential consolidation or pullback after a significant rally.
Technical indicators highlight important support and resistance levels, overall momentum.
Price Action & Trend
1.The price has recently surged from around ₹13,200 to a high of ₹14,754, reflecting a robust bullish move over the observed period.
2. Candlestick patterns show a sequence of higher highs and higher lows, typical of a sustained uptrend.
3. The current price is ₹14,749, slightly below the recent high, suggesting short-term profit booking or consolidation after an aggressive rally.
Volume & Signals
1.Volume has spiked during breakout points, providing confirmation for the bullish run. A recent decline in volume may suggest waning momentum or a period of consolidation.
2.The Stochastic or RSI-like oscillator is currently at 16.82, which is in the oversold territory. This could hint at an imminent reversal or a bounce if buyers regain control.
Buying Levels -
Above all time high and targets could be placed around 15,500 and 18,000.
#swingtrading
#volumeburst
#autosectorstocks
This is just a analysis and not to be considered as buy or sell. Do your analysis before taking any positions.
Happy trading.
XAUUSD/GOLD 1H BUY PROJECTION 16.09.25XAUUSD/Gold 1H Buy Projection (16.09.25). Here’s a breakdown of the key points from your analysis:
🔹 Chart Analysis
Support & Resistance
Support S1: Around 3678 zone.
Minor Resistance Breaked: Price broke above the 3680 resistance area.
Resistance R1 (ATH): Around 3692 – 3696 area.
Entry & Stoploss
Current price: 3683.63
Stoploss: Below 3676 level.
Risk Zone (Red Area): Price should not break below this zone for the buy setup to remain valid.
Target Levels
Target Price 1: ~3688
Target Price 2: ~3692–3696
Indicators
Stochastic Oscillator (top indicator):
Showing a bullish crossover (green line crossing above red), suggesting upward momentum.
RSI (bottom indicator):
Turning upward from 64.47, showing renewed buying pressure.
🔹 Projection
The setup is bullish with expected upward movement from 3683 → 3692 → 3696+.
The chart suggests a possible pullback and continuation before reaching higher targets.
As long as 3680 support holds, momentum favors the upside.

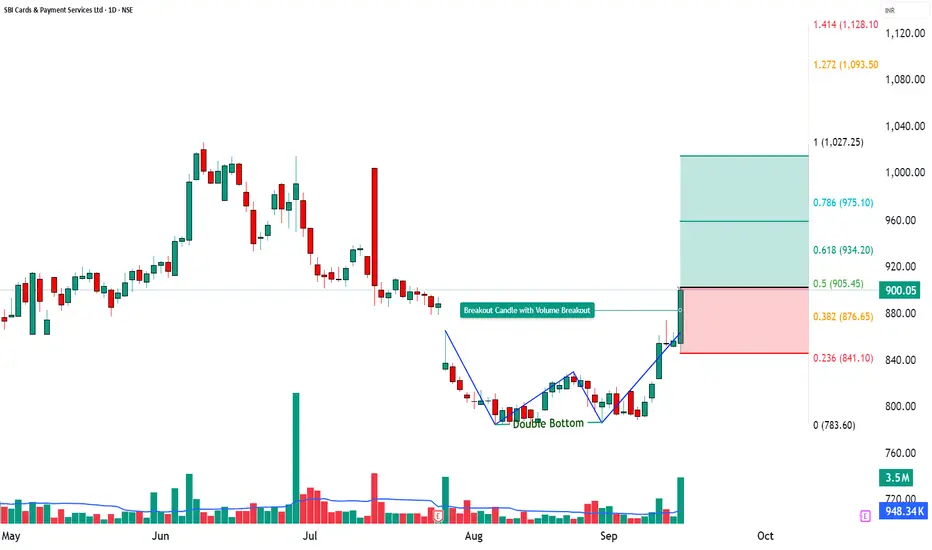
SBICARD Technical Analysis | Double Bottom Breakout Explained📊 SBICARD Trade Analysis
🔎 Price Action
SBICARD closed at ₹900.05 with a sharp +5.13% gain, backed by a volume of 35.03 lakh, far higher than its 20-day average of 9.48 lakh (VolX = 3.67x).
This massive surge in activity highlights aggressive buying and momentum revival after a consolidation phase.
________________________________________
📉 Chart Signals – Double Bottom Pattern Breakout
Strong bullish candle with heavy volumes.
RSI breakout + CCI strength confirming trend.
Bollinger Band breakout → signals upside continuation.
________________________________________
📍 Key Levels
Resistance: 919 – 938 – 974
Support: 863 – 827 – 808
________________________________________
📈 Investment Outlook
📈 Bullish Case – Why the stock could go up
High-volume breakout (VolX = 3.67x) signals strong participation.
Momentum indicators (RSI 74, CCI 238, Stochastic 98) confirm overbought strength.
Upside potential toward ₹959 – ₹1015 if buying sustains.
📉 Bearish Case – Potential downside risks
Failure to hold above ₹902 could lead to profit booking.
High RSI suggests short-term overbought → risk of pullback.
A break below ₹863 may drag toward ₹827 – ₹808.
⚡ Momentum Case – Short-term Trading Edge
Volume breakout + RSI strength highlight bullish edge.
Bollinger Band breakout points to strong near-term volatility.
Holding above ₹902–919 may fuel rally toward ₹958–₹1015.
📅 Short-term vs Long-term Perspective
Short-term (1–2 weeks): Likely to test resistances 919–974; supports 863–827 remain key.
Long-term (1–3 months): Stock in recovery phase; sustained volumes and trend strength could establish higher base above ₹900.
________________________________________
📝 STWP Trade Analysis
Outlook: Momentum: Moderate, Trend: Neutral
Entry: 902 | Stop-loss: 845.32
Target-1: 958.68 | Target-2: 1015.36
Risk/Reward: 1:6.08 | Risk: High | Volume: High
Demand Zone: 874 – 850.05 | SL: 848.95(Pullback Zone)
Learning Note: SBICARD is showing momentum revival with strong volumes; watch for sustainability above ₹900 to confirm trend continuation.
________________________________________
⚠️ Disclaimer – Please Read Carefully
The information shared here is meant purely for learning and awareness. It is not a buy or sell recommendation and should not be taken as investment advice. I am not a SEBI-registered investment advisor, and all views expressed are based on personal study, chart patterns, and publicly available market data.
Trading — whether in stocks or options — carries risk. Markets can move unexpectedly, and losses can sometimes exceed the money you have invested. Past performance or past setups do not guarantee future results.
If you are a beginner, treat this as a guide to understand how the market works — practice on paper trades before risking real money. If you are experienced, always assess your own risk, position sizing, and strategy suitability before entering trades.
Consult a SEBI-registered financial advisor before making any real trading decision. By engaging with this content, you acknowledge full responsibility for your trades and investments.
💬 Found this useful?
🔼 Give this post a Boost to help more traders discover clean, structured learning.
✍️ Drop your thoughts, questions, or setups in the comments — let’s grow together!
🔁 Share with fellow traders and beginners to spread awareness.
👉 “If you liked this breakdown, follow for more clean, structured setups with discipline at the core.”
🚀 Stay Calm. Stay Clean. Trade With Patience.
Trade Smart | Learn Zones | Be Self-Reliant 📊
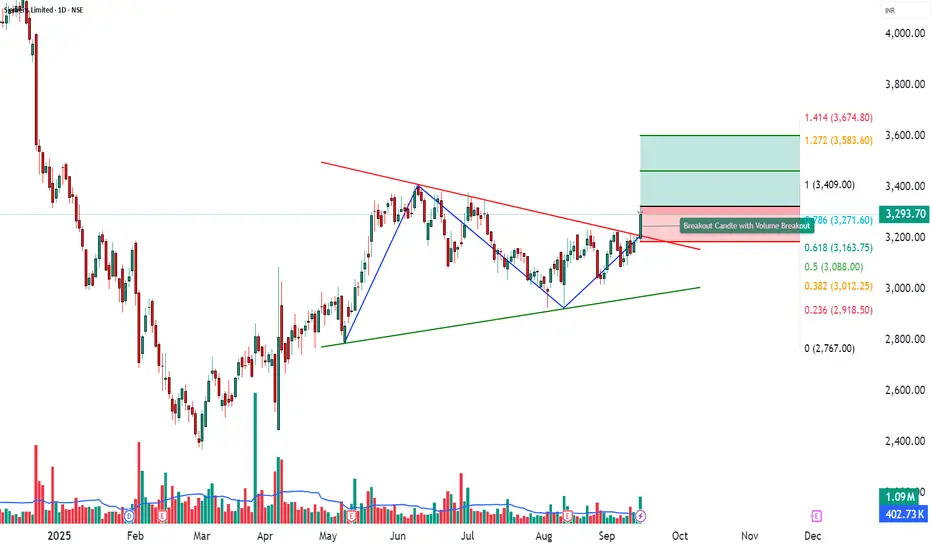
SIEMENS Analysis | Symmetrical Triangle Breakout Explained📊 SIEMENS Trade Analysis
🔎 Price Action
SIEMENS closed at ₹3293.7 with a solid +2.86% gain, backed by a volume of 10.95 lakh, well above its 20-day average of 4.02 lakh (VolX = 3.03x).
This sharp rise in activity highlights strong institutional participation, confirming bullish momentum and improving probability of continuation.
________________________________________
📉 Chart Signals – Symmetrical Triangle
Strong bullish candle backed by heavy volumes.
RSI breakout supporting positive momentum.
Bollinger Band squeeze + breakout → signals volatility expansion.
________________________________________
📍 Key Levels
Resistance: 3349 – 3404 – 3484
Support: 3214 – 3134 – 3079
________________________________________
📈 Investment Outlook
📈 Bullish Case – Why the stock could go up
Strong volume-led breakout (VolX = 3.03x).
Momentum indicators (RSI 62, CCI 193, Stochastic 89) suggest upside strength.
Sustained buying pressure may push stock toward ₹3464 – ₹3602.
📉 Bearish Case – Potential downside risks
Failure to sustain above ₹3325 could trigger profit booking.
Global or market-wide weakness may drag stock back toward supports.
Break below ₹3214 could shift bias to downside.
⚡ Momentum Case – Short-term Trading Edge
Volume surge + RSI breakout confirm short-term momentum.
Bollinger squeeze → strong volatility expansion.
Holding above 3349–3404 may open upside toward ₹3464–₹3602.
📅 Short-term vs Long-term Perspective
Short-term (1–2 weeks): Momentum-driven moves likely; watch resistances at 3349–3484 and supports at 3214–3134.
Long-term (1–3 months): Stock remains in an uptrend; sustained buying with strong volumes could establish higher base levels.
________________________________________
📝 STWP Trade Analysis
Outlook: Momentum: Strong, Trend: Bullish
Entry: 3325 – 3293.75 | Stop-loss: 3186.05
Target-1: 3463.95 | Target-2: 3602.9
Risk/Reward: 1:3.27 | Risk: Low | Volume: High
Demand zone: 3212 - 3181.50 | SL: 3177.50 - Could be a good Pullback zone
Learning Note: SIEMENS shows strong momentum with volume breakout; supports and resistances clearly define near-term trade zones.
________________________________________
⚠️ Disclaimer – Please Read Carefully
The information shared here is meant purely for learning and awareness. It is not a buy or sell recommendation and should not be taken as investment advice. I am not a SEBI-registered investment advisor, and all views expressed are based on personal study, chart patterns, and publicly available market data.
Trading — whether in stocks or options — carries risk. Markets can move unexpectedly, and losses can sometimes exceed the money you have invested. Past performance or past setups do not guarantee future results.
If you are a beginner, treat this as a guide to understand how the market works — practice on paper trades before risking real money. If you are experienced, always assess your own risk, position sizing, and strategy suitability before entering trades.
Consult a SEBI-registered financial advisor before making any real trading decision. By engaging with this content, you acknowledge full responsibility for your trades and investments.
💬 Found this useful?
🔼 Give this post a Boost to help more traders discover clean, structured learning.
✍️ Drop your thoughts, questions, or setups in the comments — let’s grow together!
🔁 Share with fellow traders and beginners to spread awareness.
👉 “If you liked this breakdown, follow for more clean, structured setups with discipline at the core.”
🚀 Stay Calm. Stay Clean. Trade With Patience.
Trade Smart | Learn Zones | Be Self-Reliant 📊
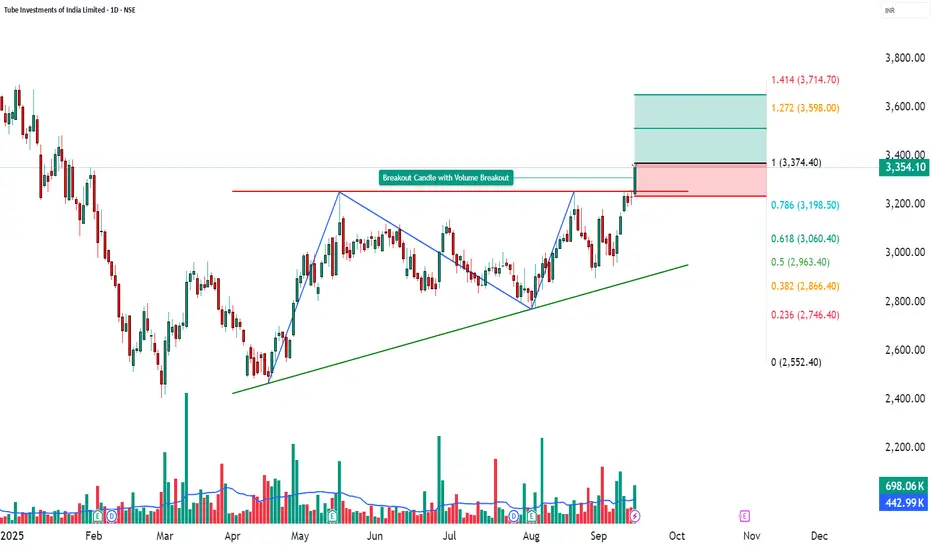
TIINDIA Technical Analysis|Ascending Triangle Breakout Explained📊 TIINDIA Trade Analysis
🔎 Price Action
TIINDIA closed at ₹3354.1 with a strong +3.8% gain, backed by a volume of 6.98 lakh, which is well above its 20-day average volume of 4.43 lakh (VolX = 1.26x).
This surge confirms strong buyer participation, supporting bullish momentum and indicating sustained strength in the uptrend.
________________________________________
📉 Chart Signals: Ascending Triangle Pattern
Strong bullish breakout candle with heavy volumes.
RSI breakout confirming underlying strength.
Bollinger Band breakout after squeeze → fresh volatility expansion and potential sustained upside.
________________________________________
📍 Key Levels
Resistance: 3405 – 3457 – 3540
Support: 3271 – 3188 – 3136
________________________________________
📈 Investment Outlook
📈 Bullish Case – Why the stock could go up
Strong bullish candle signals momentum revival.
Breakout backed by 698k vs 443k avg volume (VolX 1.26x) → strong participation.
RSI (69.1) + CCI (195) + Stochastic (95) confirm momentum.
Upside potential toward ₹3514 – ₹3653 if momentum sustains.
📉 Bearish Case – Potential downside risks
Failure to hold above ₹3374 could trigger profit booking.
Broader market or sector weakness may drag stock back to supports.
A break below ₹3270 could shift bias to downside and test ₹3188 – ₹3136.
⚡ Momentum Case – Short-term Trading Edge
Volume breakout highlights trader interest.
RSI breakout + Bollinger squeeze signal momentum strength.
Sustaining above ₹3405–₹3457 zone may extend upside to ₹3514–₹3540.
📅 Short-term vs Long-term Perspective
Short-term (1–2 weeks): Momentum-driven moves likely; watch resistances at 3405–3540 and supports at 3271–3188.
Long-term (1–3 months): Stock remains in a structural uptrend; if volumes stay above average and fundamentals support, dips toward ₹3180–₹3130 may act as re-entry zones for study.
________________________________________
📝 STWP Trade Analysis
Outlook: Momentum: Strong, Trend: Bullish
Entry: 3374.4 – 3354.10 | Stop-loss: 3234.92
Target-1: 3513.88 | Target-2: 3653.36
Risk/Reward: 1:3.55 | Risk: Low | Volume: High
Demand Zone: 3260-3190 | SL: 3185.05
Learning Note: TIINDIA is in a strong momentum phase, with supports well-positioned for short-term trend analysis.
________________________________________
⚠️ Disclaimer – Please Read Carefully
The information shared here is meant purely for learning and awareness. It is not a buy or sell recommendation and should not be taken as investment advice. I am not a SEBI-registered investment advisor, and all views expressed are based on personal study, chart patterns, and publicly available market data.
Trading — whether in stocks or options — carries risk. Markets can move unexpectedly, and losses can sometimes exceed the money you have invested. Past performance or past setups do not guarantee future results.
If you are a beginner, treat this as a guide to understand how the market works — practice on paper trades before risking real money. If you are experienced, always assess your own risk, position sizing, and strategy suitability before entering trades.
Consult a SEBI-registered financial advisor before making any real trading decision. By engaging with this content, you acknowledge full responsibility for your trades and investments.
💬 Found this useful?
🔼 Give this post a Boost to help more traders discover clean, structured learning.
✍️ Drop your thoughts, questions, or setups in the comments — let’s grow together!
🔁 Share with fellow traders and beginners to spread awareness.
👉 “If you liked this breakdown, follow for more clean, structured setups with discipline at the core.”
🚀 Stay Calm. Stay Clean. Trade With Patience.
Trade Smart | Learn Zones | Be Self-Reliant 📊