PAYTM – Technical & Fundamental Analysis📊 PAYTM – Technical & Fundamental Educational Snapshot
Ticker: NSE: PAYTM | Sector: 🏦 Digital Payments & Financial Services
CMP: ₹1,122 ▲ (as of 11 Aug 2025)
Rating: ⭐⭐⭐⭐☆ (Moderately Bullish Setup – Educational Purposes Only)
Pattern Observed: 🏆 Cup & Handle (Monthly)
PAYTM has been forming a Cup & Handle pattern on the monthly time frame, indicating the possibility of a bullish continuation. The stock recently closed at ₹1,122 (11 Aug 2025), approaching its immediate resistance zone of ₹1,151 – ₹1,180, with a potential extension toward ₹1,321 if momentum sustains. On the downside, support levels are placed at ₹1,072, ₹1,021, and ₹992. Technical indicators show RSI at 70 (breakout zone), CCI at 103, and Stochastic at 93, signaling strong momentum. While WVAP trend remains bullish and volume surged to 9.41M vs 20-SMA volume of 7.7M, the MACD is still in bearish territory, suggesting caution. Given the 52-week breakout and strong price structure, the setup currently leans bullish for swing trades, provided price holds above key supports.
One97 Communications (Paytm): Shares have gained analyst attention following a 13% rally over the past month. SEBI-registered analyst Mayank Singh Chandel highlighted Paytm’s first-ever operational profit in Q1, marking a major turnaround from losses seen just 18 months prior, bolstered by the complete exit of Chinese investor Antfin in August 2025, which is expected to improve regulatory compliance. Meanwhile, the company continues to narrow its losses—its Q1 consolidated net loss fell to ₹2.9 billion, down from ₹3.6 billion a year earlier, with a 16% year-on-year increase in revenue to ₹29.8 billion. Technically, the stock is navigating a resistance zone between ₹1,000–₹1,150, with a breakout above ₹1,150 possibly signaling further upside.
Investment Outlook & Conclusion: The stock presents a balanced risk-reward scenario. On the bullish side, continued earnings growth, sector tailwinds, and improving technical structure could support upward momentum. However, downside risks include adverse market sentiment, sectoral weakness, or failure to sustain key support levels. In the short term, price action may remain volatile with potential pullbacks, while in the long term, sustained fundamentals and trend confirmation could offer attractive opportunities.
📊 STWP Trade Analysis – The setup reflects bullish continuation characteristics in classical technical analysis. For educational illustration, a possible framework could consider a reference entry near ₹1,130, supported by an illustrative stop loss at ₹1,046 for risk management. Example upside objectives include ₹1,213 (1:1 Risk-Reward) and ₹1,296 (1:2 Risk-Reward), while a potential pullback reference zone is placed between ₹1,090 – ₹1,080 as a possible retest area.
⚠️ Disclaimer (Read Carefully)
This post is for educational and informational purposes only.
The author is not a SEBI-registered investment advisor. No buy or sell recommendations are being made.
All views are based on chart patterns, publicly available data, and personal learning experience.
Trading involves risk. Losses can exceed your investment. Always consult a SEBI-registered advisor before making financial decisions.
By engaging with this content, you agree to these terms.
________________________________________
💬 Was this useful?
Drop your thoughts, questions, or setups in the comments — let’s grow together!
🔁 Share this post with fellow traders and beginners to spread clean, structure-based learning.
✅ Follow simpletradewithpatience for beginner-friendly setups, price action insights, and disciplined trading content.
🚀 Stay Calm. Stay Clean. Trade With Patience.
Trade Smart | Learn Zones | Be Self-Reliant 📊
Search in ideas for "stochastic"

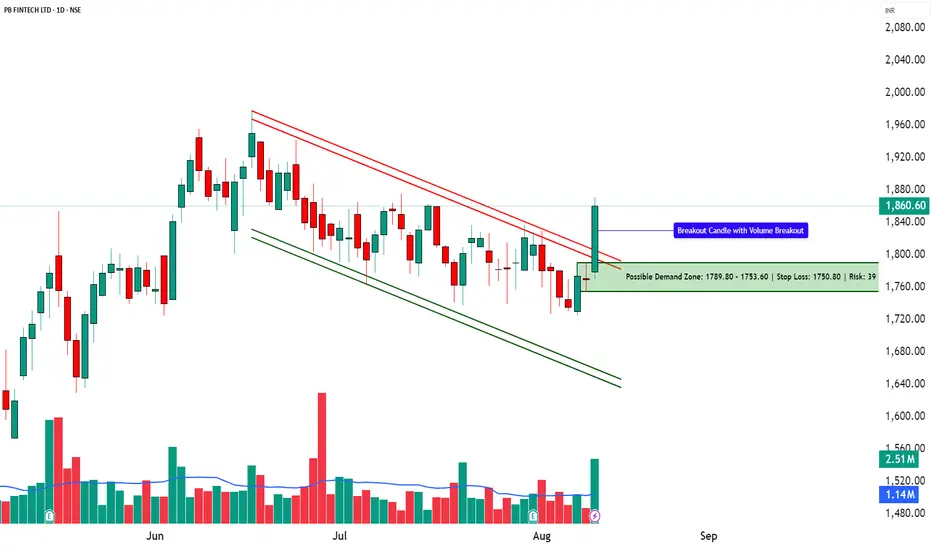
POLICYBZR – Technical & Fundamental Analysis | Channel Breakout📊 POLICYBZR – Technical & Fundamental Educational Snapshot
Ticker: NSE: POLICYBZR | Sector: Digital Insurance & Fintech
CMP: ₹1,860.60
Rating: ⭐⭐⭐ (Neutral to Moderately Bullish Setup – Educational Purposes Only)
Pattern Observed: 📈 Channel Breakout
________________________________________
POLICYBZR (CMP: ₹1,860.6) is exhibiting a Channel Breakout formation, supported by a strong bullish candle. The stock has moved from a bottom range of ₹1,558.4 towards the top range of ₹1,978, with key resistances placed at ₹1,898, ₹1,935, and ₹1,998, while supports are noted at ₹1,797, ₹1,733, and ₹1,696. Technical indicators show RSI at 59 (breakout zone), a bullish MACD crossover, CCI at 122, and Stochastic at 93, indicating strong upward momentum. The price action has also seen a Bollinger Band breakout and is trading above VWAP, suggesting bullish bias. Volume surged to 2.51M shares, significantly higher than the 20-day average of 1.14M, indicating institutional participation. Based on current momentum, there is a possibility of breakout continuation; however, traders should monitor support levels for any reversal signals.
As of early August 2025, PB Fintech’s insurance platform Policy Bazaar has been penalised ₹5 crore by the insurance regulator for certain regulatory lapses, leading to a short-term decline of around 2–3 percent in its share price. Despite this development, the company reported a 33 percent year-on-year increase in Q1 revenues, with net profit rising by 50 percent, supported by a 35 percent growth in core insurance premium collections to approximately ₹6,616 crore. In addition, its enterprise arm has introduced “ClaimSetu”, an AI-powered claims insights and scoring tool for group health insurance, aimed at streamlining documentation and potentially improving claim processing efficiency by up to 50 percent.
From an investment perspective, the outlook for PB Fintech (Policy Bazaar) remains mixed, with both upside potential and downside risks. On the bullish side, sustained revenue growth, rising profitability, and continued expansion in insurance premium collections reflect strong operational momentum. The introduction of AI-driven claim processing solutions could enhance efficiency and customer experience, potentially boosting market share over time. However, the bearish view factors in recent regulatory penalties, heightened compliance scrutiny, and the possibility of short-term sentiment pressure on the stock price. In the short term, price action may remain volatile as the market digests recent developments and broader market conditions. Over the long term, the company’s growth trajectory will depend on successful regulatory compliance, execution of technology-led initiatives, and maintaining a competitive edge in the digital insurance space.
________________________________________
📊 STWP Trade Analysis – Based on the STWP trade framework, a backtest-style example of a possible breakout setup could involve a long entry near ₹1,870.7 with a protective stop at ₹1,722.2. In similar past setups, price movements have reached zones such as ₹2,019 (approx. 1:1 risk–reward) and ₹2,168 (approx. 1:2 risk–reward).
A more conservative hypothetical example might involve an entry in the ₹1,870.70–₹1,860.60 zone, with a protective stop at ₹1,832.48 and potential upside zones at ₹1,945 and ₹2,001 — risk–reward will vary based on entry.
Additionally, a pullback scenario could be illustrated with a potential entry near ₹1,842.9, protective stop at ₹1,805.6, and upside zones aligned with resistance levels.
Possible Demand Zone (Illustrative): ₹1,789.80 – ₹1,753.60 with Stop Loss: ₹1,750.80
Approximate Risk: ₹39
________________________________________
⚠️ Risk Reminder:
Price volatility may increase due to regulatory factors, market sentiment, or broader index trends. Past chart patterns and backtests do not guarantee future performance.
________________________________________
⚠️ Disclaimer (Read Carefully)
This post is for educational and informational purposes only.
The author is not a SEBI-registered investment advisor. No buy or sell recommendations are being made.
All views are based on chart patterns, publicly available data, and personal learning experience.
Trading involves risk. Losses can exceed your investment. Always consult a SEBI-registered advisor before making financial decisions.
By engaging with this content, you agree to these terms.
________________________________________
💬 Found this useful?
Drop your thoughts, questions, or setups in the comments — let’s grow together!
🔁 Share this post with fellow traders and beginners to spread clean, structure-based learning.
✅ Follow simpletradewithpatience for beginner-friendly setups, price action insights, and disciplined trading content.
🚀 Stay Calm. Stay Clean. Trade With Patience.
Trade Smart | Learn Zones | Be Self-Reliant 📊
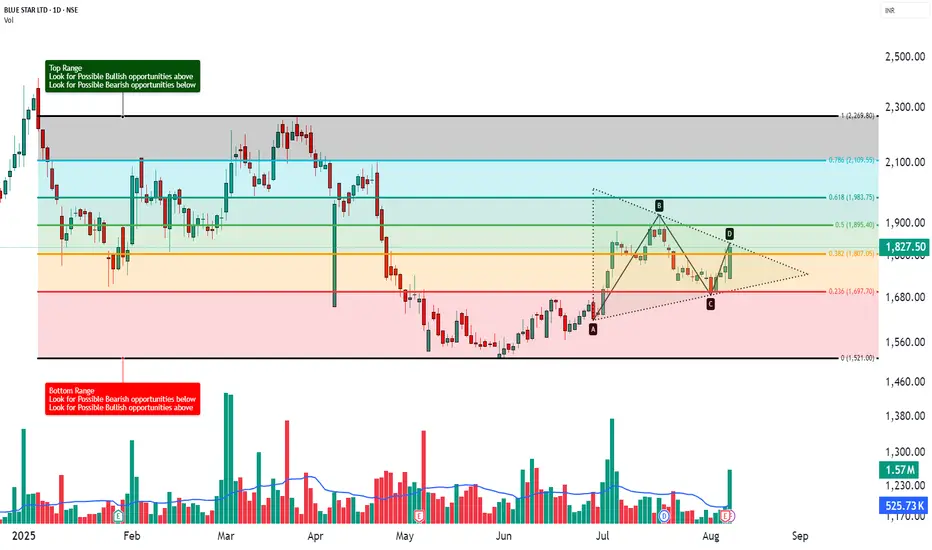
BLUE STAR LTD - Technical Analysis | Triangle Pattern ________________________________________
📊 BLUE STAR LTD – Beginner-Friendly Technical & Fundamental Snapshot
Ticker: NSE:BLUESTARCO | Sector: Consumer Durables
CMP: ₹1,827.50 ▲ (+3.23%) (as of August 7, 2025)
Chart Pattern: Symmetrical Triangle
Technical View: ⭐⭐⭐⭐ Neutral-to-Positive (Educational Purpose Only)
________________________________________
🔍 What’s Happening on the Chart?
BLUE STAR has formed a Symmetrical Triangle – a pattern where price moves within narrowing highs and lows 📉📈
This indicates consolidation and usually results in a strong breakout or breakdown.
📦 Triangle Range: ~₹1,616 to ₹1,922
👉 Current price is testing the upper edge — a breakout could be brewing!
________________________________________
🕯️ Candle & Indicator Analysis (Simplified)
Here’s what the chart and indicators show:
EMA 200 Crossover:
✅ Bullish signal – price is trading above its 200 EMA
RSI (~60):
🔼 Showing strength – not yet overbought
Stochastic (~92):
🚀 Near overbought – buyers in control
MACD:
⚠️ Still bearish – momentum confirmation is pending
VWAP:
✅ Aligned with bullish bias — suggests institutional support
📊 Volume Breakout:
🔺 Volume surged to 1.57 million, almost 3x the average of ~525.73k — a strong sign that big players may be stepping in as price nears breakout levels.
🧠 Trading Insight:
The chart looks bullish but still needs confirmation. Watch for a proper breakout above the triangle with volume.
________________________________________
📰 Recent News & Sentiment Update
Q1 FY26 Results (as of June 30, 2025):
📈 Total Income: ₹2,998.32 Cr (↑ 3.8% YoY)
💰 Net Profit: ₹122.23 Cr
(Source: Company Filings & Analyst Coverage)
Sentiment:
✅ Positive: Modest earnings growth, analyst support
⚠️ Caution: Target cut by some analysts — signals mixed expectations
________________________________________
🧭 Support & Resistance Levels
📌 Resistance Zones (Upside watch):
R1: ₹1,866
R2: ₹1,904
R3: ₹2,112 (measured move target)
📌 Support Zones (Downside watch):
S1: ₹1,750
S2: ₹1,680
S3: ₹1,616 (triangle base)
________________________________________
🔍 How to Trade a Symmetrical Triangle
A symmetrical triangle is a neutral pattern.
The breakout confirms direction:
– Above = potential upside 🟢
– Below = potential downside 🔴
📈 If Bullish Breakout Happens (above ₹1,860):
✅ Wait for a candle close above ₹1,860 with volume
🎯 Possible Price Zones: ₹2,000 → ₹2,165
🛑 Stop Loss: ₹1,750 (below triangle support)
📉 If Bearish Breakdown Happens (below ₹1,680):
✅ Wait for close below ₹1,680
🎯 Possible Price Zones: ₹1,500 → ₹1,375
🛑 Stop Loss: ₹1,750 (above triangle resistance)
________________________________________
🧠 STWP’s Educational Trade Idea (Not a Recommendation)
🎯 Long watch above: ₹1,839
🛑 Stop Loss: ₹1,719.50
📈 Risk-Reward Idea: Minimum 1:1; ideally aim for 1:2+
________________________________________
🔰 Trading Notes
✅ Always use stop losses
⏳ Be patient — wait for confirmation, not assumption
🚫 Don’t chase green candles or panic in red ones
📚 Trade based on structure, not emotions
💼 Risk only 1–2% of your capital per trade
🎯 Target minimum 1:1.5 Risk-to-Reward ratio
________________________________________
⚠️ Disclaimer (Read Carefully)
This post is for educational and informational purposes only.
The author is not a SEBI-registered investment advisor. No buy or sell recommendations are being made.
All views are based on chart patterns, publicly available data, and personal learning experience.
Trading involves risk. Losses can exceed your investment. Always consult a SEBI-registered advisor before making financial decisions.
By engaging with this content, you agree to these terms.
________________________________________
💬 Was this useful?
Drop your thoughts, questions, or setups in the comments below ⬇️ — let’s grow together!
🔁 Share this post with fellow traders and beginners to spread clean, structure-based learning.
✅ Follow simpletradewithpatience for beginner-friendly setups, price action insights, and disciplined trading content.
🚀 Stay Calm. Stay Clean. Trade With Patience.
Trade Smart | Learn Zones | Be Self-Reliant 📊
________________________________________
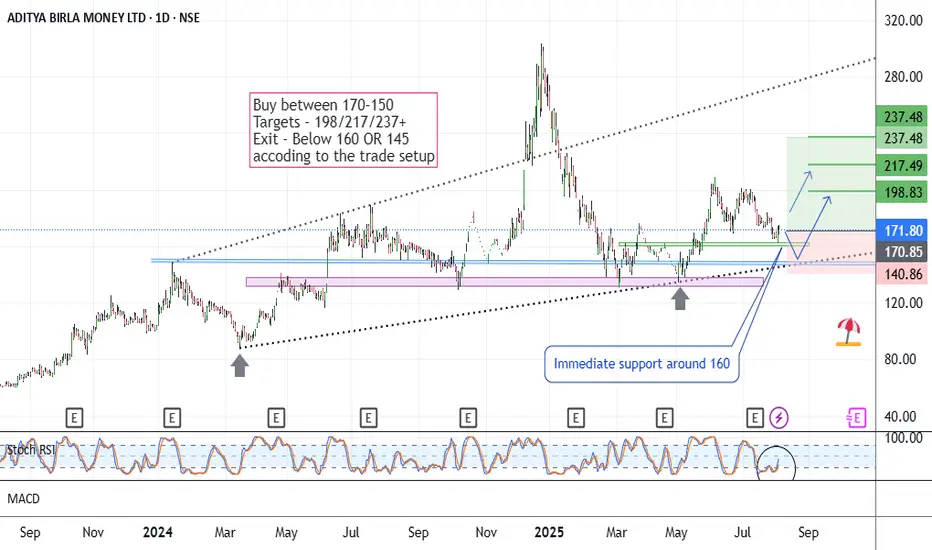
AB Money - Positional LongCMP 171.80 on 04.08.25
The chart is self-explanatory. Resistances and supports are mentioned according to the setup. Immediate support seems to be around 160, whereas the lower support area is around 148.
Stochastic RSI is trying to rise at present.
If it goes upward, targets may be 217, 237, or more.
Entry-level and position size should be considered according to the exit price (if going at a loss).
If it sustains below 145, this setup will go weak.
This illustration is purely my own view, for learning and sharing purposes only. This is not buying or selling advice, as I am not a registered analyst.
All the best.
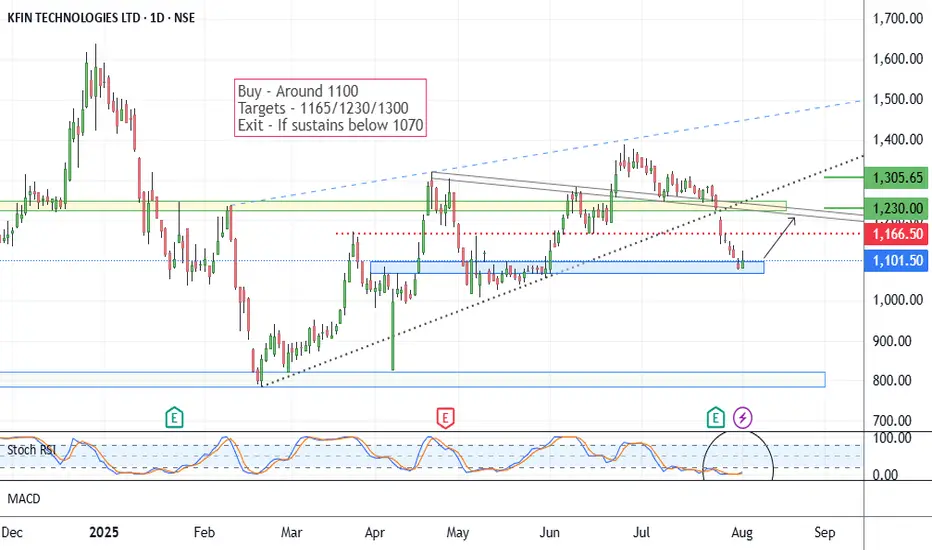
Kfintech - Positional Long SetupIn the last month of July, the stock price fell from 1380 to 1100. Presently seems on a support area. As you may see on the chart. This setup is based on a reversal possibility from the support range around 1080.
Stochastic RSI shows a reversal sign.
Possible targets may be 1165/1230 and 1305.
If it sustains below 1070-1050 levels, the setup will go weak. Below 1070, the exit plan should be considered.
One has to keep the position size according to the risk management.
All these illustrations are my personal view, only for learning and observation purposes; this is not buying or selling advice.
All the best.
$BTC Weekly Bearish Divergence is Screaming!BTC has been moving up nicely on the weekly, no doubt. But right now, it’s literally sitting on a major trendline support. I mean, this is make-or-break territory. If we lose this level and drop below $109K, I’m telling you — it could flush straight down to $95K–$90K. That’s a clean gap zone, no real structure there.
And here’s what’s bugging me — RSI is throwing up a bearish divergence, and the Stochastic RSI is also screaming the same thing. Just waiting on that MACD crossover confirmation... if that happens and the trendline breaks, this thing might not even wait for a proper retest. Could dump hard.
I’m not buying the $150K narratives right now. Personally, I don’t see it going past $125K in this cycle unless something wild happens.
Keeping it real — this is the level I’m watching like a hawk. If we break, strap in.

ESAFSFB LONGElliott Wave analysis shows that the stock has completed waves a, b, and c as a correction since its initial public offering. Currently, the stock is undergoing an impulse wave.
The stock is currently in wave (ii) and retraced 61.8% of wave (i) shows a blue color.
Wave (iii) is about to start.
RSI is above 40 i.e. is a bullish sign
Stochastic also showed a bullish crossover.
It is anticipated that wave (iii) will have about five subdivisions shown in red colour.
Wave levels are shown on the chart.
Falling wedge formation on the chart. (The falling wedge is a bullish reversal pattern)
On the downturn (dip), there is a probability of making a buy.
Level of Invalidation
The starting point of Wave (i) has been identified as the invalidation level at 49. Because as per wave rules Wave (ii) cannot retrace more than 100% of Wave (i). If the price falls below this level, it can indicate that the expected Elliott Wave pattern is not as it seems.
I am not a registered Sebi analyst. My research is being done only for academic interests.
Please speak with your financial advisor before trading or making any investments. I take no responsibility whatsoever for your gains or losses.
Regards
VJ

U.S. Inhaler Play and Strong Earnings Fuel Long-Term UpsideTicker: NSE: CIPLA
Sector: Pharmaceuticals
Market Cap: ₹1.26 lakh crore+
Current Price: ₹1,572 (as of July 28, 2025)
Technical Rating: ⭐⭐⭐⭐⭐ (Strong Buy across platforms)
________________________________________________________________________________
🔍 Strong Fundamentals Back the Bullish Momentum
CIPLA has delivered an encouraging performance in Q1 FY26, reinforcing its long-term bullish narrative. The company posted a 10% year-on-year growth in profit after tax (PAT), reaching ₹1,298 crore, while revenues climbed 4% to ₹6,957 crore. These gains were driven largely by robust performance across its domestic Indian market and continued traction in Africa. The earnings beat estimates and demonstrate management's ability to maintain profitability despite sector-wide margin pressures.
Brokerages have taken note. Antique Broking has issued a bullish price target of ₹1,875, citing confidence in CIPLA’s U.S. respiratory pipeline. Meanwhile, Nuvama has pegged a more conservative target of ₹1,651, emphasizing margin resilience. Both reflect a broader positive sentiment from the street, bolstered by the company’s continued strategic execution.
Perhaps most importantly, CIPLA's U.S. growth roadmap is gaining clarity. With a stated goal of achieving $1 billion in U.S. revenue by FY27, the company is betting big on its inhalation portfolio. The upcoming launches of generic Advair and Symbicort are expected to cushion the impact from the anticipated decline in Revlimid revenues. This pipeline visibility is a key factor that differentiates CIPLA from its peers in the pharma space.
________________________________________________________________________________
📊 Technical Structure Signals Bullish Breakout
From a technical standpoint, CIPLA has just confirmed a breakout from an ascending triangle pattern, typically viewed as a continuation setup in an uptrend. On July 28th, the stock surged above the key breakout zone of ₹1,575–₹1,580, backed by a substantial increase in volume (3.84M vs 1.68M avg), signaling institutional participation. The daily close at ₹1,572 marks a technical inflection point, with the price now firmly above its 20, 50, 100, and 200 EMAs, indicating strong trend alignment.
The momentum indicators are also supportive, though cautionary. The Relative Strength Index (RSI) hovers around 71, suggesting overbought conditions, while the MACD has given a fresh bullish crossover. Additionally, the ADX (above 25) confirms trend strength. However, traders should be prepared for short-term volatility or pullbacks, as these indicators often cool off before further upside continues.
Key support levels to watch include ₹1,536, followed by ₹1,500 and ₹1,479.5. On the upside, immediate resistances lie at ₹1,592.5, then ₹1,613 and ₹1,649. A sustained close above ₹1,580–1,592 may unlock the next bullish leg toward ₹1,650+ levels.
________________________________________________________________________________
⚠️ Risks Remain – Pricing Pressure and Valuation a Concern
Despite the bullish setup, there are risks that could temper upside momentum. CIPLA’s U.S. Revlimid portfolio is facing pricing pressure, a trend impacting the broader generics market. Any further compression could drag margins in upcoming quarters. Additionally, while the company has posted solid profits, its EBITDA margin has seen a slight dip to 25.6%, suggesting limited operating leverage.
On the valuation front, CIPLA now trades at nearly 27× P/E, pricing in much of the future growth optimism. This elevates the bar for quarterly execution. From a technical lens, the RSI and stochastic indicators remain in overbought territory, raising the possibility of near-term consolidation or minor pullbacks before the next move higher.
________________________________________________________________________________
⏳ Tactical & Strategic View – Trade the Momentum, Invest in the Vision
In the short term, momentum traders should monitor how the stock behaves around the ₹1,575–₹1,580 breakout level. If the price sustains above this zone with continued volume, it signals strength and potential for a rapid move toward ₹1,600–₹1,650. However, any retracement to the ₹1,540–₹1,550 support range could present an ideal buying opportunity, especially for swing traders looking for a defined risk-reward setup.
For long-term investors, the bullish thesis rests on execution of the U.S. strategy and maintaining growth in high-margin geographies. With brokerages projecting upside toward ₹1,650–₹1,875, and a strategic focus on inhalation therapies, CIPLA is well-positioned for structural growth. That said, investors must remain patient and allow the multi-year thesis to unfold.
________________________________________________________________________________
🧠 Market Sentiment – Cautious Optimism
Overall market sentiment remains decisively positive, supported by strong earnings, a visible product pipeline, and favorable technical alignment. Yet, caution stems from the overbought technicals and valuation concerns. A prudent approach would be to accumulate on dips near ₹1,540–₹1,550, while watching for a decisive breakout and close above ₹1,580 to confirm trend continuation.
________________________________________________________________________________
📍 Investment Thesis: Accumulate with Conviction
CIPLA’s combination of strong fundamentals, a defined U.S. strategy, technical momentum, and institutional interest makes it a compelling long-term investment. Traders and investors alike can look to accumulate on dips, while treating a breakout above ₹1,580 as a confirmation trigger for further upside. Execution risk remains, but the broader setup favors a bullish bias heading into the next quarter.
For traders looking to capitalize on Cipla’s potential breakout, two entry strategies stand out. An aggressive entry can be considered in the ₹1,572–₹1,577 range, with a stop loss placed at ₹1,558. This suits momentum traders aiming to ride an early breakout, targeting ₹1,590 as an initial objective and ₹1,610+ for extended gains, offering a risk-reward ratio of 1:1 to 1:2+. Alternatively, a low-cost entry is ideal near ₹1,564 for those seeking a better cushion against volatility, with a tighter stop loss at ₹1,542. This setup also offers attractive upside toward ₹1,580–₹1,605+, maintaining similar or better risk-reward dynamics. In both cases, a decisive breakout above ₹1,580 on strong volume would confirm the bullish structure. Traders are advised to follow strict stop-loss discipline and avoid chasing if the price stretches sharply.
________________________________________________________________________________
⚠ Disclaimer (Please Read):
• These Trades are shared for educational purposes only and is not investment advice.
• I am not a SEBI-registered advisor.
• The information provided here is based on personal market observation.
• No buy/sell recommendations are being made.
• Please do your own research or consult a registered financial advisor before making any trading decisions.
• Trading involves risk. Always use proper risk management.
• I am not responsible for trading decisions based on this post.
________________________________________________________________________________
💬 Found this helpful?
Drop your thoughts or questions in the comments below ⬇️
🔁 Share this post with your trading community – let them benefit from clean charts, structured setups, and zone-based learning.
✅ Follow simpletradewithpatience for charts, clean setups, and educational content based on price action, zones, and risk-managed trades.
🚀 Trade with patience, trust your charts, and stay clear-headed!
Be Self-Reliant | Trade with Patience | Learn with Charts & Zones 📊________________________________________________________________________________

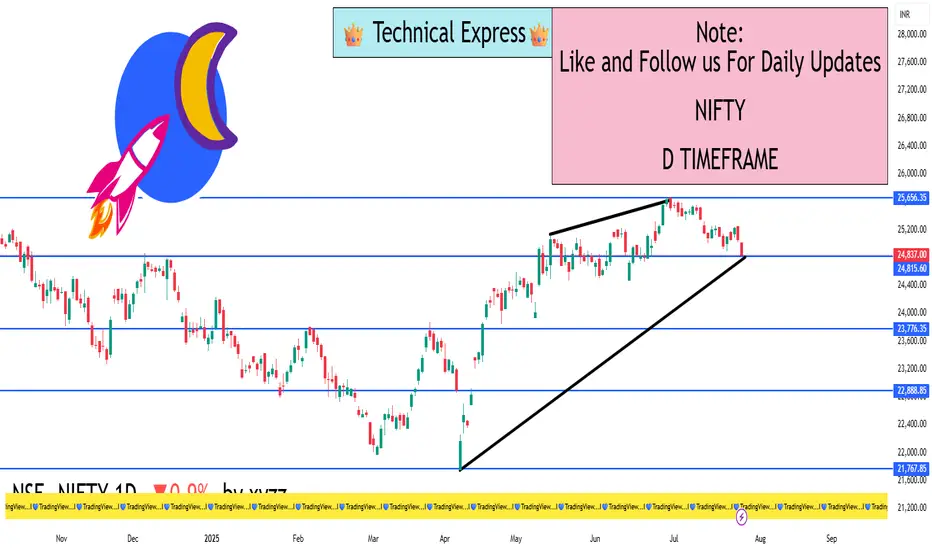
NIFTY 1D TimeframeClosing Price: ₹24,837.00
Daily Change: −0.90% (about 225 points down)
Day’s Range: ₹24,806 – ₹25,010
Volume: Moderate to slightly higher than average
Market Sentiment: Cautiously Bearish
🔍 1D Price Action Summary
The 1-day chart of Nifty shows weakness near a key resistance zone. The index has been trading in a downward-sloping range over the past few sessions. The day began with mild strength but selling pressure pushed the index down by the close.
Bearish candlestick formation with a relatively long upper wick, indicating rejection near intraday highs.
4th consecutive day of weakness, hinting at profit booking and lower highs on the chart.
The price closed near the day’s low, suggesting bearish momentum could carry into the next session.
📐 Technical Levels
✅ Support Zones
Primary Support: ₹24,800 – This level has been tested multiple times recently. A close below it could trigger further downside.
Secondary Support: ₹24,550 – Considered a swing low from earlier this month.
Major Support: ₹24,250 – The breakout level from the previous consolidation.
❌ Resistance Zones
Immediate Resistance: ₹25,050 – This was the intraday high and rejected.
Stronger Resistance: ₹25,250 – Previously a strong support zone, now turned resistance.
Major Resistance: ₹25,500 – All-time high zone; bulls will need strength to retest this.
📊 Trend Analysis
Current Trend: Short-Term Bearish
Medium-Term Trend: Neutral to Slightly Bullish
200-DMA (Daily Moving Average): Nifty is trading above the 200-DMA, keeping the long-term trend intact.
50-DMA: Price is nearing the 50-day moving average. A break below could accelerate selling pressure.
📈 Chart Patterns Observed
Head and Shoulders Pattern (Forming): The right shoulder is under formation; neckline lies near ₹24,800. Breakdown could trigger a short-term fall of 200–300 points.
Bearish Engulfing Candlestick (on the daily): Indicates aggressive seller dominance.
Lower Highs and Lower Lows: A sign of short-term downtrend.
🧠 Institutional & Retail Activity
FIIs (Foreign Institutional Investors): Net sellers over the past few sessions. Sentiment cautious due to global macro uncertainty.
DIIs (Domestic Institutions): Providing some support on dips, but not aggressively buying.
Retail Traders: More active in options and short-term plays; volatility increasing.
💡 Trading Strategy Ideas (Short-Term)
🔻 For Bears (Short-Side Traders)
Consider short positions below ₹24,800 with targets around ₹24,550–24,400.
Use strict stop-loss above ₹25,050 to manage risk.
Bearish bias valid until the price closes above ₹25,250.
🔼 For Bulls (Dip Buyers)
Watch for price action around ₹24,800–24,550 for signs of reversal.
Ideal scenario: bullish engulfing candle or bullish divergence on RSI.
Avoid aggressive buying unless the index reclaims ₹25,250.
🕯️ Candle Psychology Summary
The market opened near flat, tried to move higher, but was met with consistent selling.
This created a long upper wick – a sign that bulls lost control quickly.
The close near the low signals sellers had the upper hand all day.
🚨 Key Takeaways
Nifty is under pressure with key support at ₹24,800 in focus.
A breakdown below this level could drag the index to ₹24,550 or even lower.
Bulls must reclaim ₹25,250 to shift momentum in their favor.
RSI and MACD show weakness, but Stochastic hints a possible oversold bounce soon.
Volatility remains high; risk management is critical.
XRP oversoldxrp might have a possible reversal up to 3.4, based on the stochastic indicator it crossed the oversold line and at the same time cross the orange line vix fix is also green

USDT Dominance Forming Triple Bottom – Bearish SignalUSDT Dominance is showing a triple bottom formation on the daily timeframe – a pattern that historically signals a potential reversal or bounce. Each time USDT.D has tested this region in the past, we've seen a strong bounce in dominance, often followed by pullbacks in BTC and altcoins due to their inverse relationship.
Key indicators aligning:
RSI is rebounding from oversold levels
Stochastic RSI showing upward momentum
MACD also signaling a possible bullish crossover
With August traditionally being a bearish month, we may be heading into a corrective phase or even a sharp dump across the crypto market.
📉 Take profits where needed and prepare for the next opportunity. Stay cautious and trade with discipline.

Nifty 50 - 1D Timeframe📊 Nifty 50 – Daily Chart Overview (1D Timeframe)
Current Close (July 18): Around 24,968
Change: Down ~143 points (–0.57%)
Intraday Range: High ~25,145 | Low ~24,918
52‑Week Range: 21,744 to 26,277
YTD Performance: Approximately +5.6%
📈 Technical Indicators
RSI (14-day): ~32.5
This shows that the market is entering bearish territory, but not yet oversold.
MACD: Below signal line, value ~–67
A clear sell signal, confirming negative momentum.
Stochastic Oscillator: Above 98
Indicates that the index is overbought, and a correction may be due.
ADX (Average Directional Index): ~48
Signifies a strong trend—right now, it’s favoring bearish movement.
Other Oscillators (CCI, ROC, Ultimate): Mostly giving sell signals
🧠 Market Sentiment & Context
Nifty has been bearish for the third straight week
Trading is happening below the 20-day EMA, suggesting downward pressure
Overall tone is range-bound and lacking momentum due to:
Weak quarterly earnings
Foreign investor selling
Global market uncertainty
📉 Volatility & Risk Gauge
India VIX: ~11.2 to 11.4
This is the lowest in 15 months, signaling low market fear
Low VIX often means sideways consolidation and narrow movement
📊 Put-Call Ratio (PCR) & Options View
PCR (based on open interest): ~0.80
Indicates a bearish bias
More calls being written compared to puts
🏦 Bank Nifty Overview (for Comparison)
Close: ~56,283
Drop: ~1%
RSI: ~28 (Bearish)
MACD: Sell signal
Resistance: 57,200 – 57,600
Support: 56,300 – 55,800
Bank Nifty is also showing bearish momentum and mirrors Nifty’s structure.
📅 What to Watch Next
Corporate Q1 results – especially from large caps like Reliance, HDFC, ICICI
Global cues – US inflation, interest rate decisions, global markets
India VIX – If it spikes above 14–15, market fear might return
FIIs activity – Any strong buying/selling can swing the market
✅ Summary (Daily Timeframe)
Nifty is currently weak and range-bound
Key level to hold: 24,900
Key level to break: 25,250
Momentum is with sellers; cautious approach recommended
If no trigger appears, expect sideways movement or slow decline

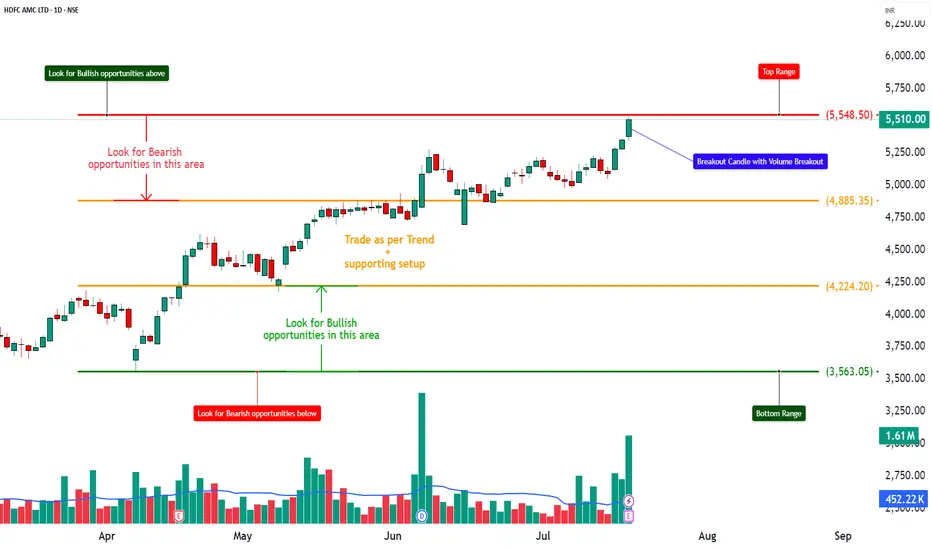
HDFCAMC – Strong Bullish Breakout on High Volume📈 HDFCAMC – Strong Bullish Breakout on High Volume
📅 Setup Date: 18.07.2025 | ⏱ Timeframe: Daily
📍 Strategy: Short-Term HNI Swing Setup
__________________________________________________________________________________
📝 Price Action Summary – HDFCAMC
HDFCAMC has delivered a textbook price action breakout, marked by a wide-range bullish candle on 3x average volume — confirming strong institutional participation. After weeks of tight consolidation and multiple failed attempts near the ₹5,385 resistance zone, the price finally broke out with a clean close near day’s high, indicating minimal selling pressure and clear buyer dominance. The breakout follows a classic compression-before-expansion setup, with the previous range acting as a base for momentum. Importantly, the absence of upper wick, strong follow-through, and volume-backed surge signal genuine strength — not a false breakout. Price has now entered a discovery phase with open space toward ₹5,673–₹5,800. As long as ₹5,385 holds as support, the bulls remain in control, and dip buying remains a high-probability setup. This is a classic case of price action speaking louder than indicators — structure, strength, and story all aligned.
__________________________________________________________________________________Trade Logic – Why This Setup:
Strong Price Structure: The stock has formed a bullish candle backed by a 20-day volume breakout, closing near the highs—indicating strong, sustained demand.
Breakout Confirmation: Price has cleanly broken out from a short-term base formed by multiple candle congestion. It's also trading above the prior resistance level of ₹5,385, confirming breakout strength.
__________________________________________________________________________________ Indicator Confluence: The RSI stands strong at 72, signaling bullish momentum. Additionally, the stock is breaking out of a Bollinger Band squeeze—an early sign of a potential momentum ignition. MACD, CCI, and Stochastic indicators are all aligned in bullish zones across daily, weekly, and monthly timeframes.
EMA Alignment: The stock is trading above all major exponential moving averages (9, 20, 50, 100, and 200 EMA), suggesting healthy trend harmony and support at every timeframe.
VWAP Positioning: Current price action remains well above the daily VWAP, indicating buying interest from institutional players and strong demand zones building underneath.
Volume Spike: Today's volume was 1.61 million, compared to the 10-day average of 452,000—more than a 3x surge, confirming strong buyer conviction and institutional participation.
Open Upside Potential: There are no significant supply zones visible until ₹5,800–₹6,000, offering a clear path for price expansion and swing targets.
Sector Tailwinds: The financial services and AMC sector is witnessing renewed traction after positive earnings and improved fund flow trends, supporting broader strength in related counters.
__________________________________________________________________________________ Would I Enter Now?
YES – Enter Now or on Dip
Reason: Price has just cleared a major volume cluster with strong momentum. Waiting too long might mean missing the breakout. The best approach would be:
• Enter 50% now
• Add 50% near ₹5,495–₹5,485 if there’s an intraday dip
__________________________________________________________________________________ 📈 Resistance Zones
• 🔴 R1: 5,591.5 (possibly weak)
• 🔴 R2: 5,673
• 🔴 R3: 5,797
📉 Support Zones
• 🟢 S1: 5,385
• 🟢 S2: 5,261
• 🟢 S3: 5,179
__________________________________________________________________________________ Direction: Buy (Bullish Bias)
Entry Price: ₹5,510 (Current Market Price)
Alternate Entry: On slight dips to ₹5,485–₹5,495 (ideal risk-managed zone)
Stop Loss: ₹5,385
Reason: This is Support 1 and a key VWAP-based level from the recent volume structure. A breach here invalidates the bullish strength.
Risk–Reward Ratio: 1:1 | 1:2 | +
__________________________________________________________________________________ Overall Bias: Bullish
Spot Price: ₹5,510
Trend: Strong upward momentum
Volatility: Slightly cooling IV (esp. in puts), but still elevated → good for defined-risk strategies
Ideal Strategy Mix: Naked CE or Call Debit Spread (defined-risk bullish strategy)
1. 🔼 Bullish Trade (Naked options as per trend)
Best CE: Buy 5400 CE @ ₹197.95
Why: Strong long buildup with rising OI, high volume, and solid delta — indicating institutional interest and momentum-backed directional strength.
__________________________________________________________________________________ 2. 🔽 Bearish Trade (Naked options as per trend)
Best PE: Sell 5200 PE @ ₹26.5
Why: Strong put writing seen with rising OI and price drop, suggesting low downside risk and income potential if bullish trend holds.
__________________________________________________________________________________
3. ⚙️ Strategy Trade (As per trend + OI data)
Strategy: Call Debit Spread → Buy 5400 CE + Sell 5600 CE
Net Debit: ₹197.95 - ₹92.6 = ₹105.35
Max Profit: ₹200 (spread) - ₹105.35 = ₹94.65
Max Loss: ₹105.35
Risk:Reward ≈ 1 : 0.9
Lot Size: 150
Total Risk: ₹15,802.5
Max Profit: ₹14,197.5
Why: This call spread is ideal because both the 5400 CE and 5600 CE are showing strong long build-up, indicating that traders expect the price to move higher. The 5600 CE has a sharp 168% jump in open interest with high volume, suggesting it’s a realistic target zone. By using a spread (buying 5400 CE and selling 5600 CE), we reduce the upfront cost and limit losses while still capturing upside. It also protects against time decay if the stock consolidates before moving up.
__________________________________________________________________________________ ⚠ Disclaimer (Please Read):
• These Trades are shared for educational purposes only and is not investment advice.
• I am not a SEBI-registered advisor.
• The information provided here is based on personal market observation.
• No buy/sell recommendations are being made.
• Please do your own research or consult a registered financial advisor before making any trading decisions.
• Trading involves risk. Always use proper risk management.
STWP is not responsible for trading decisions based on this post.
__________________________________________________________________________________ 💬 Found this helpful?
Drop your thoughts or questions in the comments below ⬇️
🔁 Share this post with your trading community – let them benefit from clean charts, structured setups, and zone-based learning.
✅ Follow simpletradewithpatience for charts, clean setups, and educational content based on price action, zones, and risk-managed trades.
🚀 Trade with patience, trust your charts, and stay clear-headed!
Be Self-Reliant | Trade with Patience | Learn with Charts & Zones 📊
__________________________________________________________________________________
*********************************************************************************************************************
Caution: This is a result based stock
*********************************************************************************************************************
Bank Nifty Price Action# BANKNIFTY Hourly Chart Price Analysis
## Overview
On the hourly chart, BANKNIFTY is exhibiting a cautious and volatile structure, with technical indicators suggesting a mix of short-term weakness and potential for intraday momentum. The index is trading near key support and resistance levels, and traders are closely watching for breakouts or breakdowns to determine the next directional move.
- **Above 57,070:** Intraday bullish momentum is likely.
- **Below 56,900:** Weakness and potential downside may emerge.
- **Holding above 55,750:** Maintains a positive undertone for the broader trend.
## Technical Indicators
- **Moving Averages:** Most short-term and medium-term moving averages are signaling a bearish bias, with prices trading below the 5, 10, 20, and 50-period averages.
- **RSI (Relative Strength Index):** Hovering in the neutral to slightly bearish zone, indicating lack of strong momentum but not yet oversold.
- **MACD:** Shows bearish crossover, supporting the short-term negative bias.
- **Stochastic Oscillator:** Indicates overbought conditions on some timeframes, cautioning against aggressive long positions.
- **ATR (Average True Range):** High, reflecting elevated volatility and potential for sharp intraday swings.
## Price Action Insights
- The index recently broke below a short-term ascending pattern, increasing the risk of further declines if support levels are breached.
- Intraday trading is expected to remain volatile, with sharp moves likely around key pivot levels.
- Sentiment is cautious due to global factors and domestic flows, but the downside is cushioned by institutional buying on dips.
## Trading Outlook
- **Bullish Scenario:** Sustained move above 57,070 with strong volume could open up targets towards 57,300 and 57,500.
- **Bearish Scenario:** Failure to hold above 56,900 may see the index test 56,500 and lower supports.
- **Neutral/Bounce Play:** Sideways consolidation is possible if the index holds between 56,900 and 57,070, with traders advised to wait for a clear breakout.
**Note:** High volatility and mixed signals call for disciplined risk management and quick decision-making on intraday trades.

Nifty call for 14-07-2025Nifty may open with slight gap down as per SGX NIFTY. A long red candle with upper wick was formed on Friday which is indicated nifty has embraced by bears and technical indicators like MACD CROSSOVER, RSI STOCHASTIC, turns into negative biased. In the coming sessions we may seen the nifty around 24900 has no ruled out. The nifty strategy is SELL ON RISE until upto closed decisively above 25300 levels. I am expecting investors may focused on individual stocks based on Q1
results. The Mid Cap IT stocks may perform well during this quarter bcoz their margins are improve better than large cap IT stocks.
NETWEB TECHNOLOGY which is the stocks may perform well in the coming quarter so I suggested to investors adding this stock to their portpolio with strict stop losses.
Support levels 25050,24950
Resistancee levels : 25250,25300
Disclimer : I AM NOT A SEBI RESEARCH ANALYST OR FINANCIAL ADVISOR, these recommendations are only for education purpose, not for trading and investment purpose please take an advise from your financial advisor before investing on my recommendations.
🙏 : If you liked my content please suggest to your friends follow my trading channel. Your likes and comments provide boosting to me to update more financial information.
Thankng you

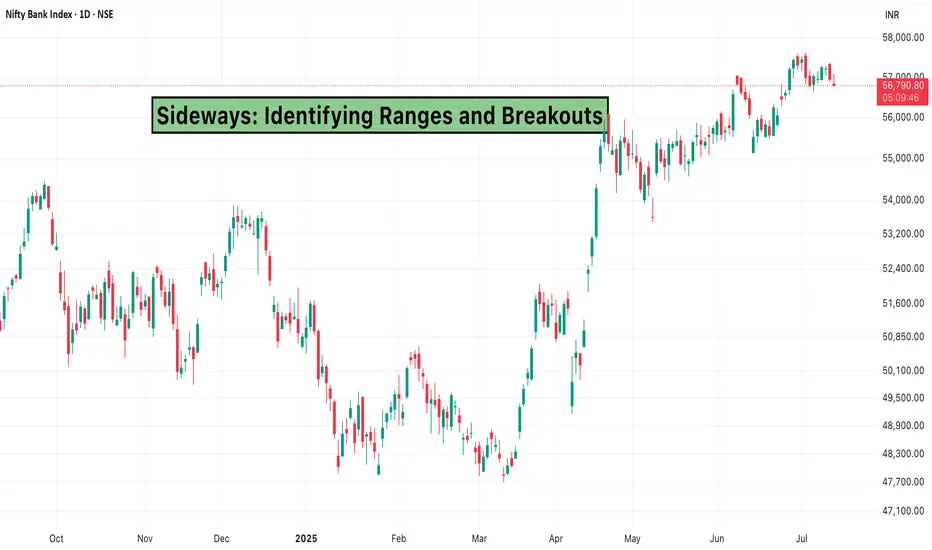
Sideways: Identifying Ranges and BreakoutsMaster the quiet before the move.
Not every market moves in strong trends. In fact, many stocks spend a lot of time trading sideways moving within a defined range without making a clear move up or down. While this can frustrate trend-following traders, sideways phases actually offer great setups if you know what to look for.
Understanding how to identify sideways markets, define price ranges, and spot breakouts early can help you enter trades with better timing and stronger conviction.
What is a Sideways Market?
A sideways market (also called a consolidation or range-bound market) is when a stock or index trades between horizontal support and resistance levels for an extended period. The price lacks clear direction, and both buyers and sellers seem to be in balance.
During this phase:
Volatility contracts
Indicators flatten out (e.g., Moving Averages)
Breakouts or breakdowns are often short-lived until they aren’t
These quiet zones can build up pressure. When a breakout finally occurs, it often leads to a significant price move.
How to Identify a Range
Look for:
Horizontal support and resistance: Price bounces between two levels without breaking out.
Flat Moving Averages: The 20, 50, or 100-period MA may start to go sideways.
Diminished volume: Volume often tapers off during consolidation.
Failed breakouts: Price may pierce the top or bottom of the range but quickly revert.
Using tools like rectangles or horizontal rays on TradingView helps visualize the range clearly.
Trading the Range vs. Trading the Breakout
You can approach sideways markets in two ways:
Range Trading
Buy near support
Sell near resistance
Use indicators like RSI or Stochastic to confirm overbought/oversold conditions
Range trading works best when the price has respected the zone multiple times and volume is low.
Breakout Trading
Wait for price to close outside the range
Look for increased volume on the breakout
Confirm with indicators like MACD crossover or momentum surge
Breakouts from sideways zones often lead to trending moves especially if the range has held for several days or weeks.
Why Sideways Markets Matter
While many traders wait for big trends, experienced traders know that sideways markets are where setups are built. Whether you’re scalping quick moves inside the range or preparing for a breakout, this phase is rich with opportunities if you’re patient and prepared.
Conclusion
A sideways chart isn’t just “nothing happening” it’s a pause with purpose. Identifying ranges correctly allows you to stay out of noisy trades, time your entries better, and prepare for explosive breakouts.
Bullish on SBIN 808
Price Action: SBIN is currently trading around ₹808 after a healthy pullback. The price is near a major support zone and showing early signs of rever
Structure: It has respected its previous swing lows, indicating possible base formation.
Trend: Still within a long-term uptrend, now offering a favorable risk-reward near support.
🔍 Key Levels to Watch
Immediate Support: ₹795–₹800 zone (important structure support)
Resistance Zone: ₹830–₹835 (initial target)
Breakout Level: ₹835+ for fresh momentum toward ₹850+
📈 Indicators Confirmation
RSI: Near 45–50, stabilizing after being weak—setting up for a reversal.
Stochastic (14,3,3): In oversold territory on both 15m and 1D timeframes—potential early bottoming signal.
Moving Averages: Price is around the 50 EMA and still above the 200 DMA on daily charts, maintaining medium-term bullish bias.↳

Indus Towers ! Small Swing Possible ?Indus Towers Ltd is a leading telecom infrastructure provider in India, supporting mobile network operators with tower infrastructure across the country. With the ongoing 5G rollout and rising data consumption, the long-term outlook remains favorable.↳
🔍 Technical Setup
Price Action: The stock has shown a clean bounce from a recent support zone, suggesting strong demand at lower levels.
Trend: It is now trading above its 20-DMA and 50-DMA, with the 200-DMA also flattening, indicating trend stabilization.
Momentum: Indicators like RSI are climbing from neutral territory, and Stochastic (14,3,3) crossover hints at short-term bullish momentum.
📊 Volume & Participation
Volume has picked up along with price recovery, suggesting institutional buying interest.
Recent candles show buying tails, a sign of demand absorption on dips.
🎯 Swing Trade Opportunity
Target: 5–8% upside potential from current levels.
Stop Loss: dont invest ,more than 5%.
Timeframe: 5–10 trading sessions.
🧠 Why It’s Attractive
Sectoral tailwinds due to 5G infrastructure growth.
Technically favorable with low risk-reward ratio.
Positive retracement and price consolidation make it a good candidate for a small swing trade.

CAMS – Rising Wedge in Focus ________________________________________________________________________________
📈 CAMS – Rising Wedge in Focus
🕒 Chart Type: Daily
________________________________________________________________________________
What’s Catching Our Eye:
CAMS is forming a Rising Wedge, a technical structure that often leads to strong directional moves. The price is nearing the upper boundary of the wedge, indicating possible breakout or reversal. This contraction in range is typically followed by expansion — and smart traders are watching closely.
________________________________________________________________________________
What We’re Watching For:
Price holding above ₹4201.40 could trigger interest from early participants. On the flip side, a breakdown below ₹4090.50 may signal failure of the wedge structure. For more confirmation-driven entries, one may wait for a proper breakout or breakdown candle with volume.
________________________________________________________________________________
Volume Footprint Analysis:
As expected in wedge formations, volume has compressed. A breakout supported by volume expansion could validate the move and offer confidence in continuation. Volume is the key trigger to watch once the wedge resolves.
________________________________________________________________________________ Option Structure Insight:
For educational purposes, one could observe a neutral hedge approach using options:
– Buy 4200 CE
– Buy 4100 PE
This can potentially help capture a sharp move in either direction. Once the move confirms, the opposite leg can be exited to ride the trend with managed risk.
Price Action Logic:
Rising wedge formations typically form after a directional up-move and narrow into a tightening range. This is often followed by an impulsive expansion phase. CAMS is showing that exact setup. The price is sandwiched between key resistance at ₹4200+ and demand near ₹3880.
________________________________________________________________________________
💼 Sector Tailwinds:
CAMS, operating within the mutual fund RTA space, benefits from India's rising retail participation and SIP growth. The digitalisation of mutual fund flows, compliance demand, and data-based services lend long-term support to this sector. These factors offer fundamental strength to this technical setup.
________________________________________________________________________________
⚠️ Risks to Watch:
– A close below ₹4085 could invalidate the bullish wedge setup
– Current price behavior reflects compression, but indicators like Stochastic may suggest near-term overbought conditions
– Avoid chasing — wait for confirmation via breakout + volume or a proper retest candle
– Do not over-leverage in a low-volume wedge structure — focus on proper R:R and sizing
________________________________________________________________________________
🔮 What to Expect Next:
If the wedge breaks upward and sustains above ₹4201.40 with volume, price expansion may be observed toward ₹4330–₹4450 zone. On the downside, a breakdown below ₹4090.50 may trigger a move toward the ₹3950–₹3880 support cluster. Watch for confirmation in the next 2–3 sessions before taking directional exposure.
________________________________________________________________________________
🧠 How to Trade CAMS (For Educational Use Only):
🔹 Breakout Trade Plan
• Entry: Above ₹4201.40
• Stop Loss: Below ₹4090.50 (closing basis preferred)
• Pullback Entry: If price returns to ₹4095–₹4105 zone and shows bounce confirmation
• Risk-Reward: Start with 1:1, trail for 1:2+
• Position Sizing: Based on risk, never overexpose in a wedge
🔹 Options Strategy (Educational View)
• Buy CAMS 4200 CE
• Buy CAMS 4100 PE
• Exit the losing leg once direction confirms with price + volume breakout
________________________________________________________________________________
📍 Levels to Keep an Eye On:
The first key level to observe is ₹4201.40 — a break above this may attract early interest from aggressive participants as it represents the upper boundary of the rising wedge. On the downside, ₹4090.50 acts as the breakdown level; if breached, it could suggest structural weakness and a potential shift in trend.
In case of an upward breakout, we are closely monitoring the ₹4330–₹4450 zone as a possible price expansion area. If the breakdown plays out instead, the ₹3950–₹3880 zone becomes important as a potential reaction area or demand test.
Historically, the ₹3880–₹3950 range has shown signs of buyer interest and may act as a demand zone if retested. On the upside, ₹4320–₹4400 has acted as supply in the past and could present resistance if the price extends higher.
A close below ₹4085 would invalidate the bullish wedge structure and may require a reassessment of directional bias.
________________________________________________________________________________
⚠️ Disclaimer (Please Read):
• This chart is shared for educational purposes only and is not investment advice.
• I am not a SEBI-registered advisor.
• The information provided here is based on personal market observation.
• No buy/sell recommendations are being made.
• Please do your own research or consult a registered financial advisor before making any trading decisions.
• Trading involves risk. Always use proper risk management.
________________________________________________________________________________
💬 Found this helpful?
How would you prefer to approach this — breakout entry or pullback into zone?
Drop your thoughts or questions in the comments below ⬇️
🔁 Share this post with your trading community.
✅ Follow @SimpleTradeWithPatience for price-action backed technical setups.
🚀 Let’s trade with patience, logic, and clarity!
Be Self-Reliant | Trade with Patience | Learn with Logic
________________________________________________________________________________

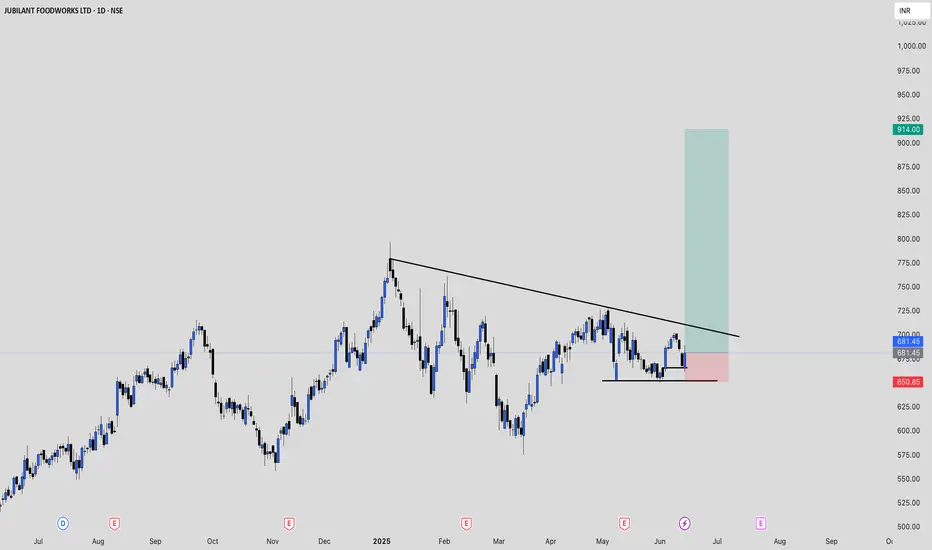
JUBLFOOD price actionJUBLFOOD (Jubilant Foodworks) is currently trading at ₹681.45 as of June 13, 2025, up 2% for the day. Over the past year, the stock has gained about 26.5%, though it remains roughly 14% below its 52-week high of ₹796.75 and about 30% above its 52-week low of ₹522.25.
Technically, the stock is showing mixed signals. The RSI is neutral around 49.5, while MACD and ADX are giving sell signals. However, most short-term moving averages (except the 5 and 50-day) are showing buy signals, and the price is currently above the VWAP, indicating some short-term strength. The Stochastic RSI is in the overbought zone, suggesting caution.
Fundamentally, JUBLFOOD is trading at a high P/E of 197, which points to an expensive valuation. Its book value is ₹31.9, with the stock trading at over 21 times book value. The dividend yield is low at 0.18%, and the average ROE over three years is moderate at 13.8%. The company remains a leader in the quick-service restaurant sector in India, holding franchise rights for Domino’s, Dunkin’ Donuts, and Popeyes.
Analysts have a wide range of price targets, from as low as ₹516 to as high as ₹1,000. While the company’s fundamentals are strong, the high valuation and mixed technicals suggest investors should be cautious. The short-term trend is up, but further upside will depend on sustained buying and a breakout above resistance levels.
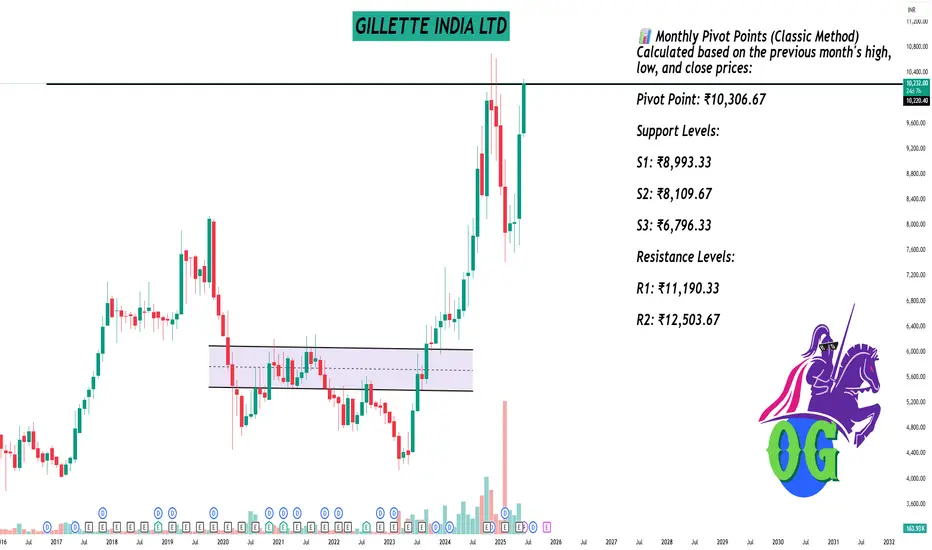
GILLETTE INDIA LTDAs of June 6, 2025, Gillette India Ltd. (NSE: GILLETTE) is trading at approximately ₹10,232.00, marking a 27.45% increase over the past month.
📊 Monthly Pivot Points (Classic Method)
Calculated based on the previous month's high, low, and close prices:
Pivot Point: ₹10,306.67
Support Levels:
S1: ₹8,993.33
S2: ₹8,109.67
S3: ₹6,796.33
Resistance Levels:
R1: ₹11,190.33
R2: ₹12,503.67
🔍 Fibonacci Pivot Points
Based on Fibonacci calculations:
Pivot Point: ₹10,306.67
Support Levels:
S1: ₹9,832.59
S2: ₹8,154.08
S3: ₹6,796.33
Resistance Levels:
R1: ₹10,351.08
R2: ₹11,190.33
📈 Technical Indicators Summary
Moving Averages: All major moving averages (MA5, MA10, MA20, MA50, MA100, MA200) are indicating a Strong Buy signal.
Relative Strength Index (RSI): 81.19 – Overbought
MACD: 194.05 – Buy
ADX: 96.24 – Overbought
Stochastic Oscillator: 82.92 – Overbought
📌 Trading Insights
Immediate Resistance: ₹11,190.33 (Classic R1)
Immediate Support: ₹8,993.33 (Classic S1)
Given the current price of ₹10,232.00, the stock is trading near its pivot point, suggesting potential for upward movement if it breaks above the immediate resistance. However, the overbought RSI and ADX indicators suggest caution, as the stock may be due for a short-term correction.
HINDUSTAN ZINC LTDAs of June 4, 2025, Hindustan Zinc Ltd (NSE: HINDZINC) is trading at ₹468.75, reflecting a 3.44% increase for the day.
📊 Daily Support and Resistance Levels
Based on pivot point analysis:
Central Pivot Point (P): ₹466.93
Support Levels:
S1: ₹459.46
S2: ₹450.18
S3: ₹442.71
Resistance Levels:
R1: ₹476.21
R2: ₹483.68
R3: ₹492.96
These levels are derived from standard pivot point calculations and are commonly used by traders to identify potential support and resistance zones.
📈 Technical Overview
Trend: The stock has demonstrated strong upward momentum, with a 3.44% increase on the day.
Technical Indicators:
RSI (14-day): 62.24, indicating bullish momentum.
MACD: 7.03, suggesting a positive trend.
ADX: 18.90, indicating a developing trend.
Stochastic Oscillator: 78.66, nearing overbought territory.
Supertrend: 426.69, supporting bullish sentiment.
Parabolic SAR (PSAR): 436.97, indicating an upward trend.
Volatility: The stock exhibits moderate volatility, with a beta coefficient of 1.10.
🔍 Additional Insights
Hindustan Zinc Ltd has shown a strong bullish trend in recent sessions. The RSI and MACD indicators suggest continued upward momentum, while the proximity to resistance levels warrants cautious optimism. Traders should monitor these levels closely for potential breakout or reversal signals.
Please note that stock prices are subject to market risks and can change rapidly. It's advisable to consult with a financial advisor before making investment decisions.

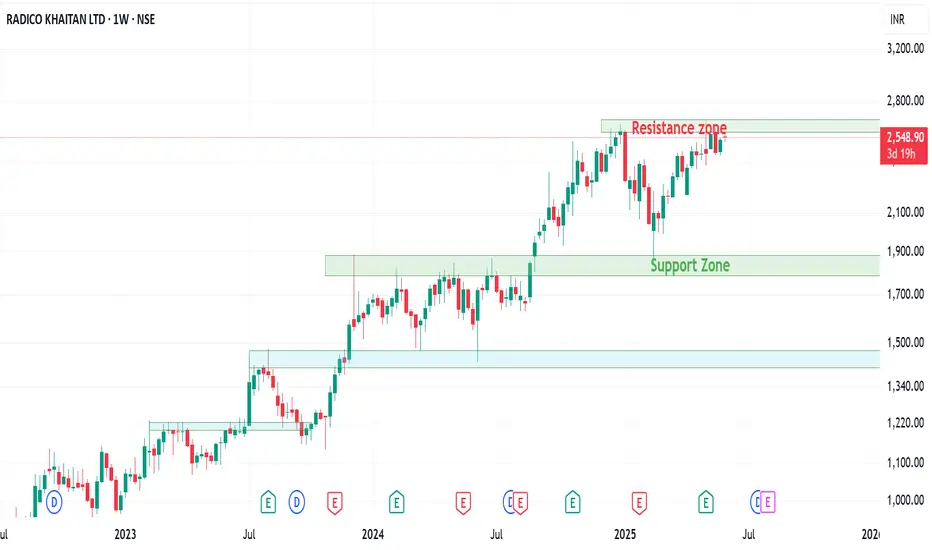
Radico Khaitan at a Crossroads: Support, Resistance & MomentumThe stock is in a bullish trend and is forming a box consolidation and break outs.
On the weekly charts the stock is trading around the resistance zone and there are chance of either breaking out or retesting to the lower levels.
Stock seems strong bullish on the charts but indicators are suggesting a bearish move as the stock is around the resistance zone.
Short sell can be initiated in the stock with a strict SL.
On the bullish side the stock is respecting the monthly 20 EMA and has retested it thrice. Radico if turns bearish can be entered around the moving average as Good R:R in the trade can be seen.
Even on the weekly charts, the stock is trading above the moving averages chance of a retest are there but short sell the stock once the support zone in taken out.
Watch the stock a good ROI can be generated in the stock after the break out the stock will be forming new ATHs.
Wait for a pattern near the resistance either for a bearish or bullish move as it is trading around the crucial recent high levels of 2600-2680.
Stochastic indicator on the Monthly TF is trading in overbought zone while on the weekly TF its showing some bearish divergence. Even the monthly RSI is showing a bearish divergence.
Wait for the price action and trade accordingly.