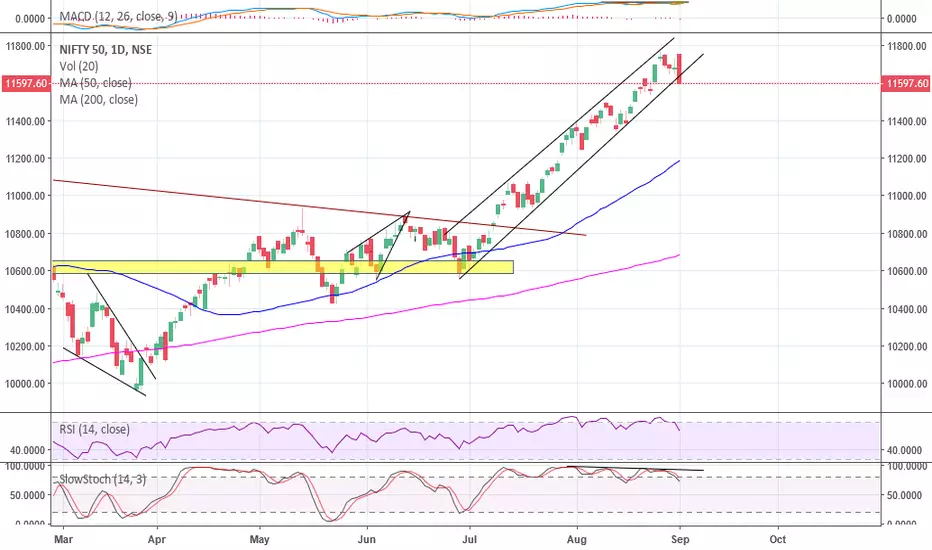
Time for Some Correction in Nifty?-Breaking out of a rising channel on the downside.
-Triple bearish divergence on Stochastic.
-Bearish divergence on MACD.
-Bearish cross on MACD.
-Bearish engulfing candlestick.
Not an investment advice. Do your own due diligence.
Search in ideas for "stochastic"
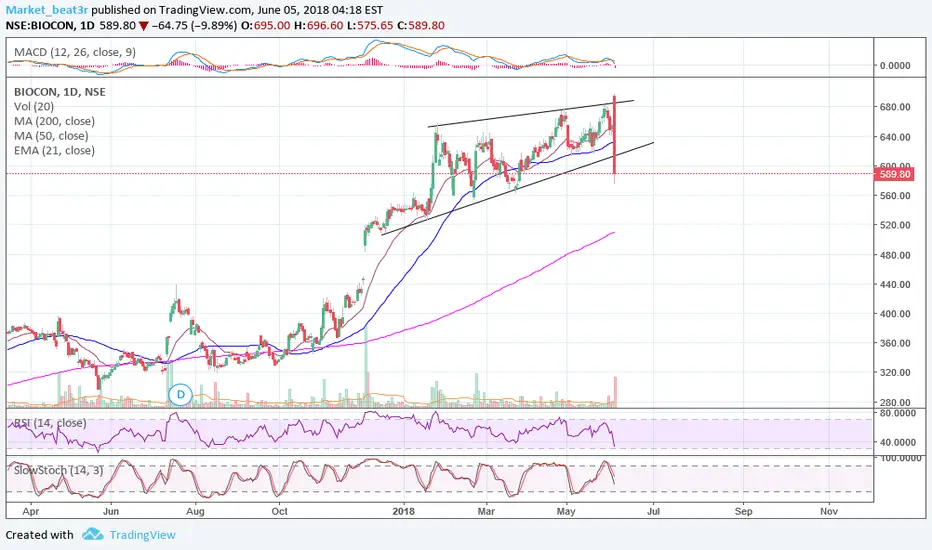
Biocon: Ouch. More Downside Can't be Ruled Out-Stock gapped up today but sellers took control instantly.
-Stock broke down from a rising wedge pattern.
-Bearish MACD.
-Bearish volume.
-Bearish Stochastic.
Not an investment advice. Do your own due diligence.
ITC Loves Falling Wedges-ITC forming a falling wedge.
-Stock has broken out of falling wedges nicely in the past.
-Stock showed great relative strength yesterday despite the market being down close to 1%.
-Bullish divergence on Stochastic.
Not an investment advice. Do your own due diligence.

PVR Bullish Wedge Breakout-PVR broke out of a bullish wedge.
-Breakout on high volume.
-Bullish cross in Stochastic.
Not an investment advice. Do your own due diligence.

Twitter Looking Good Here. $TWTR- Stock bouncing off nicely off of the ascending trend line.
-Approaching key resistance.
-Bullish MACD, RSI, and Stochastic.
-Volume drying up during the recent consolidation.
Not an investment advice. Do your own due diligence.

Has Balaranpur Chini Mills Bottomed? -Stock trying to break out of a bearish channel.
-Multiple bullish divergence on RSI.
-Multiple bullish divergence on Stochastic.
-Bullish divergence on MACD.
-Stock crossed, tested, and held 50 DMA.
-Volume suggests buyers are coming in and selling pressure is cooling off.
Not an investment advice. Do your own due diligence.

Bharat Financial Looks Like A Short-Bearish Rising Wedge Pattern.
-Quadruple bearish divergence on RSI.
-Bearish divergence on Stochastic.
-Bearish MACD.
Not an investment advice. Do your own due diligence.

Radico Khaitan: Running Out of Steam?-Bearish rising Wedge Pattern.
-Triple divergence on RSI.
-Divergence on Stochastic.
-Divergence on MACD.
-Potential double-top formation.
Not an investment advice. Do your own due diligence.

Bull Flag Breakout in Dewan Housing Fin-Stock moved up considerably with huge volumes.
-Consolidated in a bull flag pattern with light volume on red days.
-Broke out of bull flag pattern with a bullish divergence on Stochastic.
-Stock in a strong uptrend and should move higher after the recent breather.
-A potential cup & handle formation may also be on the cards here.
Not an investment advice. Do your own due diligence.

Keeping an Eye Here on Heritage Foods-Coiling up nicely in this pattern.
-High accumulation volume days.
-Double bullish divergence on Stochastic.
-Bullish engulfing candle.
-MACD close to a bullish cross.
-Bullish pennant on the monthly chart.
-Bullish pin bar on the weekly chart.
Will go long if it breaks on the upside.
Not an investment advice. Do your own due diligence.

Bank Of Baroda: Keeping A Close Eye-Bullish falling Wedge Pattern.
-Reversal from key resistance.
-Bullish divergence on RSI.
-Bullish divergence Stochastic.
-Bullish divergence on MACD along with a bullish cross.
-Three White soldiers candlestick.
-Decent uptick in weekly volume.
Not an investment advice. Do your own due diligence.
Will go long once it breaks out on the upside.

Has Intel Topped Out?-Big Rising wedge.
-5 point bearish divergence on RSI.
-4 point bearish divergence on Stochastic.
-Stock at key resistance.
Not an investment advice. Do your own due diligence.

Britannia About To Reverse?- Bearish Rising wedge pattern.
-Stock struggling to break out of the wedge.
-5 point divergence on RSI.
-3 point divergence on Stochastic.
-MACD sloping downwards indicating buying momentum maybe coming to an end.
Not an investment advice. Do your own due diligence. Not invested.

Avanti Feeds Breaking Out Of A Long-Term Falling Wedge-Stock breaking out of a long-term falling wedge.
-High volume on breakout along with high volume accumulation days within the pattern.
-Triple point divergence on the RSI.
-Triple point divergence on Stochastic.
-Triple point divergence on MACD.
-Stock respected a key resistance and formed a huge bullish pin bar just a few days ago. Maybe a shakeout.
-If Avanti sustains above the trend line, it can see 2700-2900 levels in a few weeks IMO.
Not an investment advice. Do your own due diligence.
Disclosure: Not invested, but will probably invest when the market opens.

Trouble ahead for Nifty?-Nifty has been in overdrive mode and has risen over 6% in little over two weeks. A swing low is overdue.
-Steep rising wedge pattern on Nifty's 75 min chart.
-Index has failed to cross the resistance zone and has formed a double top pattern.
-5 point bearish divergence on RSI.
-6 point bearish divergence on Stochastic.
-5 point bearish divergence on MACD.
-Nifty could take a breather soon and fall to 10450-480 levels.
This is not a trading advice. Do your own due diligence.

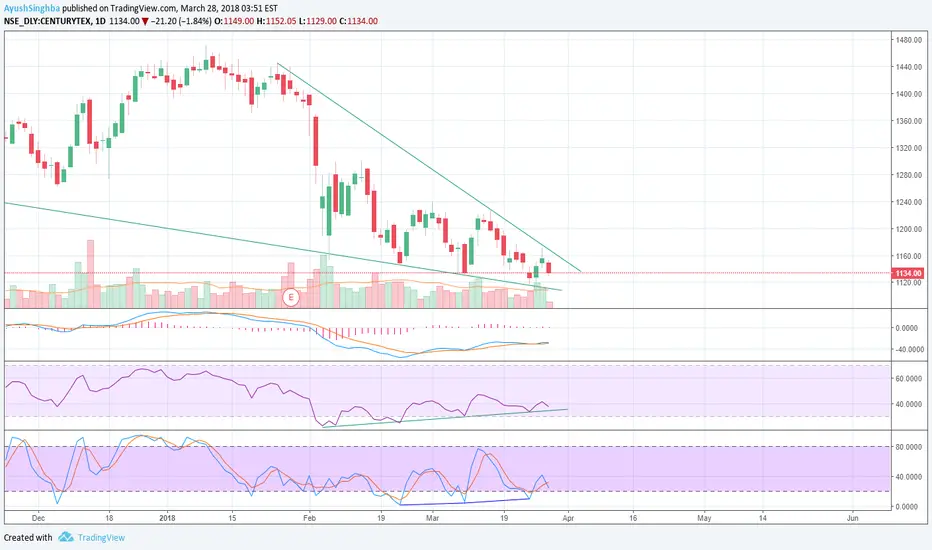
Bullish wedge on Century Textiles/ -Bullish wedge.
-Multiple divergence on RSI.
-Multiple divergence on Stochastic.
-Bullish MACD.
-Low volume on down days.
Hindalco: Play For BounceAlthough I presented the trade on weekly chart yet it would be small swing trade which may take just few days to either hit the targets or stop loss. Partial or full profit booking at first target could be done as overhead supply may hurt the upmove. Some might disagree with my Cypher pattern so I urge them in advance to take it easy :)
All nitty gritty details are mentioned on the chart itself.
The stock is highly volatile so risk averse traders may opt to stay out of this trade.
As per my setup Risk to Reward is not exactly 1:1.
So those who want exactly 1:1 may wait for pullback to 215.50 but only after hitting the 217 entry .
All the best for the week ahead.
Regards

Daawat/LT Foods: The Calm Before the Storm?-Long term uptrend acting as a strong support.
-Holding nicely near key support.
-Bullish candle.
-Divergence on RSI.
-Divergence on Stochastic.
-Volume drying up as the stock has moved lower in the recent past.
-Potential triple-bottom formation.

Welspuns Enterprise: Tailwinds galore. -Breaking out of a channel.
-Bullish divergence on RSI.
-Bullish divergence on MFI.
-Bullish divergence on Stochastic.
-Bullish crossover on MACD.
-Fundamentally strong company. Road construction industry booming under the current.
Not an investment advice. Do your own due diligence.
Disclosure: Invested.

Sun Pharma looks good in the short term.-Price holding nicely near key long-term support.
-Bullish falling wedge pattern.
-Multiple divergence on RSI.
-Divergence on Stochastic.
-Bullish crossover on MACD.

Oriental Carbon & Chemicals: Show me the money.-Small bullish wedge formation.
-Stock price near key support.
-Rs.1000 mark is also a key psychological support that is holding up well.
-Slight divergence on RSI.
-Divergence on Stochastic.
-MACD at historic oversold levels suggests that the stock might be oversold.
-Divergence on MFI from oversold territory.
-Stock has a good history of bouncing whenever MFI was indicating oversold along with divergence.

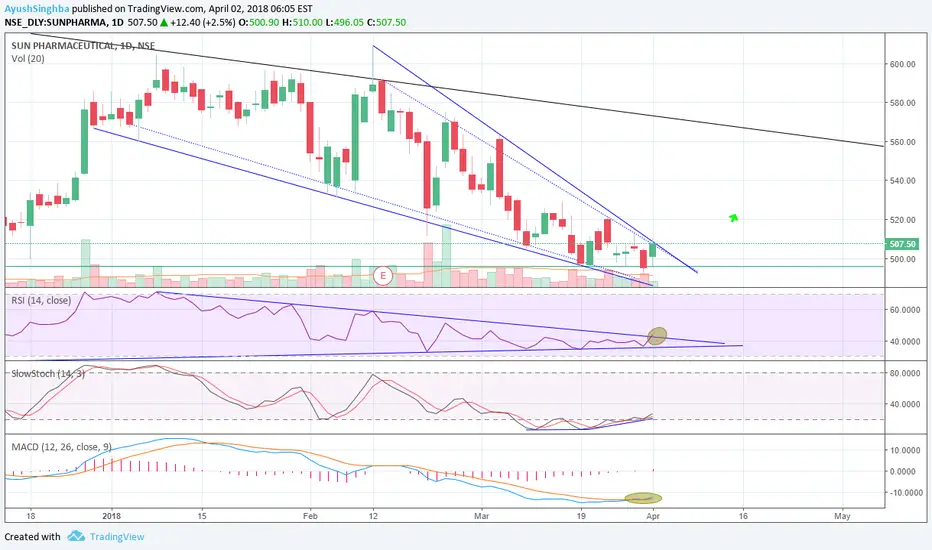
Sun Pharma: Ready to Explode? -Bullish Divergence on RSI.
-RSI breaking the bearish trend line after today's strong move.
-Divergence on MFI.
-Divergence on Stochastic.
-Falling wedge pattern still intact.
-495 area still acting as a strong support.
-Bullish crossover on MACD.
-Look for a break of the wedge with high volume.