Granules-ABCD completion1. Abcd completion and finding support with a pinbar also a bullish turn in stochastic.
Tgt - 145
Sl - 131
Search in ideas for "stochastic"


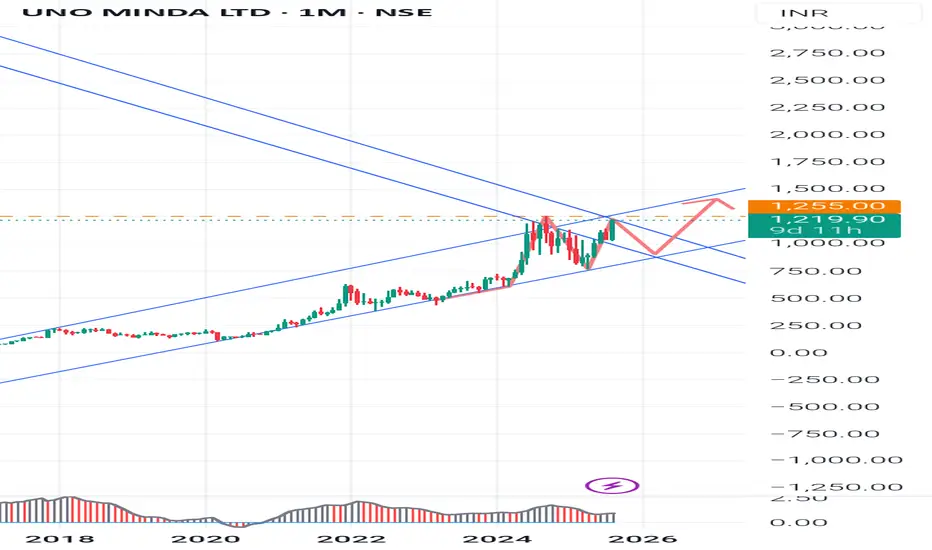
UNO Minda Ltd Stock - Chart Analysis (August 2025)UNO Minda Ltd Stock - Chart Analysis (August 2025)
1. Chart Pattern Insights
Trend: The long-term chart shows a consistent uptrend since 2017, with price largely respecting an upward-sloping channel. Recent price movement is testing the upper boundary.
Pattern: The marked wedge/triangle pattern indicates possible volatility and upcoming breakout.
If price sustains above 1,255, the next bullish target is around 1,400.
Support-:
A breakdown below the lower wedge/channel suggests a test of 1,000 support.
Support Levels: 1,000–1,020 ; next strong support at 768 (previous major low).
Resistance Levels: 1,255 (recent high and pivot); 1,400 (target in bullish scenario), then 1,600 (next significant resistance).
Pivot Points: Weekly pivots confirm 1,255 as a resistance and 1,085-1,140 zone as a key support area.
Volume: Increasing volume on upmoves supports bullish momentum.
2. Stochastic RSI (8, 13, 21) Insights
Strength: Use these settings to assess overbought/oversold zones. A reading above 80 suggests overbought (possible reversal or consolidation), below 20 is oversold (potential buying opportunity).
Momentum: If Stochastic RSI crosses above 50 and price breaks recent resistance, it confirms bullish momentum. Divergence between price and Stochastic RSI often precedes reversals.
3. Fundamental Ratios (2025)
Metric
UNO Minda
Motherson Sumi
Suprajit Engg.
Industry Avg.
P/E (TTM)
75.75
50
40
35
P/B
12.37
8
6
5
ROE
17.5%
12%
11%
13%
ROCE
18.8%
14%
13%
14%
Dividend Yield
0.18%
>0.30%
0.40%
0.35%
OPM
12%
10%
13%
11%
Debt/Equity
0.5
0.7
0.3
0.6
UNO Minda boasts higher profitability (ROCE, ROE, OPM) but is more expensive (higher P/E/PB), reflecting market optimism for its growth.
4. Key Learnings for Students
Charts Teach Structure: Price channels, wedges, and pivot points help spot trend directions. Always align investment with trend- buy in uptrend, sell or avoid in downtrend.
Support & Resistance are Crucial: Identify historical price levels where stock reversed before. These are good zones for setting stop-loss or target levels.
Momentum Matters: Use Stochastic RSI and volume to confirm price movement strength. Entries on strong momentum and exits on exhaustion zones (overbought/oversold).
Valuation Matters: High P/E/PB signals high growth expectation but potentially overpriced risk.
Profitability Ratios (ROE, ROCE): Go for companies with sustained high profitability and reasonable leverage (Debt/Equity).
Diversification: Compare companies within an industry- never invest based solely on price chart, always check business health and fundamentals.
5. Disclaimer
Stock market investing involves risk. The above analysis is for educational purposes only. Past performance does not guarantee future returns. Always do your own research and consult a financial advisor before making investment decisions.
#StockAnalysis #Fundamentals #TechnicalAnalysis #UNO #AutomobileStocks #StudentInvesting
USDINRCertainly! Here's a detailed analysis of the chart:
The chart analyses the USD/INR currency pair on a daily timeframe, displaying price movements across several months.
**Current Data:**
- **Price**: 86.3670 INR per USD.
- **Daily High**: 86.5950
- **Daily Low**: 86.3040
- **Open Price**: 86.4320
- **Buy Price**: 86.4170
**Trend Analysis:**
The chart includes multiple trend lines that highlight support and resistance levels. These are crucial for identifying potential reversal points:
- **Support Levels**: 85.2961 and 85.2603
- **Resistance Levels**: 83.9388 and 83.4425
**Technical Indicators:**
- **Stochastic Oscillator**: Shows values of 71.68 (orange line) and 66.27 (blue line), indicating possible overbought or oversold conditions which can signal upcoming market trends.
**Timeframe Covered:**
The data spans from September to February, and the analysis was recorded at 12:44:59 (UTC).
This chart is beneficial for making informed trading decisions by analyzing trend patterns, key support/resistance levels, and market indicators.
Great! Let's dive deeper into the analysis.
### Trend Analysis:
The **support levels** and **resistance levels** provide an understanding of where the price might find difficulty moving further or where it might bounce back from:
- **Support Levels**:
- **85.2961 INR**: A point where there has been significant buying interest before.
- **85.2603 INR**: Another strong support level indicating a price floor.
- **Resistance Levels**:
- **83.9388 INR**: A point where selling pressure has previously been strong.
- **83.4425 INR**: Another price point marking significant resistance in the market.
### Technical Indicators:
- **Stochastic Oscillator**:
- Both orange and blue lines are hovering near overbought territory. This usually suggests that the current upward price trend may be weakening, and the currency pair might be due for a correction.
### Market Insights:
Looking at the data, one can infer that the market has been quite volatile. The recent high values in the Stochastic Oscillator imply that buyers might be losing steam, indicating a possible trend reversal. Observing the support and resistance levels alongside the stochastic values can help predict future price movements and advise on trading actions.
Feel free to ask if there's anything more specific you'd like to uncover in this chart analysis. I'm here to assist you!

silver Divergence TradingTrend lines are among the most accurate buy and sell indicators, along with simple moving average, stochastic, moving average convergence divergence, and relative strength index being the top trading indicators that help traders analyze the market signals effectively.
The best divergence indicators mt4 are MACD, RSI, stochastic, OA. They are user-friendly and simple but provide quite accurate trading signals. You can learn more about stochastic oscillator trading forex in the article Stochastic Oscillator: guide for using indicator in Forex trading.

Indicators for ScalpingIndicators for Scalping
There are various methods used for making a profit in intraday trading. One such method, often known only to experienced traders, is scalping.
This involves making numerous trades throughout the day to capture small price movements. Scalping requires precision and quick decision-making, distinguishing it from other trading approaches.
This article explores the essential indicators that can assist scalpers in maximizing their results while using this fast-paced style of trading.
What is Scalping?
Scalping can be defined as a trading method in which traders try to capitalize on small price changes normally after executing a trade and becoming profitable.
For instance, multiple traders within a 5-minute or 10-minute timeframe.
Most of these traders have a well-defined exit strategy regarding their trades because they know that a loss could easily wipe out all those smaller gains obtained through hard work.
To be able to successfully do scalping, many traders use scalping indicators, which we will cover next.
Top Scalping Indicators
Traders aiming to excel in scalping should familiarize themselves with the top five scalping strategy indicators. These are:
1. The SMA Indicator
A Simple Moving Average (SMA) Indicator is one of the key tools commonly used by traders to build their trading strategies.
It calculates the average price of an asset over a set period, assisting traders in determining if the prices of their securities, commodities, or currencies are going up or down.
Essentially, SMA assists in identifying price trends by finding a mean of past closing prices and dividing this summation by the number of periods.
SMA is also known as the arithmetic moving average. It provides a clear view of the asset's price direction, making it a key indicator for trend analysis.
2. The EMA Indicator
The Exponential Moving Average (EMA) is another valuable tool for traders, offering a way to prioritize recent prices more heavily compared to the Simple Moving Average (SMA), which treats all prices equally.
The EMA is particularly favored in scalping strategies because it reacts more swiftly to recent price movements.
Traders commonly use the EMA to generate buy and sell signals based on crossovers and divergences between historical averages.
3. The MACD Indicator
Another widely used scalping indicator among traders is the Moving Average Convergence Divergence (MACD) indicator. It's versatile and suitable for various trading styles.
The MACD helps traders gauge momentum and track trends effectively. It illustrates the relationship between two moving averages of a security’s price.
To calculate the MACD, traders subtract the 26-day Exponential Moving Average (EMA) from the 12-day EMA. The 9-day EMA, known as the signal line, is used as the default setting to identify buying and selling signals.
4. The Parabolic SAR indicator
The Parabolic Stop and Reverse (SAR) indicator is another valuable tool for traders, providing insights into price action trends.
During an uptrend, the SAR indicator plots points below the price, while in a downtrend, it places points above the price. This helps traders identify potential price reversals.
The SAR indicator aids in assessing short-term momentum and deciding on stop-loss placements. It is most effective when markets exhibit consistent trends.
5. The Stochastic Oscillator indicator
The Stochastic Oscillator is popular among traders. It operates on the principle that momentum leads to price changes.
Traders rely on this scalping indicator to get early signals of price movements before they happen. The Stochastic Oscillator is based on the idea that an asset's closing price tends to be near the higher end of its price range for the day.
Despite its complexity, many traders find the Stochastic Oscillator to be a dependable tool for making buy and sell decisions.
6. Volume Weighted Average Price (VWAP)
The Volume Weighted Average Price (VWAP) calculates the average price at which a security has traded throughout the day, taking into account both its trading volume and price. It is calculated by taking the total dollar amount traded for the security and dividing it by the total volume traded.
VWAP is particularly useful for scalpers as it helps them understand the true average price of a security, allowing them to make more informed trading decisions. By comparing the current price to the VWAP, traders can determine if the price is above or below the average, indicating potential buying or selling opportunities.
This indicator is often used in conjunction with other technical analysis tools to enhance trading strategies.
7. Relative Strength Index (RSI)
The Relative Strength Index (RSI) is a momentum oscillator that measures the speed and change of price movements to identify overbought or oversold conditions in a market. It ranges from 0 to 100 and is typically used to determine if a security is being overbought (above 70) or oversold (below 30).
When the RSI crosses these thresholds, it can signal potential reversal points, helping traders make informed decisions about entering or exiting trades.
Analyzing the RSI helps scalpers gauge the strength of a trend and anticipate possible price corrections, enhancing their ability to capitalize on short-term price movements.
Conclusion
Scalping is a useful but demanding trading method that involves making quick decisions to profit from small price changes. Using the right tools can help traders find the best times to buy and sell.
Although it takes practice and a good understanding of market trends, learning about scalping indicators can help traders earn a profit.

TORNTPHARMIchimoku Conversion Line(3,7,14) >= Ichimoku Base Line(3,7,14)
Ichimoku Span A(3,7,14) >= Ichimoku Span B(3,7,14)
Close >= Ichimoku Cloud Bottom(3,7,14)
Close >= Parabolic Sar(0.02,0.02,0.2)
Rsi(10) >= 20
StochRsi(10) >= 20
Cci(10) >= 0
Mfi(10) >= 20
Williams %R(10) >= 80
Close >= Ema(close,14)
ADX DI Positive(10) >= ADX DI Negative(10)
Aroon Up(10) >= Aroon Down(10)
Slow Stochastic %K(5,3) >= Slow Stochastic %D(5,3)
Fast Stochastic %K(5,3) >= Fast Stochastic %D(5,3)
Close >= Sma(close,10)
Macd Line(14,5,3) >= Macd Signal(14,5,3)
Rsi(14) > 50
StochRsi(14) > 50
Rsi(10) < 80
Close >= Upper Bollinger band(20,2)
Close >= Ichimoku Cloud Bottom(9,26,52)
Close >= Open
Ema(close,5) >= Ema(close,20)
Ema(close,20) >= Ema(close,50)
Close >= Ema(close,50)

NIFTY 5th Wave Started? Contd....4Nifty moving like a ping pong ball up and down for the last 3 weeks within the range of 10700-950. Why ?
In Weekly chart the MACD signals released from the histograms below 0, so the fall is restricted. As both histogram
and signals were below 0 the uptrend is restricted. Now with 18 Jan. weekly close the following are visible in chart.
MAs - Price able to close above Middle Bollinger Band which is 20 MA. It took nearly 15 weeks to achieve this from the week it fell
below MBB.
MACD - Now the histogram opened above 0 and the signal is getting ready to enter inside it. Until then the price can try and
touch the Upper Bollinger Band which is at 11470 +/- as of now. Once the signal goes above 0 and enters inside
the histogram, the BBs will open up by the time the price reaches near UBB and can pull the price candles upward.
STOCHASTIC - Near 80 and once the MACD signal goes above 0, stochastic can move above 80 which is considered as highly
bullish. The only delay expected is, IF the stochastic turn down from 80 and wait for the MACD signals to
go above 0. In such an instance the price can come down one or two more times near 10880-837 levels before
the stochastic turn again and start moving upward.
Market is bullish and due to above reasons the upward move getting delayed and now it should start soon. The targets
mentioned in the last post are in tact and can be achieved.
This view is purely for educational purpose and may or may not be good for trading. Anyone wishes to trade should consult with his Financial Advisor before doing so, as the writer or this website will not be responsible for any such actions whatsoever.

Should i sell ,Should i buy ? BTC Analysis ! ! !ok for those who follow me and my swing trading method i wnat to share you my 4h chart:
2018/05/05 : MACD et stochastic rsi sell signal ( 9800/9900)
2018/05/06 : first MA break, sell confirmation,if you miss the first signal (9600)
2018/05/09 ; MACD and Stochastic buy signal (9000/9100)
2018/05/10 : MACD and stochastic sell signal (9300/9400)
2018/05/11 : No buy signal yet so just WAIT !!!
ok so you tell me i have to wait to buy but , i have some bitcoin and altcoin should i sell ? i think is to late for sell but is just my point of view , beacause fibo 0.5 at 8400 and stochastic RSI at his bottom.. But it's difficlul to predict the bottom maybe we could go lower than 8400 so be careful and good luck :)
Next time just follow my method if you don't want to lose money :)
like if you aprecciate ,thanks :)=

UNIPARTS LONGI have noticed a significant trendline breakout in the market recently. This breakout occurs when the price of a security breaks through a trendline.
The Moving Average Convergence Divergence (MACD) indicator is currently showing a bullish signal. It appears that market sentiment is currently trending.
The Relative Strength Index (RSI) is currently indicating a bullish trend as it is greater than 50. This suggests that the buying pressure in the market is stronger than the selling pressure, potentially leading to further upward movement in the price.
The stochastic bullish crossover is a technical analysis pattern that occurs when the stochastic oscillator generates a buy signal. This technical analysis pattern occurs when the stochastic oscillator's %K line crosses above its %D line.
I am not a registered Sebi analyst. My studies are purely for educational purposes.
Before trading or investing, please consult with your financial advisor. I am not accountable for your profits or losses in any way.
Thanks
VJ

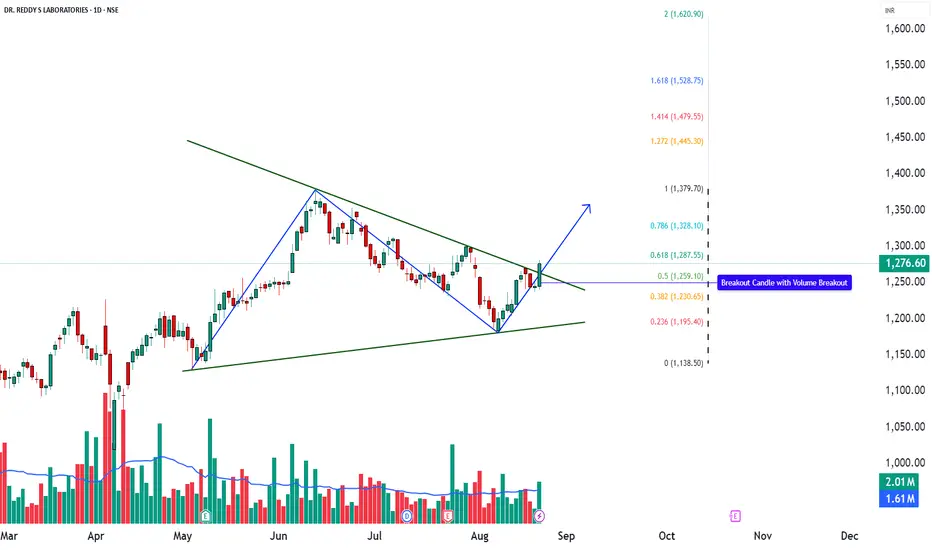
DRREDDY – Triangle Breakout in Play📊 DRREDDY – Technical & Educational Snapshot
Ticker: NSE: DRREDDY | Sector: 💊 Pharma
CMP: ₹1,276.60 ▲ (+2.51% | 22 Aug 2025)
Rating (for learning purpose): ⭐⭐⭐⭐ (Moderately Bullish)
Pattern Observed: 📈 Triangle Breakout with Volume Confirmation
📰 Sentiment Analysis
👉 Overall Sentiment: Positive ✅
• Bullish Drivers: Breakout from triangle formation, Morning Star on daily, bullish PinBar on monthly, strong Q1 results with revenue & profit growth, and renewed interest in pharma sector due to healthcare demand.
• Risks (Bearish Case): Any failure to sustain above ₹1,250 or renewed pressure from regulatory issues/patent challenges could trigger pullbacks.
• Short-term Outlook: Strong breakout with momentum, but some cooling-off likely due to Stochastic overbought levels.
• Long-term Outlook: Positive — consistent financial performance, strong pharma pipeline, and robust technical structure suggest higher upside potential.
📊 Technical Snapshot
DRREDDY has broken out from a triangle formation, supported by a Morning Star candlestick on the daily timeframe and a Bullish PinBar on the monthly chart — both strong reversal cues. A bullish Supertrend, RSI breakout, and Bollinger Band expansion signal renewed buying interest. Volume above the 20-SMA average further validates the breakout, suggesting institutional participation. While momentum is strong, Stochastic is near overbought, which means short-term pullbacks cannot be ruled out. However, as long as price sustains above key support zones, the broader trend bias remains upward.
📊 Volume Check
🔹 Current Volume: 2.01M
🔹 20 SMA Volume: 1.61M ✅
💥 Above-average participation → confirms breakout reliability with demand expansion.
💡 Interpretation: Higher-than-average volumes in breakout zones indicate broader market participation and improve the chances of trend continuation.
💡 Learnings
Breakouts from consolidation patterns like triangles tend to extend into trending moves when supported by momentum indicators (RSI + MACD). Elevated CCI levels indicate consistent buying pressure, but traders should remain alert to possible short pullbacks, especially when Stochastic enters the overbought zone. Defining a stop-loss and invalidation level is key for disciplined trade management.
📌 Key Levels
Resistance: 1292 | 1308 | 1334
Support: 1251 | 1225 | 1209
Fibonacci Levels: 1138.50 | 1195.40 | 1230.65 | 1259.10 | 1287.55 | 1328.10 | 1379.70
🎯 STWP Learning Reference
• Observed breakout zone: ~1281.8
• Key support level: ~1236
• Upside reference zones (if momentum continues): 1327 | 1372
• Pullback watch zone: 1224–1230 (where demand has earlier emerged)
• Invalidation reference: Below 1195 (trend may weaken)
⚠️ Disclaimer – Please Read Carefully
The information shared here is meant purely for learning and awareness. It is not a buy or sell recommendation and should not be taken as investment advice. I am not a SEBI-registered investment advisor, and all views expressed are based on personal study, chart patterns, and publicly available market data.
Trading — whether in stocks or options — carries risk. Markets can move unexpectedly, and losses can sometimes exceed the money you have invested. Past performance or past setups do not guarantee future results.
If you are a beginner, treat this as a guide to understand how the market works — practice on paper trades before risking real money. If you are experienced, always assess your own risk, position sizing, and strategy suitability before entering trades.
Consult a SEBI-registered financial advisor before making any real trading decision. By engaging with this content, you acknowledge full responsibility for your trades and investments.
💬 Found this useful?
🔼 Give this post a Boost to help more traders discover clean, structured learning.
✍️ Drop your thoughts, questions, or setups in the comments — let’s grow together!
🔁 Share with fellow traders and beginners to spread awareness.
✅ Follow simpletradewithpatience for beginner-friendly setups, price action insights & disciplined trading content.
🚀 Stay Calm. Stay Clean. Trade With Patience.
Trade Smart | Learn Zones | Be Self-Reliant 📊
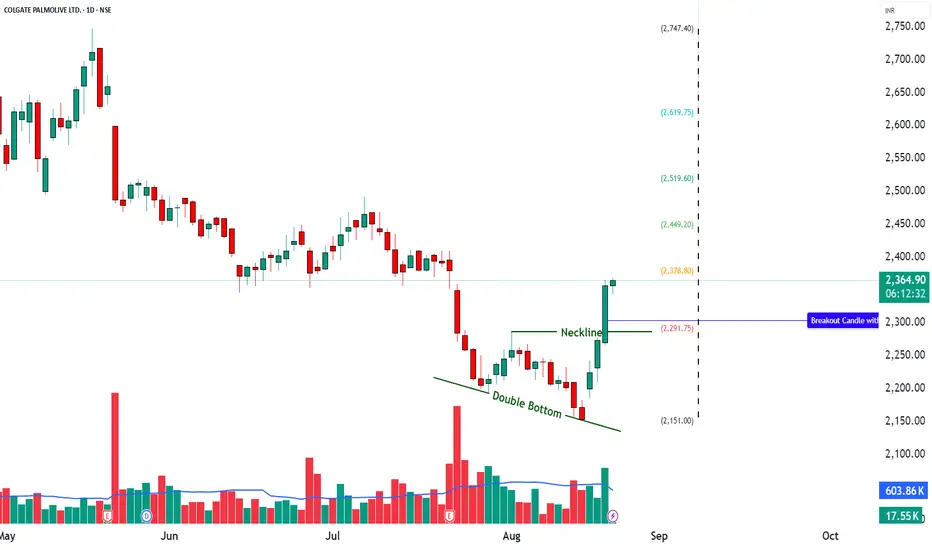
COLPAL - RSI Breakout + Bollinger Band Breakout📊 COLPAL – Technical & Educational Snapshot
Ticker: NSE: COLPAL | Sector: 🪥 FMCG
CMP: ₹ ▲ (as of 20 Aug 2025)
Rating (for learning purpose): ⭐⭐⭐⭐
Pattern Observed: 📈 RSI Breakout + Bollinger Band Breakout
COLPAL is showing strong bullish momentum supported by multiple technical indicators. The presence of a strong bullish candle, along with an RSI breakout at 61, highlights healthy buying pressure. A Bollinger Band breakout and BB Squeeze-Off indicate rising volatility and the possibility of a continuation move. The Bullish SuperTrend adds further confirmation, while momentum indicators (MACD bullish, CCI at 223, Stochastic at 96) signal strong near-term strength.
📊 Momentum Snapshot: Momentum indicators are aligned on the bullish side. While Stochastic shows overbought conditions, strong volume-backed momentum often sustains until key resistance levels are tested.
📊 Volume Check:
🔹 Current Volume: 1.01M
🔹 20SMA Volume: 710.56k ✅
💥 Significantly above average – confirms strong institutional / broad-based buying interest!
💡 Interpretation:
When volume is well above the 20-period average, it strengthens the reliability of a breakout.
It shows that the move is not just retail-driven but likely supported by larger participants.
Breakouts with high volume tend to sustain better compared to low-volume moves.
💡 Learnings:
Breakouts with Bollinger Band expansion often lead to strong follow-through moves.
RSI + MACD confirmation together strengthen trend reliability.
High CCI & Stochastic values show strong momentum but also highlight the importance of monitoring for pullbacks.
Defining pullback and invalidation levels helps in disciplined trade management.
Key Levels:
Resistance: 2393 | 2429 | 2492
Support: 2293 | 2229 | 2193
Pullback Area: 2294
Invalidation Level: Close below 2193
STWP Trade Setup:
Entry (Long): Above 2365
Stop Loss: 2262 or below
Reference Levels: 2467 | 2569
⚠️ Disclaimer – Please Read Carefully
The information shared here is meant purely for learning and awareness. It is not a buy or sell recommendation and should not be taken as investment advice. I am not a SEBI-registered investment advisor, and all views expressed are based on personal study, chart patterns, and publicly available market data.
Trading — whether in stocks or options — carries risk. Markets can move unexpectedly, and losses can sometimes be larger than the money you have invested. Past performance or past setups do not guarantee future results.
If you are a beginner, treat this as a guide to understand how the market works — practice on paper trades before risking real money. If you are an experienced trader, remember to assess your own risk, position sizing, and strategy suitability before entering any trade.
Consult a SEBI-registered financial advisor before making any real trading decision.
By reading, watching, or engaging with this content, you acknowledge that you take full responsibility for your own trades and investments.
💬 Found this useful?
🔼 Give this post a Boost to help more traders discover clean, structured learning.
✍️ Drop your thoughts, questions, or setups in the comments — let’s grow together!
🔁 Share with fellow traders and beginners to spread awareness.
✅ Follow simpletradewithpatience for beginner-friendly setups, price action insights & disciplined trading content.
🚀 Stay Calm. Stay Clean. Trade With Patience.
Trade Smart | Learn Zones | Be Self-Reliant 📊
METROPOLIS – Big Volume Breakout + Price Action + Momentum___________________________________________________________________________
📈 METROPOLIS – Big Volume Breakout | Strong Momentum Building |
Price Action | Volume Structure
🕒 Chart Type: Daily Chart
📆 Date: July 9, 2025
___________________________________________________________________________
Price Action: METROPOLIS HEALTHCARE LTD has delivered a strong breakout on the daily chart, moving out of a multi-week consolidation zone between 1880–1910 with a wide-range bullish candle on July 9. This breakout above the key resistance of 2110.9 comes with a clean structure, strong closing, and sharp momentum — now placing the stock near its 52-week high. The accumulation phase is likely over, and this price action suggests the beginning of a new trend. As a key player in the diagnostics sector, METROPOLIS is gaining renewed attention post-COVID, with the healthcare space showing strong tailwinds and fresh investor interest.
___________________________________________________________________________
Chart Pattern: The chart is showing a Flat Base Breakout following a multi-week consolidation, indicating the potential beginning of a new momentum leg within the broader structure. Notably, the base was tight and shallow, which is considered a strong bullish signal as it reflects controlled accumulation and limited profit-booking. This clean breakout hints at renewed strength and the possibility of sustained upside if volume and structure hold.
___________________________________________________________________________
Candlestick Pattern: NA
___________________________________________________________________________
Volume Analysis: The volume analysis strongly supports the breakout, with trading volume on the breakout day soaring to over 5 times the average of the past 20 sessions. This surge was not just in quantity but also in delivery volume, signaling that the move was backed by genuine long-term accumulation rather than intraday speculation. As the classic saying goes, “volume precedes price” — and this sharp spike clearly points to smart money entering the stock, lending credibility to the breakout and hinting at further upside potential.
___________________________________________________________________________
Technical Indicators: The technical indicators paint a strongly bullish picture. The RSI on the daily timeframe is at 84, which, while overbought, reflects strength and momentum rather than exhaustion. The MACD has triggered a bullish crossover, with a steadily rising histogram indicating a healthy momentum buildup. Both CCI and Stochastic oscillators are deep in bullish territory — CCI above 300 and Stochastic over 88 — highlighting the intensity of the current uptrend. Additionally, the price has expanded beyond the upper Bollinger Band, suggesting the start of a volatility expansion phase, which often accompanies strong directional moves.
___________________________________________________________________________
Support & Resistance: The stock has given a decisive breakout above ₹2110.9, which now acts as a strong reference point and the official top of its recent consolidation range. This level was pierced by a bullish candle backed by high volume, confirming strength and conviction in the move. Ahead, the stock faces its first hurdle at ₹2157, a short-term resistance just above the breakout zone where minor profit-booking may emerge. Beyond that, ₹2256.1 marks a key medium-term resistance aligned with a previous swing high — a level to watch closely if the rally continues on solid volume. For positional traders, ₹2401.3 stands as a distant resistance zone that, while weak, could be relevant if momentum accelerates. On the downside, ₹1912.7 offers immediate support, being the level that held firm during base formation. If deeper retracements occur, ₹1767.5 and ₹1668.4 are layered supports where the price previously showed strength. At the very base lies ₹1315, the major long-term demand zone — a structural support that triggered the prior trend and serves as the final defence in case of any broad weakness.
___________________________________________________________________________
What’s Catching Our Eye: The price has decisively broken above a multi-week resistance zone, and what makes this move stand out is the massive volume backing it. This isn't just a random spike — it's a structured breakout with all the internals lining up beautifully. Momentum indicators like RSI, MACD, CCI, and Stochastic are all in bullish alignment, confirming that the strength is real and not a one-off event. This kind of confluence often signals the start of a meaningful trend, not just a short-lived rally.
___________________________________________________________________________
What We’re Watching For: The key question now is whether the price can sustain above ₹2110.9, the breakout level, without slipping back into the previous range — a crucial sign of breakout validation. We're also keeping an eye out for a healthy pullback toward the ₹1880–₹1910 zone, which could offer a far better risk-reward entry if the uptrend remains intact. Most importantly, the bigger picture is in focus: Is this the beginning of a larger trend aiming for ₹2400+, or are we simply witnessing a short-term momentum burst? The next few sessions will be critical in answering that.
___________________________________________________________________________
Best Buy Level for Equity (Low Risk Idea): A low-risk buying opportunity opens above ₹2110.9, but only if the price sustains this breakout for a day or two — confirming strength and avoiding a false breakout scenario. Alternatively, a pullback to the ₹1880–₹1910 zone could offer an excellent risk-reward setup, especially if accompanied by a clear bullish reversal signal (like a strong candle or volume spike). In both cases, keep a strict stop loss at ₹1839 on a closing basis to protect against deeper downside.
___________________________________________________________________________
Sector Tailwinds: The diagnostic sector continues to build long-term strength in the post-COVID landscape, as healthcare awareness and preventive testing become mainstream. Investors are increasingly allocating capital toward healthcare services, recognizing their structural growth potential. Add to that the rising urban demand for quality diagnostics and the company's strong brand trust, and you get a solid layer of fundamental support fueling this rally — making the technical breakout even more meaningful.
___________________________________________________________________________
Risk to Watch: If the price fails to hold above ₹2110 and starts slipping below ₹1910, there’s a real risk of this breakout turning into a false move. While the current momentum is strong, indicators are overheated, which increases the chances of a short-term pullback or shakeout. Most importantly — no confirmation means no trade. Avoid chasing blindly; let the price action validate the move before committing capital.
___________________________________________________________________________
What to Expect Next: The stock may see a sideways move or a minor pullback toward the ₹1910 zone as it digests the breakout. However, if the price holds above the breakout level, we could see a continuation move toward ₹2157–₹2256 in the near term. The key to watch is volume — if the stock holds near highs with rising volume over the next 2–3 sessions, it could trigger a strong trending move, confirming that smart money is firmly in control.
___________________________________________________________________________
How to Trade METROPOLIS (For Educational Use Only):
Here’s a simple Breakout Trade Plan based on current structure and volume confirmation:
🔹 Entry: Above ₹2110.9 — either on a successful retest of the breakout level or a clean follow-through candle with strength
🔹 Stop Loss: ₹1839 (on closing basis) to protect capital in case of breakdown
🔹 Risk-Reward: Aim for 1:1 initially, then trail for 1:2+ if momentum holds
🔹 Position Sizing: Adjust based on your capital, risk appetite, and SL range — avoid going all-in; stay disciplined with allocation
📌 Always follow your trading plan. This setup is for educational and analysis purposes only.
___________________________________________________________________________
⚠️ Disclaimer (Please Read):
• This chart is shared for educational purposes only and is not investment advice.
• I am not a SEBI-registered advisor.
• The information provided here is based on personal market observation.
• No buy/sell recommendations are being made.
• Please do your own research or consult a registered financial advisor before making any trading decisions.
• Trading involves risk. Always use proper risk management.
___________________________________________________________________________
💬 Found this helpful?
What would be your ideal entry in this METROPOLIS setup — breakout follow-through or demand zone pullback?
Drop your thoughts or questions in the comments below ⬇️
🔁 Share this with your trading community
✅ Follow STWP for clean technical setups backed by price action and volume
🚀 Let’s trade with patience, logic, and clarity!
Be Self-Reliant | Trade with Patience | Learn with Logic
___________________________________________________________________________

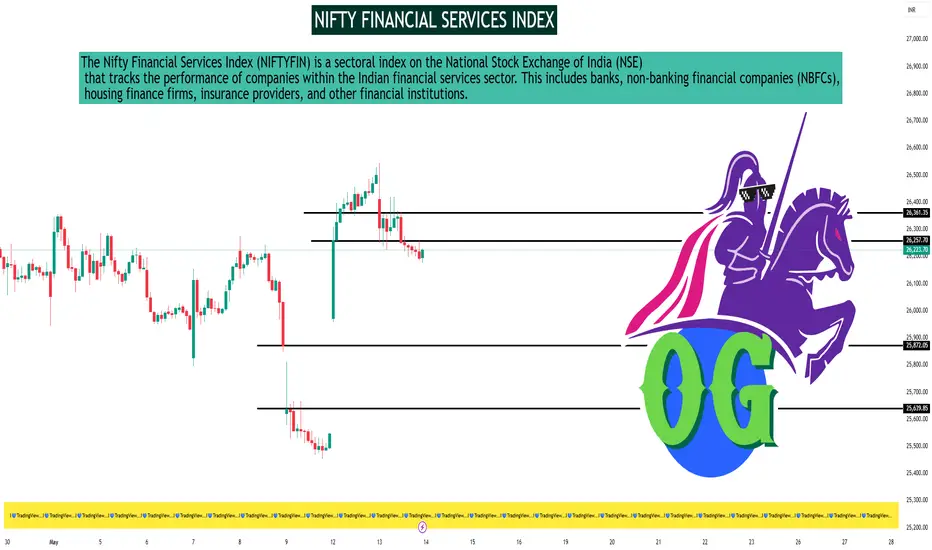
NIFTY FINANCIAL SERVICES INDEXAs of May 13, 2025, the Nifty Financial Services Index (NIFTYFIN) closed at 26,206.00, reflecting a decline of 1.10% for the day.
📊 30-Minute Timeframe Technical Overview
Key Support and Resistance Levels:
Support: Approximately 25,245.07
Resistance: Approximately 26,562.40
These levels are derived from recent price actions and are crucial for traders monitoring short-term movements.
Technical Indicators Summary:
Relative Strength Index (RSI 14): 52.33 – Neutral
Stochastic Oscillator (9,6): 98.35 – Overbought
Stochastic RSI (14): 2.60 – Oversold
MACD (12,26): 54.67 – Buy
Average Directional Index (ADX 14): 15.72 – Neutral
Williams %R: -1.94 – Overbought
Commodity Channel Index (CCI 14): -48.30 – Neutral
Average True Range (ATR 14): 166.29 – Indicates lower volatility
Rate of Change (ROC): 2.80 – Buy
Bull/Bear Power (13): -19.22 – Sell
Interpretation:
The technical indicators present a mixed outlook. While the MACD and ROC suggest bullish momentum, the overbought readings from the Stochastic Oscillator and Williams %R indicate potential for a short-term pullback. The neutral RSI and ADX values suggest a lack of strong directional momentum.
📈 Accessing 30-Minute Charts
For real-time 30-minute interval charts and advanced technical analysis tools, consider the following platforms:
TradingView – Nifty Financial Services Index
Investing.com – Nifty Financial Services Chart
Groww Terminal – Nifty Financial Services
These platforms offer customizable charts with various indicators to assist in your analysis.
XTIUSD / USOIL / CRUDEOILUS WTI Crude (Spot) (XTIUSD) on a daily timeframe from the FXOPEN platform. Here are some key points to consider for a potential buying opportunity:
1. **Price Levels**:
- **High**: 82.50 USD
- **Low**: 64.74 USD
- **Current Price**: 71.98 USD
- **Bid**: 71.97 USD
- **Ask**: 72.01 USD
2. **Technical Indicators**:
- **Stochastic Oscillator**: The current values are approximately 63.79 (blue) and 54.08 (orange), indicating that the market is not in the overbought zone, which suggests there may be room for upward movement.
- **Trend Lines**: Two purple dashed trend lines form a rising wedge pattern, indicating potential future price movements.
3. **Price Action**:
- The chart shows a general upward trend with some volatility, as indicated by the candlestick patterns.
- The price is currently near the lower boundary of the rising wedge pattern, suggesting a potential buying opportunity if the price bounces off this support level.
4. **Volume**:
- The volume bars at the bottom of the chart show the trading volume for each day, with varying heights indicating different levels of trading activity.
In summary, the current price is near a support level within a rising wedge pattern, and the stochastic oscillator is not in the overbought zone, suggesting that there may be room for upward movement. Traders might consider buying if the price shows signs of bouncing off the support level and if the stochastic oscillator confirms a bullish signal.

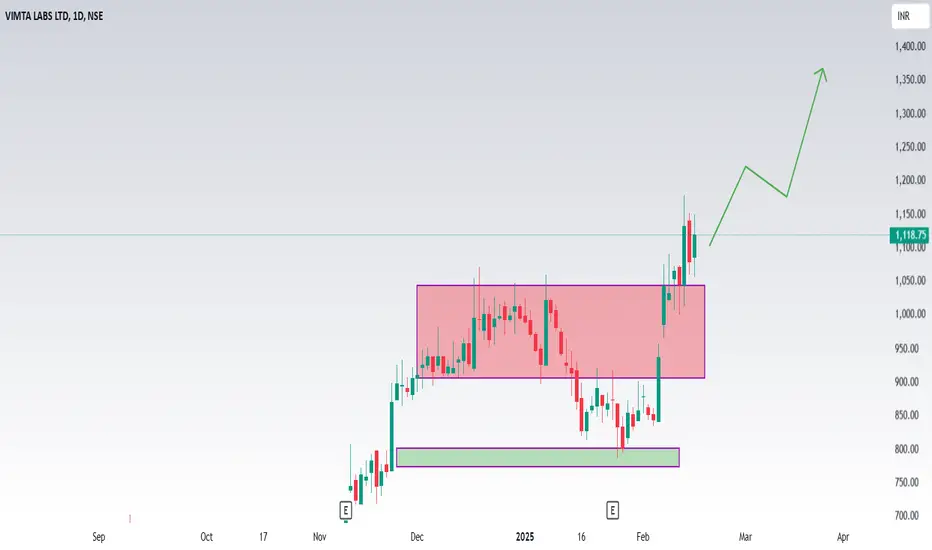
Vimta labs ltdShould I buy VIMTA LABS LTD stock? Our technical rating for VIMTA LABS LTD is buy today. Note that market conditions change all the time — according to our 1 week rating the strong buy trend is prevailing, and 1 month rating shows the strong buy signal.
Vimta Labs Ltd. (NSE: VIMTALABS) is currently exhibiting a strong bullish trend, as indicated by various technical analysis indicators.
**Technical Indicators:**
- **Moving Averages:** All moving averages (5, 10, 20, 50, 100, and 200 periods) are signaling a 'Buy' or 'Strong Buy' position, suggesting sustained upward momentum. citeturn0search2
- **Relative Strength Index (RSI):** The 14-day RSI stands at 89.33, indicating that the stock is in the overbought territory. While this suggests strong momentum, it also implies a potential for price correction. citeturn0search2
- **MACD (Moving Average Convergence Divergence):** The MACD is above the signal line, reinforcing the bullish trend. citeturn0search2
- **Stochastic Oscillator:** The Stochastic Oscillator is in the overbought zone, which may indicate a potential for price pullback. citeturn0search2
**Support and Resistance Levels:**
- **Support:** The stock has support at ₹560. citeturn0search3
- **Resistance:** The resistance level is at ₹1,020. citeturn0search3
**Volume Analysis:**
The stock has experienced high trading volumes at price peaks and lower volumes at price troughs, indicating that price movements are supported by significant trading activity. citeturn0search3
**Conclusion:**
While Vimta Labs Ltd. is currently in a strong bullish phase, the overbought conditions suggested by the RSI and Stochastic Oscillator warrant caution. Investors should monitor these indicators closely, as a price correction could occur if the stock remains in the overbought zone. It's advisable to consider these technical factors alongside fundamental analysis and broader market conditions when making investment decisions.
Useful Indicators for Future TradingIn futures trading, choosing the correct indicators can mean the difference between making a profit or a loss.
Indicators are very important as they assist traders in monitoring market conditions and forecasting future price movements.
In this article, we will cover the most useful indicators that are used while trading in the futures market.
What is Futures Trading?
Futures are financial derivatives that obligate parties to buy or sell an underlying asset at a predetermined price and date in the future.
Regardless of the market price at the contract’s expiration, the buyer or seller must transact at the agreed-upon price.
These contracts can involve physical commodities or various financial instruments. Futures contracts are standardized, specifying the asset’s quantity and making trading more straightforward.
They can be utilized for both speculative trading and hedging.
Unlike forward contracts, which are customized and traded over-the-counter (OTC), futures contracts are standardized and have uniform terms for all participants.
This ensures consistency in futures trading, regardless of the counterparties involved.
Best Indicators for Future Trading
Future trading can be enhanced simply by using the correct indicators as part of the trading strategy. In futures trading, here are some of the helpful indicators:
1. Moving Averages (MA)
Moving averages (MA) is an indicator used to filter price data and determine trends by computing average prices over a period.
The simple moving average (SMA) is defined as the average value that takes up certain fixed periods yielding a smooth trendline.
The moving average of the same value where current prices are taken into account primarily compared to historical prices is known as the Exponential moving average (EMA).
These two types also assist in determining the possible points of entry or exit when the average line is crossed by the price.
2. Relative Strength Index (RSI)
RSI is a momentum oscillator that gauges the speed and change of price movements in a market. It ranges from 0 to 100, typically with 70 indicating an overbought condition and 30 signaling an oversold state.
An RSI above 70 suggests that a security may be overvalued and could experience a price pullback, while an RSI below 30 points to a potential undervaluation, signaling a possible price increase.
Traders use RSI to identify potential buy or sell opportunities based on these extreme values, helping to forecast possible trend reversals for futures contracts.
3. MACD (Moving Average Convergence Divergence)
This trend-following momentum indicator illustrates the relationship between two moving averages of a security's price.
The MACD (Moving Average Convergence Divergence) consists of the MACD line, which is the difference between the 12-day and 26-day EMAs, and the signal line, which is the 9-day EMA of the MACD line.
When the MACD line crosses above the signal line, it suggests a potential buy signal, indicating upward momentum.
Conversely, when it crosses below, it may signal a sell opportunity, indicating downward momentum. This indicator assists futures traders in spotting potential trend reversals and uncovering trading opportunities.
4. Bollinger Bands
These consist of a middle band (SMA) and two outer bands that are standard deviations away from the middle band. Prices touching the outer bands may signal overbought or oversold conditions.
The bands expand and contract based on market volatility: wider bands indicate higher volatility, while narrower bands suggest lower volatility.
When prices move outside the bands, it may indicate an upcoming reversal or continuation of the trend.
Traders use Bollinger Bands to identify potential buy or sell opportunities for futures contracts, especially when prices revert to the middle band after touching the outer bands.
5. Fibonacci Retracement
Fibonacci Retracement is a tool that helps identify possible support and resistance levels by applying the Fibonacci sequence.
Traders plot horizontal lines at key Fibonacci levels—23.6%, 38.2%, 50%, 61.8%, and 78.6%—which are derived from the sequence.
These levels are considered crucial as they represent potential reversal points where the price might bounce or reverse direction.
By analyzing how prices react around these levels, traders can make informed predictions about future price movements and adjust their strategies accordingly.
Fibonacci retracement helps in setting target prices and stop-loss levels, enhancing trading decisions.
6. Stochastic Oscillator
The Stochastic Oscillator is a momentum indicator that compares a security's closing price to its price range over a specific period, typically 14 days.
It generates values between 0 and 100, indicating overbought or oversold conditions.
When the Stochastic Oscillator is above 80, it suggests that the security may be overbought, signaling a potential sell opportunity.
On the other hand, values below 20 indicate that the security may be oversold, which could present a buying opportunity.
The indicator helps traders identify potential reversal points by comparing current prices to historical price ranges, making it useful for spotting trends and market momentum while trading in futures.
Conclusion
Using the right tools in future trading can greatly enhance your decision-making and overall success.
Combining different indicators allows you to analyze trends, spot opportunities, and manage risks more effectively. Keep refining your approach and stay adaptable to market changes to achieve the best outcomes.

[Bitcoin] Expecting a Technical Rebound (9/7)Hello, this is Chartist.
Bitcoin has been in a continuous downtrend since reaching the $65,000 level, without any significant rebound.
Currently, it has declined by around 19% from its previous high, forming a bottom around the $52,500 level.
The Crypto Fear and Greed Index has remained in the "extreme fear" range at 22-23 over the past two days, highlighting heightened market anxiety.
Now, the key question is whether Bitcoin can stage a rebound from this point.
Based on the current technical indicators, I believe there is potential for a recovery.
Let’s take a look at the analysis.
< Chart Analysis >
I’ve used RSI, CCI, and Stochastic indicators on this chart, and all three are showing positive signals after exiting oversold conditions.
1. RSI(Relative Strength Index) : An indicator measuring buying pressure. Currently recovering from oversold levels, signaling a possible price rebound.
2. CCI(Commodity Channel Index) : Used to identify overbought and oversold conditions. It’s moving out of the oversold zone, which indicates upward momentum.
3. Stochastic : A short-term indicator that predicts price reversals. It’s recovering from the oversold region, further suggesting the likelihood of a technical rebound.
Typically, when these indicators show recovery, the price tends to move toward the middle line of the Bollinger Bands (the red line on the chart).
However, since this middle line could serve as resistance, it’s crucial to monitor how the price reacts upon reaching it.
< Summary >
1. Bitcoin has dropped from $65,000, establishing a bottom around $52,500.
2. Technical indicators such as RSI, CCI, and Stochastic are all signaling recovery from oversold conditions, indicating a potential rebound.
3. It will be important to watch if the middle line of the Bollinger Bands acts as a resistance level during this rebound.
Best of luck with your investments!
※ This is not a buy or sell recommendation.
※ It is a personal perspective and should be used for reference only.
※ All decisions and responsibilities are yours.

Technical analysis and news for today's gold trading strategyOn the 1D chart, gold has formed a doji candle, and the FED still maintains the interest rate at 5.50%. In yesterday's press conference, Mr. Powell continued to bring inflation down to 2%, and when the FED has not brought inflation down to 2-2.5%, they still did not reduce interest rates. Mr. Powell emphasized that short-term monetary policy The regime currently in place will continue until inflation and other data dissuade the Fed from maintaining the current interest rate, at which point they will begin to think about reducing interest rates, he also said that the restrictive policies The currency has not yet brought inflation down to 2%. The SPDR fund started buying in small quantities. According to technical analysis, gold is likely to increase and the immediate target is that gold will break the EMA 20, then gold can go up to retest the price increase channel. Currently, daily Stochastic is falling, the histogram has also shown signs of decreasing, RSI has also left the overbought area and is at 64. On the H4 frame, stochastic is in the oversold area and is trending up. Histogram has begun to grow negative. On the H1 chart, the histogram is growing negative and the stochastic is pointing up, showing that it is recovering, showing that gold today will sideway from about 1985-1975 and 1975-1991.

Gold is trending down after a recovery periodToday we will have very important USD news: ISM Manufacturing PMI, JOLTS Job Openings, ISM Manufacturing Prices and in the early morning of November 2 there will be 3 more news: Federal Funds Rate, FOMC Statement, FOMC Press Conference but This news is likely to have a big impact on gold, so we need to pay attention to orders when the news comes out
According to technical analysis, October is a month of strong growth for gold. On the monthly chart, histogram and stochastic have a divergence, RSI does not see a divergence.
Yesterday gold broke through the upward price channel so our trend will be to sell and the H1 stochastic frame is already in the oversold area so it is likely that gold will have a rebound to 1990, the price range from 1990-1992 we can sell stochastic The H4 frame still tends to go down, so the possibility of gold decreasing is very large

XAUUSD: Gold trend after breaking the upward price channelToday we will have very important USD news: ISM Manufacturing PMI, JOLTS Job Openings, ISM Manufacturing Prices and in the early morning of November 2 there will be 3 more news: Federal Funds Rate, FOMC Statement, FOMC Press Conference but This news is likely to have a big impact on gold, so we need to pay attention to orders when the news comes out
According to technical analysis, October is a month of strong growth for gold. On the monthly chart, histogram and stochastic have a divergence, RSI does not see a divergence.
Yesterday gold broke through the upward price channel so our trend will be to sell and the H1 stochastic frame is already in the oversold area so it is likely that gold will have a rebound to 1990, the price range from 1990-1992 we can sell stochastic The H4 frame still tends to go down, so the possibility of gold decreasing is very large

XAU USD IDEAXAU/USD
TF - Weekly is down and stochastic RSI on 50% area
Daily is down and stochastic RSI OVER BUY
4H is down stochastic RSI OVER SOLD
1H is moving up and RSI OVER SOLD
There is imbalance area on 1910 and also structure break on higher time frame so now you have to wait to come down and fill the imbalance area and move up where fill up 4H imbalance area .
For this area most likely go up because their is a imbalance on. 4H tf with no fill

Here is clean GOLD. XAU/USD area where you can get both entry XAU/USD
TF - Weekly is down and stochastic RSI on 50% area
Daily is down and stochastic RSI OVER BUY
4H is down stochastic RSI OVER SOLD
1H is moving up and RSI OVER SOLD
There is imbalance area on 1910 and also structure break on higher time frame so now you have to wait to come down and fill the imbalance area and move up where fill up 4H imbalance area .
For this area most likely go up because their is a imbalance on. 4H tf with no fill
