CNXMETAL - NIFTY METAL INDEXNifty Metal Index is possibly completed as a leading Diagonal wave 1 of wave 5 circle, where wave 5 is shorter than 3, and wave 3 is shorter than 1 ( Leading Diagonal )
If its right than possibly wave 2 of wave 5 is now Due or ready to unfold, in macd and RSI we are witnessing negative divergences, along with Negative crossover in Stochastic and MACD, also RSI is Down tick, Lets see what happens next.
Overall wave structure could be like this
macd also turned negative cross along with Negative Divergence
macd negative crossover in hourly
RSI negative Divergence
RSI Down Tick
stochastic in daily time frame negative crossover
stochastic in hourly time frame negative crossover
Most investors treat trading as a hobby because they have a full-time job doing something else.
However, If you treat trading like a business, it will pay you like a business.
If you treat like a hobby, hobbies don't pay, they cost you...!
Disclaimer.
I am not sebi registered analyst.
My studies are for educational purpose only.
Please Consult your financial advisor before trading or investing.
I am not responsible for any kinds of your profits and your losses.
Search in ideas for "stochastic"

HAL Hindustan AeronautThis stock has given good breakout on daily time frame as well as on weekly time frame, along with a good intensity of volume,
this is a newly listed stock and it is moving up impulsively, RK's Magic indicator is also suggesting to go long for forthcoming weeks,
Overall Wave Structure is also suggesting same on weekly Charts, all trend indicators are also aligned with same bias.
One can go long at current levels or in dips ( if any ) with immediate support of 1350 and major support of 1239.
All the key levels are mentioned on chart.
Overall Wave Structure could be like this on Weekly Chart.
Breakout in Daily with very good intensity of Volume
RK's Magic indicator is also suggesting to go long for forthcoming weeks
This RED curve line is nothing but support-line / stopline and it also play role of TIME-LINE
weekly macd positive crossover done
Daily macd positive crossover, uptick & now above zero line too.
Stochastic is already running positive,
but now there is very little space
pending upside in daily stochastic,
so we can assume it should retrace some amount,
before to go further up move. buy on dips is suggested.
Overall, in weekly stochastic it has pending good intensity of space upside.
Weekly RSi is uptick and also above 60
thats actually a good sign for bulls
once it crosses above 62.10 on closing basis
it would be definitely a trigger point for up move.
if RSI in Daily retests nearby 55 numbers or upto 50 too.
it can be a good buying opportunity. (may be or may be not retest)
Disclaimer.
I am not sebi registered analyst.
My studies are for educational purpose only.
Please Consult your financial advisor before trading or investing.
I am not responsible for any kinds of your profits and your losses.

BankNifty Analysis for Upcoming Weeks Hi Friends,
Pranam,
Now we are going to analysis the BankNifty for coming weeks:
In Weekly TF:
Refer the Image,
1. Bearish Flag Pattern evidence
2. Index Closed in Support
3. Dynamic Support was in the range of 34435.13 & 32611.27 as per EMA50 & EMA79
4. MACD was Flatten
5. Stochastic RSI as per my View was nearing oversold Range.
6. ATR was average.
Long Term trend is Bullish as per EMA200.
In Daily TF:
1. Falling Wedge Pattern formed
2. BankNifty was in the support zone.
3. Index was taken the dynamic support 38394.41 and 37639.12 as per EMA50 & EMA79.
4. MACD was Bearish
5. Stochastic RSI was oversold Range.
6. ATR was average.
7. CPR was Bullish Bias
Long Term Trend is Bullish as per EMA200.
In 1hr TF:
1. Descending Triangle Pattern formed.
2. Bank nifty was taken support and traded near the trendline of the triangle.
3. Dynamic Resistance was at range of 39124.25 and 39283.90 as per EMA50 & EMA79
4. MACD was Bullish
5. Stochastic RSI as nearing Overbought zone
6. ATR was down.
7. CPR was Bearish Bias.
Long Term Trend is Bearish as per EMA200.
Conclusion:
Trend was in Downside as per 1hr TF. Retracement candle was very small.
For Short Term BankNifty will be in downside if brakes the support zone of 38400.
Disclaimer: Kindly do your own analysis before executing the trade.

Vodafone Idea - LONGVI has bounced back up from the crucial support zone.
Screener Strategy
RSI -> Cross-up - 30
Stochastic %D -> Below 30
Stochastic %k -> Above %D
Volume >500k
Basically what this indicates is that the stock has gained upward momentum as the Stochastic oscillator has crossed and the stock is not within the RSI zone. The volume filter is kept to weed out any illiquid stocks.
My opinion is to go LONG

Alok Industries LONGScreener Strategy
RSI -> Cross-up - 30
Stochastic %D -> Below 30
Stochastic %k -> Above %D
Volume >500k
Basically what this indicates is that the stock has gained upward momentum as the Stochastic oscillator has crossed and the stock is not within the RSI zone. The volume filter is kept to weed out any illiquid stocks.
My opinion is to go LONG

CIPLA swing trade ideaAfter an implusive move the stock has pulled back and is taking a support at fibonacci retracement level of 38.20% and 50ema, and stochasticRSI is crossing over. A break above the descending trendline will be a good buy opportunity for swing trade.

ICICIBK swing trade analysisDescending trendline breakout, strong support, stochasticRSI divergence, macd crossover, raising volume, Q4 result is good and since it fell nearly 20% from its highs in last 2 months its a good time to buy.

MRF swing trade ideaA falling wedge pattern is being formed with stochasticrsi divergence and macd crossover, volume is above average, a break above 83650 will be a good buy signal and if it breaks above 90300 it can be held for a further target of 96700.

BANKBARODA swing trade setupInverse head and shoulder pattern is being formed at an important support zone with raising stochasticrsi and macd crossover. Wait for a breakout above 76 to buy

Nifty opinion: Nifty can go up to 760 on op before falling againPrice can go up in opening to 14750-14760 should face resistance there of the daily 10 MA
From there it can start falling facing support at 14673, 14630, 14580.
For a big move today, 14760 on the upside should be crossed and for a big down move today 14673, 14630 and 14580 needs to be breached.
Hourly stochastic is negative. Daily stochastic is positive. Weekly stochastic is negative and since its a weekly closing price should ideally close below 14724.
FIIs and Pro traders are net negative on Index while clients are net positive.
Best of luck for today!!

Nifty opinion: Unless 14926 is broken on upside, 14350 is comingNifty has for the third time recently touched the same price zone of 870-900 and was rejected twice earlier, now on the third time its likely that price will not be able to break this level upside.
If it does then 15000 isn't far.
While if it does not then 14350 is coming where price can take support but since it has already breached below 14350, this time its probably going to 14030 which is 0.786 correction from the rally that began on 1st Feb.
Hourly stochastic is oversold though k% is still above D%.
Daily stochastic is positive and shows bullishness
Weekly stochastic turned negative since last week.
If we look at weekly chart and if the correction is going to continue, then this week's closing could be near 14300-14350 which though seems difficult as then Nifty has to fall by 500 points in 2 days.

MarketMonster A,B,SR - Access now on your TradingviewMARKET MONSTER IS THE ALL-IN-ONE MOST PROVEN SET OF TRADING INSTRUMENTS FOR TRADERS
Market Monster combines over 30 years of trading experience and dozens of indicators into one comprehensive package. It is the single best, most versatile indicator specially designed for Bitcoin but usable in all financial markets. The Market Monster does the majority of the leg work in interpreting the data, spitting out various symbols which will guide your trading. Not only will the Market Monster give you strong hands in a volatile market, it will also call every top and bottom and warn you of price traps. Whether you prefer oscillators, support and resistance lines, or examining moving averages, the Market Monster caters to all styles of trading while interpreting all of the data for you.
----------------
The MarketMonster Indicator Pack is a pre coded tuned version of indicators with accurate signals and added divergences.
MarketMonster Indicators are built over multiple indicators and ajusted how we like it with a nice design which gives some flare.
Layering the Indicators came from the original concept created on MarketMonster however all the indicators are free indicators on Trading View then re-coded how we like it.
MarketMonster (A) (B) & S/R Use a list of modified Indicators plus some hidden to avoid a total mess.
Here is an list of most of them. (Wavetrend , VWAP , MFI , RSI , Stoch & Divergence.)
MarketMonster-A is an EMA ribbon comprised of 8 EMAs that are blue/white during a bull market and gray during a bear market. The intersections of these lines can be very strong lagging indications, so we have programmed MarketMonster A to project symbols which correspond to various indications so you don’t have to manually interpret each bullish or bearish cross. It also gives a great visual of the trend, supplying you with strong mathematical support or resistance. MarketMonster-A was made to easily analyze, isolate, and anticipate macro trends.
Key Features:
* EMA Ribbons
* Symbolic Guidance
* Helps you identify and understand your trading environment
* Recommend Candles: Heiken Ashi.
MarketMonster-B is an all-in-one oscillator allowing for more quality indications than ever before. It combines five algorithms (some well-known, some custom) that have all been fine-tuned and smoothed for optimal analysis and trading results. When all of the algorithms converge, MarketMonster-B will project a “Green Dot & Blue Diamond" which will aid you in longing the dips in bull markets as well as temporarily exiting shorts in bear markets. The Green Dot is often accompanied by extreme sellers’ momentum and will warn you of potential market bottoms, giving you strong hands even when the night is at its darkest. MarketMonter-B certainly excels on the small time frames, but is a particularly deadly tool for isolating large swings in the market.
Key Features:
*6 Oscillators optimized and consolidated into one
*Green dot market bottoms
*Ultimate market barometer and trade initiator
*Recommended candles: heiken ashi or standard candlesticks
*Red dot market top.
Primary Triggers:
Green Dots – Leading buy signals that excel in sideways and upwards trends.
Red Dots - Leading sell signals that excel in sideways and downwards trends.
Blue Waves – You are looking for overbought and oversold readings for the most part here, but to get the most out of these waves.
Divergence - spot divergent price action which often foreshadows a future price move.
Yellow VWAP – We have incorporated the VWAP into an oscillator. It is the easiest algorithm on B to read. When it crosses up, you are long until the next cross down. When it crosses down, you are short until the next cross up.
Secondary Triggers:
MFI – The custom Money Flow oscillator gives a great visual of market conditions. When it is green, we say the grass is growing, the Bulls are grazing, and the strategy is to buy dips. When the MFI is red, buyers are dead, and the prevailing strategy is to short the peaks. You can filter many bad trades by paying attention to the MFI .
RSI – The RSI misses many opportunities on its own, but when used in tandem the other oscillators in B, can provide an extra layer of confidence via overbought and oversold readings.
Stochastic RSI – The Stochastic RSI is an indicator of an indicator. When it crosses the regular RSI , it paints green or red, signaling a bullish or bearish cross. No more manual scanning for RSI crosses! These events have greater importance on higher timeframes where the Stochastic RSI often paints red or green for weeks or months at a time. When the change in color finally occurs, that can be a strong indication to long or short.
Divergence Line -The Bearish divergence is the pattern that occurs when the price reaches higher highs, while the technical indicator makes lower highs. Although there is a bullish attitude on the market, the discrepancy means that the momentum is slowing. Therefore it is likely that there will be a rapid decline in price.
-The Bullish divergence occurs when prices fall to a new low while an oscillator fails to reach a new low. This situation demonstrates that bears are losing power, and that bulls are ready to control the market again—often a bullish divergence marks the end of a downtrend.

MarketMonster A,B,SR -Trade like a pro ,Dm me for access GuysMARKET MONSTER IS THE ALL-IN-ONE MOST PROVEN SET OF TRADING INSTRUMENTS FOR TRADERS
Market Monster combines over 30 years of trading experience and dozens of indicators into one comprehensive package. It is the single best, most versatile indicator specially designed for Bitcoin but usable in all financial markets. The Market Monster does the majority of the leg work in interpreting the data, spitting out various symbols which will guide your trading. Not only will the Market Monster give you strong hands in a volatile market, it will also call every top and bottom and warn you of price traps. Whether you prefer oscillators, support and resistance lines, or examining moving averages, the Market Monster caters to all styles of trading while interpreting all of the data for you.
----------------
The MarketMonster Indicator Pack is a pre coded tuned version of indicators with accurate signals and added divergences.
MarketMonster Indicators are built over multiple indicators and ajusted how we like it with a nice design which gives some flare.
Layering the Indicators came from the original concept created on MarketMonster however all the indicators are free indicators on Trading View then re-coded how we like it.
MarketMonster (A) (B) & S/R Use a list of modified Indicators plus some hidden to avoid a total mess.
Here is an list of most of them. (Wavetrend , VWAP , MFI , RSI , Stoch & Divergence.)
MarketMonster-A is an EMA ribbon comprised of 8 EMAs that are blue/white during a bull market and gray during a bear market. The intersections of these lines can be very strong lagging indications, so we have programmed MarketMonster A to project symbols which correspond to various indications so you don’t have to manually interpret each bullish or bearish cross. It also gives a great visual of the trend, supplying you with strong mathematical support or resistance. MarketMonster-A was made to easily analyze, isolate, and anticipate macro trends.
Key Features:
* EMA Ribbons
* Symbolic Guidance
* Helps you identify and understand your trading environment
* Recommend Candles: Heiken Ashi.
MarketMonster-B is an all-in-one oscillator allowing for more quality indications than ever before. It combines five algorithms (some well-known, some custom) that have all been fine-tuned and smoothed for optimal analysis and trading results. When all of the algorithms converge, MarketMonster-B will project a “Green Dot & Blue Diamond" which will aid you in longing the dips in bull markets as well as temporarily exiting shorts in bear markets. The Green Dot is often accompanied by extreme sellers’ momentum and will warn you of potential market bottoms, giving you strong hands even when the night is at its darkest. MarketMonter-B certainly excels on the small time frames, but is a particularly deadly tool for isolating large swings in the market.
Key Features:
*6 Oscillators optimized and consolidated into one
*Green dot market bottoms
*Ultimate market barometer and trade initiator
*Recommended candles: heiken ashi or standard candlesticks
*Red dot market top.
Primary Triggers:
Green Dots – Leading buy signals that excel in sideways and upwards trends.
Red Dots - Leading sell signals that excel in sideways and downwards trends.
Blue Waves – You are looking for overbought and oversold readings for the most part here, but to get the most out of these waves.
Divergence - spot divergent price action which often foreshadows a future price move.
Yellow VWAP – We have incorporated the VWAP into an oscillator. It is the easiest algorithm on B to read. When it crosses up, you are long until the next cross down. When it crosses down, you are short until the next cross up.
Secondary Triggers:
MFI – The custom Money Flow oscillator gives a great visual of market conditions. When it is green, we say the grass is growing, the Bulls are grazing, and the strategy is to buy dips. When the MFI is red, buyers are dead, and the prevailing strategy is to short the peaks. You can filter many bad trades by paying attention to the MFI .
RSI – The RSI misses many opportunities on its own, but when used in tandem the other oscillators in B, can provide an extra layer of confidence via overbought and oversold readings.
Stochastic RSI – The Stochastic RSI is an indicator of an indicator. When it crosses the regular RSI , it paints green or red, signaling a bullish or bearish cross. No more manual scanning for RSI crosses! These events have greater importance on higher timeframes where the Stochastic RSI often paints red or green for weeks or months at a time. When the change in color finally occurs, that can be a strong indication to long or short.
Divergence Line -The Bearish divergence is the pattern that occurs when the price reaches higher highs, while the technical indicator makes lower highs. Although there is a bullish attitude on the market, the discrepancy means that the momentum is slowing. Therefore it is likely that there will be a rapid decline in price.
-The Bullish divergence occurs when prices fall to a new low while an oscillator fails to reach a new low. This situation demonstrates that bears are losing power, and that bulls are ready to control the market again—often a bullish divergence marks the end of a downtrend.

MarketMonster A,B,SR - message me for AccessMARKET MONSTER IS THE ALL-IN-ONE MOST PROVEN SET OF TRADING INSTRUMENTS FOR TRADERS
Market Monster combines over 30 years of trading experience and dozens of indicators into one comprehensive package. It is the single best, most versatile indicator specially designed for Bitcoin but usable in all financial markets. The Market Monster does the majority of the leg work in interpreting the data, spitting out various symbols which will guide your trading. Not only will the Market Monster give you strong hands in a volatile market, it will also call every top and bottom and warn you of price traps. Whether you prefer oscillators, support and resistance lines, or examining moving averages, the Market Monster caters to all styles of trading while interpreting all of the data for you.
----------------
The MarketMonster Indicator Pack is a pre coded tuned version of indicators with accurate signals and added divergences.
MarketMonster Indicators are built over multiple indicators and ajusted how we like it with a nice design which gives some flare.
Layering the Indicators came from the original concept created on MarketMonster however all the indicators are free indicators on Trading View then re-coded how we like it.
MarketMonster (A) (B) & S/R Use a list of modified Indicators plus some hidden to avoid a total mess.
Here is an list of most of them. (Wavetrend , VWAP , MFI , RSI , Stoch & Divergence.)
MarketMonster-A is an EMA ribbon comprised of 8 EMAs that are blue/white during a bull market and gray during a bear market. The intersections of these lines can be very strong lagging indications, so we have programmed MarketMonster A to project symbols which correspond to various indications so you don’t have to manually interpret each bullish or bearish cross. It also gives a great visual of the trend, supplying you with strong mathematical support or resistance. MarketMonster-A was made to easily analyze, isolate, and anticipate macro trends.
Key Features:
* EMA Ribbons
* Symbolic Guidance
* Helps you identify and understand your trading environment
* Recommend Candles: Heiken Ashi.
MarketMonster-B is an all-in-one oscillator allowing for more quality indications than ever before. It combines five algorithms (some well-known, some custom) that have all been fine-tuned and smoothed for optimal analysis and trading results. When all of the algorithms converge, MarketMonster-B will project a “Green Dot & Blue Diamond" which will aid you in longing the dips in bull markets as well as temporarily exiting shorts in bear markets. The Green Dot is often accompanied by extreme sellers’ momentum and will warn you of potential market bottoms, giving you strong hands even when the night is at its darkest. MarketMonter-B certainly excels on the small time frames, but is a particularly deadly tool for isolating large swings in the market.
Key Features:
*6 Oscillators optimized and consolidated into one
*Green dot market bottoms
*Ultimate market barometer and trade initiator
*Recommended candles: heiken ashi or standard candlesticks
*Red dot market top.
Primary Triggers:
Green Dots – Leading buy signals that excel in sideways and upwards trends.
Red Dots - Leading sell signals that excel in sideways and downwards trends.
Blue Waves – You are looking for overbought and oversold readings for the most part here, but to get the most out of these waves.
Divergence - spot divergent price action which often foreshadows a future price move.
Yellow VWAP – We have incorporated the VWAP into an oscillator. It is the easiest algorithm on B to read. When it crosses up, you are long until the next cross down. When it crosses down, you are short until the next cross up.
Secondary Triggers:
MFI – The custom Money Flow oscillator gives a great visual of market conditions. When it is green, we say the grass is growing, the Bulls are grazing, and the strategy is to buy dips. When the MFI is red, buyers are dead, and the prevailing strategy is to short the peaks. You can filter many bad trades by paying attention to the MFI .
RSI – The RSI misses many opportunities on its own, but when used in tandem the other oscillators in B, can provide an extra layer of confidence via overbought and oversold readings.
Stochastic RSI – The Stochastic RSI is an indicator of an indicator. When it crosses the regular RSI , it paints green or red, signaling a bullish or bearish cross. No more manual scanning for RSI crosses! These events have greater importance on higher timeframes where the Stochastic RSI often paints red or green for weeks or months at a time. When the change in color finally occurs, that can be a strong indication to long or short.
Divergence Line -The Bearish divergence is the pattern that occurs when the price reaches higher highs, while the technical indicator makes lower highs. Although there is a bullish attitude on the market, the discrepancy means that the momentum is slowing. Therefore it is likely that there will be a rapid decline in price.
-The Bullish divergence occurs when prices fall to a new low while an oscillator fails to reach a new low. This situation demonstrates that bears are losing power, and that bulls are ready to control the market again—often a bullish divergence marks the end of a downtrend.
Comments

THE TRADING WHALES PRESENTS - MarketMonster-A,B,SR- Access NowMARKET MONSTER IS THE ALL-IN-ONE MOST PROVEN SET OF TRADING INSTRUMENTS FOR TRADERS
Market Monster combines over 30 years of trading experience and dozens of indicators into one comprehensive package. It is the single best, most versatile indicator specially designed for Bitcoin but usable in all financial markets. The Market Monster does the majority of the leg work in interpreting the data, spitting out various symbols which will guide your trading. Not only will the Market Monster give you strong hands in a volatile market, it will also call every top and bottom and warn you of price traps. Whether you prefer oscillators, support and resistance lines, or examining moving averages, the Market Monster caters to all styles of trading while interpreting all of the data for you.
MarketMonster-A is an EMA ribbon comprised of 8 EMAs that are blue/white during a bull market and gray during a bear market. The intersections of these lines can be very strong lagging indications, so we have programmed MarketMonster A to project symbols which correspond to various indications so you don’t have to manually interpret each bullish or bearish cross. It also gives a great visual of the trend, supplying you with strong mathematical support or resistance. MarketMonster-A was made to easily analyze, isolate, and anticipate macro trends.
Key Features:
* EMA Ribbons
* Symbolic Guidance
* Helps you identify and understand your trading environment
* Recommend Candles: Heiken Ashi.
MarketMonster-B is an all-in-one oscillator allowing for more quality indications than ever before. It combines five algorithms (some well-known, some custom) that have all been fine-tuned and smoothed for optimal analysis and trading results. When all of the algorithms converge, MarketMonster-B will project a “Green Dot & Blue Diamond" which will aid you in longing the dips in bull markets as well as temporarily exiting shorts in bear markets. The Green Dot is often accompanied by extreme sellers’ momentum and will warn you of potential market bottoms, giving you strong hands even when the night is at its darkest. MarketMonter-B certainly excels on the small time frames, but is a particularly deadly tool for isolating large swings in the market.
Key Features:
*6 Oscillators optimized and consolidated into one
*Green dot market bottoms
*Ultimate market barometer and trade initiator
*Recommended candles: heiken ashi or standard candlesticks
*Red dot market top.
Primary Triggers:
Green Dots – Leading buy signals that excel in sideways and upwards trends.
Red Dots - Leading sell signals that excel in sideways and downwards trends.
Blue Waves – You are looking for overbought and oversold readings for the most part here, but to get the most out of these waves.
Divergence - spot divergent price action which often foreshadows a future price move.
Yellow VWAP – We have incorporated the VWAP into an oscillator. It is the easiest algorithm on B to read. When it crosses up, you are long until the next cross down. When it crosses down, you are short until the next cross up.
Secondary Triggers:
MFI – The custom Money Flow oscillator gives a great visual of market conditions. When it is green, we say the grass is growing, the Bulls are grazing, and the strategy is to buy dips. When the MFI is red, buyers are dead, and the prevailing strategy is to short the peaks. You can filter many bad trades by paying attention to the MFI .
RSI – The RSI misses many opportunities on its own, but when used in tandem the other oscillators in B, can provide an extra layer of confidence via overbought and oversold readings.
Stochastic RSI – The Stochastic RSI is an indicator of an indicator. When it crosses the regular RSI , it paints green or red, signaling a bullish or bearish cross. No more manual scanning for RSI crosses! These events have greater importance on higher timeframes where the Stochastic RSI often paints red or green for weeks or months at a time. When the change in color finally occurs, that can be a strong indication to long or short.
Divergence Line -The Bearish divergence is the pattern that occurs when the price reaches higher highs, while the technical indicator makes lower highs. Although there is a bullish attitude on the market, the discrepancy means that the momentum is slowing. Therefore it is likely that there will be a rapid decline in price.
-The Bullish divergence occurs when prices fall to a new low while an oscillator fails to reach a new low. This situation demonstrates that bears are losing power, and that bulls are ready to control the market again—often a bullish divergence marks the end of a downtrend.
Leave a comment that is helpful or encouraging. Let's master the markets together

MarketMonster-B - All in one trading indicator MARKET MONSTER IS THE ALL-IN-ONE MOST PROVEN SET OF TRADING INSTRUMENTS FOR TRADERS
Market Monster combines over 30 years of trading experience and dozens of indicators into one comprehensive package. It is the single best, most versatile indicator specially designed for Bitcoin but usable in all financial markets. The Market Monster does the majority of the leg work in interpreting the data, spitting out various symbols which will guide your trading. Not only will the Market Cipher give you strong hands in a volatile market, it will also call every top and bottom and warn you of price traps. Whether you prefer oscillators, support and resistance lines, or examining moving averages, the Market Monster caters to all styles of trading while interpreting all of the data for you.
MarketMonster-B is an all-in-one oscillator allowing for more quality indications than ever before. It combines five algorithms (some well-known, some custom) that have all been fine-tuned and smoothed for optimal analysis and trading results. When all of the algorithms converge, MarketMonster-B will project a “Green Dot & Blue Diamond" which will aid you in longing the dips in bull markets as well as temporarily exiting shorts in bear markets. The Green Dot is often accompanied by extreme sellers’ momentum and will warn you of potential market bottoms, giving you strong hands even when the night is at its darkest. MarketMonter-B certainly excels on the small time frames, but is a particularly deadly tool for isolating large swings in the market.
Key Features:
*6 Oscillators optimized and consolidated into one
*Green dot market bottoms
*Ultimate market barometer and trade initiator
*Recommended candles: heiken ashi or standard candlesticks
*Red dot market top.
Primary Triggers:
Green Dots – Leading buy signals that excel in sideways and upwards trends.
Red Dots - Leading sell signals that excel in sideways and downwards trends.
Blue Waves – You are looking for overbought and oversold readings for the most part here, but to get the most out of these waves.
Divergence - spot divergent price action which often foreshadows a future price move.
Yellow VWAP – We have incorporated the VWAP into an oscillator. It is the easiest algorithm on B to read. When it crosses up, you are long until the next cross down. When it crosses down, you are short until the next cross up.
Secondary Triggers:
MFI – The custom Money Flow oscillator gives a great visual of market conditions. When it is green, we say the grass is growing, the Bulls are grazing, and the strategy is to buy dips. When the MFI is red, buyers are dead, and the prevailing strategy is to short the peaks. You can filter many bad trades by paying attention to the MFI .
RSI – The RSI misses many opportunities on its own, but when used in tandem the other oscillators in B, can provide an extra layer of confidence via overbought and oversold readings.
Stochastic RSI – The Stochastic RSI is an indicator of an indicator. When it crosses the regular RSI , it paints green or red, signaling a bullish or bearish cross. No more manual scanning for RSI crosses! These events have greater importance on higher timeframes where the Stochastic RSI often paints red or green for weeks or months at a time. When the change in color finally occurs, that can be a strong indication to long or short.

NIFTY WEEKLY VIEW - 1Last week the 2 SMA came above 5 SMA indicating the intention of the Nifty to go up. MACD signals and histograms are
above 0 (bullish). Stochastic tried to cross 80 a few weeks ago and failed. This time it crossed 80 and once the stochastic
signal cross over happens NS can play between 80 and 100 for a number of weeks and month. Until the MACD histograms drops
below 0 the NS can be seen scaling higher and higher with intermediary dips when stochastic touches 100 and signals c/o..

ULTIMATE Strategy : Huge profit ratio : WATCH THIS**Hello traders !
My name is Alex 0.19% 0.19% and Im a 21 years old trader and business man from Canada.
For the last 3 months i've work on finding the perfect stochastic/rsi combo on multi time frame .
I've found and backtested a lot of system using 3 to 8 different time frame stochastic/rsi at the same time .
Some of these system are giving me a 75% win ratio with R/R : 1 , without** any other technical analysis . (584/786 trade test on 6 months , 10 major pairs , specific TP and SL ) -- Forex & Oil 0.00% -0.02%
But when we add these system with a technical analysis ( Fibonacci , trend , support , etc.. ) , It's another game : huge profit ratio , small or no drawdown & unreal risk/reward.
By following me you will receive some good technical analysis wich I use in combo with alot of different RSI/stoch system .
If you want to trade this strategy by yourself I recommand that you practice in demo before .
The indicator is CM 0.64% 0.64% Stochastic Multi-TimeFrame , thanks a lot to the creator ! ( See in related ideas )
Otherwise if you want some additional information you can contact me in private.
If wou want to thanks me , please like & follow .

Nifty 50 Price ActionNifty 50 is trading near 24,715 as of September 4, 2025, showing mild recovery after several sessions of volatility and weakness. The index has bounced back above the 24,600 support zone with improved breadth and higher volumes, but technical indicators reflect a cautious undertone. All short- and medium-term moving averages (5, 10, 20, 50) still point bearish, and bearish crossovers on 5-20 and 20-50 day averages reinforce negative momentum. Oscillators like MACD, stochastics, ROC, and CCI remain in bearish territory, while RSI sits neutral around 45, and William %R signals oversold conditions, suggesting the possibility of a short-term bounce.
Immediate resistance for Nifty is seen at 24,650–24,700, with a major hurdle near the 50-day moving average in the 24,850 area. A decisive move above these levels would strengthen bullish sentiment, potentially opening up the range to 25,250–25,500. On the downside, key support remains at 24,500, with stronger base near 24,250. A break below these supports could lead to extension of the recent pullback toward the 24,000 level.
The broader trend appears range-bound with slight positive bias, but foreign institutional investors have been net sellers, which has tempered upside momentum. Sectors like auto, capital goods, and select mid-cap stocks are attracting buyers, while defensive sectors remain subdued. For now, a cautious approach is advised, using “sell on rise” until Nifty can reclaim more short-term moving averages. Long-term trend remains bullish, suggesting dips should be viewed as buying opportunities for quality stocks, especially if domestic and global cues improve.

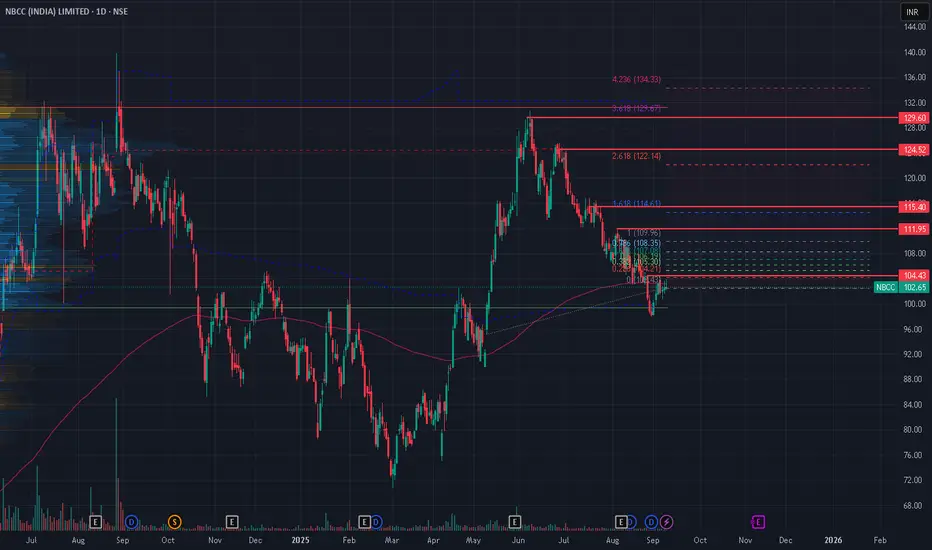
NBCC ANALYSIS NBCC (India) Ltd is fundamentally strong with impressive growth, high profitability, and sector leadership, but valuations are currently stretched versus recent earnings. Technical indicators are bullish, signaling potential upside. Peer comparison highlights NBCC’s strong returns and capital efficiency among real estate and construction stocks. Brokerage targets suggest moderate gains in the next 6–12 months.
***
## Fundamental Analysis
- **ROCE:** 39.22% (FY2025), consistently high and sector leading.
- **ROE:** 23.7% (FY2025), higher than most competitors (DLF 7.8%, Godrej Properties 6.3%).
- **CAGR (5Y):** Revenue CAGR 14.71%, PAT CAGR 24.44%, Operating Profit CAGR 43.51% (FY21–FY25)
- **Debt:** Debt-free with strong balance sheet and high interest coverage.
- **Fair Value:** Trading 103% above EV/EBITDA model fair value; P/E is 47.2x (TTM), above historical average for the sector.
- **Market Cap:** ₹27,618 Cr.
***
## Technical Analysis
- **Current Price:** ₹102.65 as of 9 Sept, 2025.
- **Trend:** Bullish across all major moving averages and oscillators (RSI, MACD, Stochastics).
- **Key Support Levels:** ₹100 (psychological), ₹98 (recent low).
- **Resistance/Targets (Fibonacci):** ₹104.43, ₹111.95, ₹115.40, ₹124.52, ₹129.60, ₹134.33 (major pivots/post-breakout targets in chart).
- **Volatility:** Recent correction offers accumulation zone, with upward momentum building in September.
***
## Brokerage & Peer Comparison
| Company | ROCE | ROE | PE Ratio | 5Y Sales CAGR | Market Cap (₹ Cr) | Target (₹, 6M–1Y) | Sector Avg PE |
|-------------------|--------|--------|----------|---------------|-------------------|-------------------|---------------|
| NBCC (India) Ltd | 39.2% | 23.7% | 47.2x | 14.7% | 27,618 | 115–120 (consensus) | 43.3x |
| DLF Ltd | 7.8% | 6.9% | 68.3x | 11.9% | 187,084 | 140–145 | |
| Godrej Properties | 6.3% | 5.6% | 38.1x | 8.4% | 59,107 | 1750–1800 | |
| Oberoi Realty | 13.9% | 6.4% | 28.9x | 12.4% | 59,410 | 1340–1400 | |
| Phoenix Mills | 10.2% | 8.4% | 41.5x | 11.1% | 54,265 | 2150–2200 | |
| Prestige Estates | 6.1% | 4.7% | 97.4x | 9.3% | 65,103 | 750–800 | |
- NBCC’s ROCE and ROE are **well above sector average**, signaling top operational performance.
***
## Market Share & Three-Year Outlook
- NBCC holds a significant share in government and public sector project management, specializing in redevelopment and infra construction.
- Growth is led by steady order book (~₹60,000+ Cr), executing marquee projects (government colonies, Bharat Vandana Park).
- With government infra push and NBCC’s debt-free profile, analysts expect 15–16% annual growth in topline with margin expansion.
- Prospects are positive for the next 3 years, with brokerage consensus targets of ₹115–120. Robust financials and business pipeline support steady double-digit CAGR, but valuation caution is advised for fresh entries at current levels.
***
**NBCC remains a leader in project management with strong returns, high growth, and bullish technicals, offering a solid medium-term investment outlook among peers but currently trading at a valuation premium**.
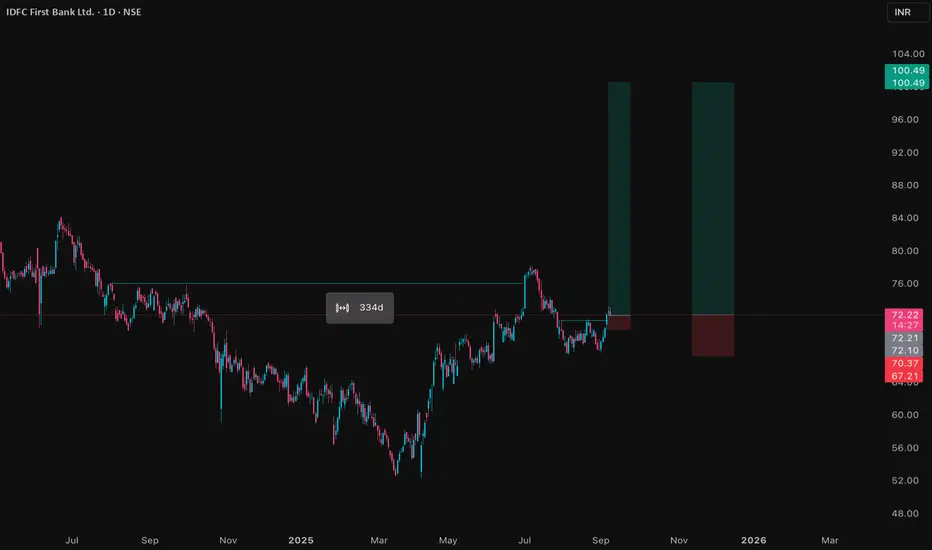
IDFCFIRSTB Price ActionIDFC First Bank is trading at ₹72.60 as of September 8, 2025, and maintains a solid presence in India’s private banking sector. The stock has a market capitalization near ₹53,264 crore, having seen an 8.7% gain over the last three months and a 25% rise over six months, while its year-on-year change is slightly negative. The share price is just below its 52-week high of ₹78.50, reflecting mild short-term consolidation after recent rallies.
Financially, IDFC First Bank continues to deliver growth: its annual operating revenue for FY25 approached ₹36,500 crore. Net interest margin remains strong at 5.6%, and the bank’s gross NPA ratio has declined to 1.87%, with net NPA at 0.53%, representing improved asset quality. Net profit for the previous year edged higher, and the latest quarter saw stable promoter holdings, a minor uptick in DII ownership, and balanced institutional participation.
The valuation remains elevated, with a price-to-earnings ratio of 40.78 and price-to-book near 1.4, as the market is factoring in future growth from retail advances, digital initiatives, and improving cost efficiencies. Technical indicators show the share trading above 50-day and 200-day averages, confirming ongoing bullish sentiment, and weekly stochastics point to strong price momentum. Dividend yield is modest but consistent, as the bank prioritizes growth and capital buffers.
Overall, IDFC First Bank offers a constructive outlook thanks to ongoing improvements in profitability, asset quality, and operational metrics. The bank is well-positioned for further gains if trends in retail lending, fee income, and digital channels remain favorable.