Kalyan Jewellers: Wave Y Still at Play?Disclaimer: This analysis is for educational purposes only and does not constitute investment advice. Please do your own research (DYOR) before making any trading decisions.
Bigger Picture
Kalyan Jewellers topped near 795.40 and has been in a prolonged corrective phase. The structure since then is not impulsive but rather corrective — pointing toward a Double Combo (W–X–Y) correction.
Wave Structure Breakdown
Wave W: A clean zigzag down into 399.40 , completing the first corrective leg.
Wave X: Extended choppy consolidation into 616.00 , best interpreted as a connector.
Wave Y: Currently unfolding as an A–B–C decline . If the pattern holds, another leg lower could complete the structure.
Technical Confluence
Support Zone: 399.40 remains a major demand area , historically respected by price. If retested, it could become the potential accumulation zone .
Projected Trendline Resistance: The descending line from 795.40 to 616.00 may evolve into a key resistance barrier on the next test.
RSI: Recent bounce came from oversold territory — a technical relief rally, not yet a trend change .
Alternate Possibility
If the 442.25 low already marked the end of Wave Y, the current rally could evolve into the start of a new impulsive sequence . Confirmation requires RSI strength above midline (50) and sustained closes beyond the projected descending trendline.
Takeaway
Kalyan Jewellers is most likely unfolding a Double Combo correction (W–X–Y) with Wave Y still in progress. Traders should watch the 399.40 demand zone as a decisive level. Holding it could set up the next bullish cycle, while a breakdown risks a deeper correction toward 336.05.
Search in ideas for "zigzag"

City Union Bank – Tight Stop, Wave 3 Setup in PlayDisclaimer: This analysis is for educational purposes only and does not constitute investment advice. Please do your own research (DYOR) before making any trading decisions.
Elliott Wave Setup
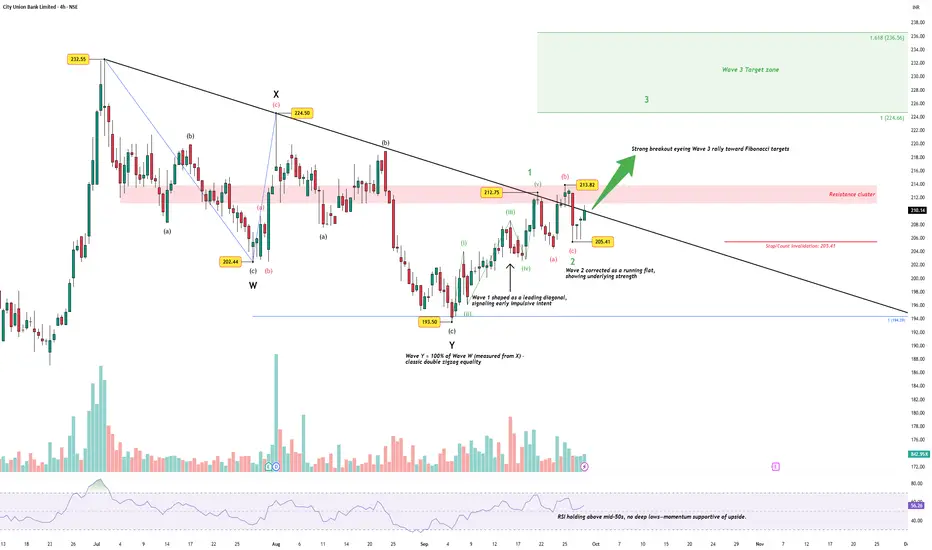
City Union Bank has completed a W–X–Y double zigzag correction into 193.50, with Wave Y equaling Wave W — a classic case of corrective symmetry. From that low:
Wave 1 unfolded as a leading diagonal.
Wave 2 corrected as a running flat, showing underlying strength.
Price is now attempting a breakout, suggesting Wave 3 is underway.
The stop-loss / invalidation is clear: 205.41 , the Wave 2 low. This creates a textbook tight-risk entry point.
Why Wave 3 Matters
Wave 3 in Elliott theory is often the strongest, most extended move. Early signs support this potential:
RSI is holding above mid-50s without new lows → momentum remains bullish.
Volume has dried up during correction but is starting to expand with breakout attempts.
Target zone : 224.6 → 236.5 (1.0–1.618 Fib extensions of Wave 1).
Immediate challenge lies at the 212–214 resistance cluster. A clean break above confirms acceleration.
Trading the Setup
Tight stop: below 205.41.
Potential reward: 20–25 points higher.
Risk/Reward: exactly what traders look for in a Wave 3 entry.
For readers, the bigger lesson is how Elliott Wave provides natural stop placement. By respecting Wave 2 lows, traders can define risk precisely and be positioned for the explosive Wave 3 rally.
The Takeaway
This is not just a bullish call on City Union Bank. It’s a case study in EW discipline:
Use Wave 2 lows as invalidation.
Look for Wave 3 to deliver the reward.
Enter with conviction only when structure + momentum align.
Info Edge India – Wedge in Wave X, Bearish Continuation in PlayAfter topping near 1825.80 , price has been locked in a W–X–Y double zigzag :
Wave W ended at 1157.00 with an ending diagonal.
The bounce into 1550.00 formed a wedge-like structure , completing Wave X .
From there, Wave Y kicked off with a leading diagonal in Wave A down to 1287.10 .
The recovery into 1437.80 looks like a completed Wave B , capped by trendline resistance.
As long as price stays below 1437.80 , the bias is bearish with downside potential into:
Target 1 : 1174.90 (equality with Wave A)
Target 2 : 1012.45 (1.618 extension of Wave A)
RSI remains capped under 50 with its own trendline resistance, supporting continuation of bearish momentum rather than reversal.
Invalidation: Above 1437.80
Disclaimer: This analysis is for educational purposes only and does not constitute investment advice. Please do your own research (DYOR) before making any trading decisions.

Ixigo (Le Travenues Technology) – First Impulse Wave Completed
Le Travenues Technology, better known as Ixigo, went public on 18 Jun 2024. Post listing, the stock entered a corrective phase, unfolding as a zigzag, which concluded on 4 Mar 2025. Since then, it has been advancing in a motive impulse wave.
The first impulse wave now looks complete.
Wave Structure:
Waves 1 & 2 – Small and completed on 12 Mar 2025.
Wave 3 – A powerful impulse, with extensions in all three actionary sub-waves (rare).
Sub-wave 1 ≈ Sub-wave 3 (equality).
Sub-wave 5 ≈ 78.6% of Sub-waves 1–3.
Wave 5 – Peaked on 12 Sep 2025, completing at ~38.2% of the total length of Waves 1–3.
With the first impulse complete, the stock has likely entered a corrective phase. Fresh entries may be avoided until the correction settles.

XAUUSD/GOLD WEEKLY BUY PROJECTION 28.09.25XAUUSD/Gold Weekly Buy Projection (27.09.25). Here’s a breakdown of what it shows:
Current Price Level: Around 3,759.85.
Technical Zones Marked:
Broke the Uptrend Line (earlier support turned resistance).
Bearish Engulfing Failed (bullish strength seen).
Fair Value Gap (FVG) near 3,740–3,750 zone, acting as a demand zone.
Projection Path:
Price expected to bounce from the FVG/demand area.
Then follow an upward zigzag movement toward the target zone around 3,860.
Trend Channel:
Multiple parallel blue channels drawn indicate a bullish structure.
Projection suggests continuation of the uptrend.
Target Price:
Marked close to 3,860, aligning with the upper channel line.
🔑 Summary of Projection:
Bias: Bullish
Entry Zone: 3,740–3,760 (Fair Value Gap zone)
Target Zone: 3,860
Risk Area: If price breaks below 3,720, projection may fail.
👉 Do you want me to prepare a trading plan (entry, SL, TP, and risk %) based on this projection for you?

Elliott Wave Analysis XAUUSD – September 25, 2025
________________________________________
🔹 Momentum
• D1: Momentum on the daily chart has turned bearish, indicating that the main downtrend may continue.
• H4: Momentum on H4 is about to turn bullish, suggesting a possible upward move today. However, if this bullish reversal fails to break the previous high, the downtrend will remain intact.
• H1: Momentum on H1 is declining and about to enter the oversold zone. This downward move may need around 2 more H1 candles before entering oversold territory and reversing.
________________________________________
🔹 Wave Structure
• D1:
o The first target of wave 5 (yellow) was reached at 3789.
o Price is currently reacting at this level. With D1 momentum turning bearish, there is a strong possibility that wave 5 (yellow) has already completed, meaning price could move towards 3632 and potentially break below it.
• H4: An ABC corrective structure (blue) has formed, opening three scenarios:
1. The correction is complete → price rallies strongly, breaking the previous high to continue the uptrend.
2. Price rallies but with overlap, forming a Flat 3-3-5 pattern → price may rise toward the previous high at 3793.
3. Price remains in a zigzag structure → another decline may occur to complete wave C.
👉 Given the bearish momentum on D1, I lean more towards scenario 2 and 3.
👉 Note: In scenarios (1) and (2), price must hold above 3729, then break 3752, which could lead to a minimum rally towards 3777.
• H1: Under scenario 3 (further decline to complete wave C):
o Price may break below 3718.
o Wave 5 (black) targets:
3713 (first target).
3698 (second target).
________________________________________
🔹 Trade Plan
• Buy Zone 1: 3729 – 3726
o SL: 3717
o TP: 3751
• Buy Zone 2: 3714 – 3711
o SL: 3703
o TP: 3751
________________________________________
⚠️ Important Note
The market is likely in a corrective wave at a higher structure.
• Characteristic: Price often shows overlapping moves.
• Therefore: Manage trades carefully, avoid over-risking, as reversals can happen at any time – this is typical of corrective waves.

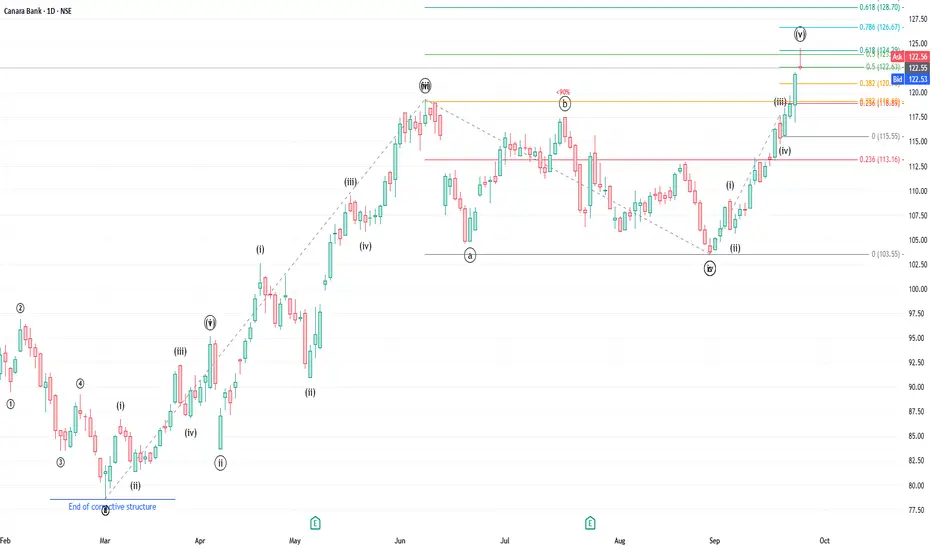
Canara Bank – Wave V Completed, Time to Exit
Canara Bank has been in a strong uptrend since 3 Mar 2025, forming a clear 5-wave impulse.
Wave 1 peaked on 3 Apr 2025, followed by a simple correction in Wave 2.
Wave 3 peaked on 9 Jun 2025 and extended to a little over 2x the length of Wave 1.
Wave 4 was a zigzag correction, in line with the principle of alternation.
Wave V most likely peaked today (24 Sep 2025) at about 50% of the total length of Wave 1–3.
Internal counts align well, with sub-wave (v) of Wave 5 ending at 61.8% of sub-waves (i)–(iii).
Recommendation : Wave V looks complete. Best to exit positions or use a strict trailing stop-loss.
Elliott Wave Analysis XAUUSD – September 23, 2025
Momentum
• D1: Momentum is in an uptrend, currently on the 3rd bullish candle of the cycle. This suggests we may see at least 2 more bullish daily candles from now.
• H4: Momentum has turned bearish, indicating the possibility of a corrective decline within today’s H4 structure.
• H1: Momentum has already turned bearish and is approaching oversold territory. This shows the current decline is weakening, and a short-term rebound is likely. However, if momentum turns back up and enters the overbought zone but fails to break the previous high, another bearish leg may follow.
________________________________________
Wave Structure
• D1: After completing wave 4 (yellow), price broke the previous high, confirming the continuation of the uptrend. Wave 5 (yellow) targets are projected at 3789.019 and 3887.117.
• H4: Wave 3 (yellow) has completed, followed by a corrective structure in a flat WXY pattern. Currently, price is rising steeply, suggesting wave 5 (yellow) is underway. With H4 momentum turning bearish, this pullback could correspond to wave 4 within the ongoing wave 5 (yellow).
• H1: Wave 3 (black) has formed with a complete 5-wave sequence (blue). Price is now in wave 4 (black), which could develop as a Zigzag, Flat, or Triangle correction.
Wave 4 (black) target zones:
1. 3729.447
2. 3709.732
3. 3696.422
Once H4 momentum turns bullish from the oversold region, the nearest level among these zones is the most likely end of wave 4.
________________________________________
Trading Plan
Buy limit strategy at support zones:
• Buy Zone 1: 3730 – 3727
o SL: 3719
o TP: 3760
• Buy Zone 2: 3710 – 3707
o SL: 3696
o TP: 3729
If price extends lower, additional buy opportunities can be considered around 3696 or deeper levels marked on the chart.
________________________________________
👉 The primary trend remains bullish, with wave 5 (yellow) in progress. The plan is to wait for wave 4 (black) to complete and then enter Buy positions in alignment with the larger uptrend.

Power Grid Corporation: Fibonacci Support Meets Trendline HurdleAfter months of consolidation, Power Grid Corp. finds itself at a decisive juncture. The stock has completed an expanded flat (3-3-5) correction from the highs of ₹362.50, ending at ₹247.30. From there, price staged a clear 5-wave impulse up to ₹322.00 — marked here as Wave 1/A .
The subsequent decline has been corrective in nature, unfolding as a W-X-Y double zigzag that retraced precisely to the 0.618 Fibonacci level at ₹272.25 , with RSI oversold at the same point. This makes a strong case for Wave 2/B being in place .
Currently, price is consolidating just below a long-standing trendline resistance . The technical map is straightforward:
Bullish Case
A convincing breakout above the trendline would confirm that Wave 2/B has ended at ₹272.25.
That would open the door for a powerful Wave 3/C advance , with momentum likely to accelerate beyond ₹301.35 and eventually challenge the prior high of ₹322.00.
Risk to the View
Until the breakout is confirmed, risks remain. Failure to clear resistance keeps the door open for further choppiness, and only a decisive drop below ₹272.25 would suggest a deeper retest toward ₹247.30.
In short: Power Grid is compressing between Fibonacci support and trendline resistance. A breakout here could ignite the next major trending move.
Disclaimer: This analysis is for educational purposes only and does not constitute investment advice. Please do your own research (DYOR) before making any trading decisions.

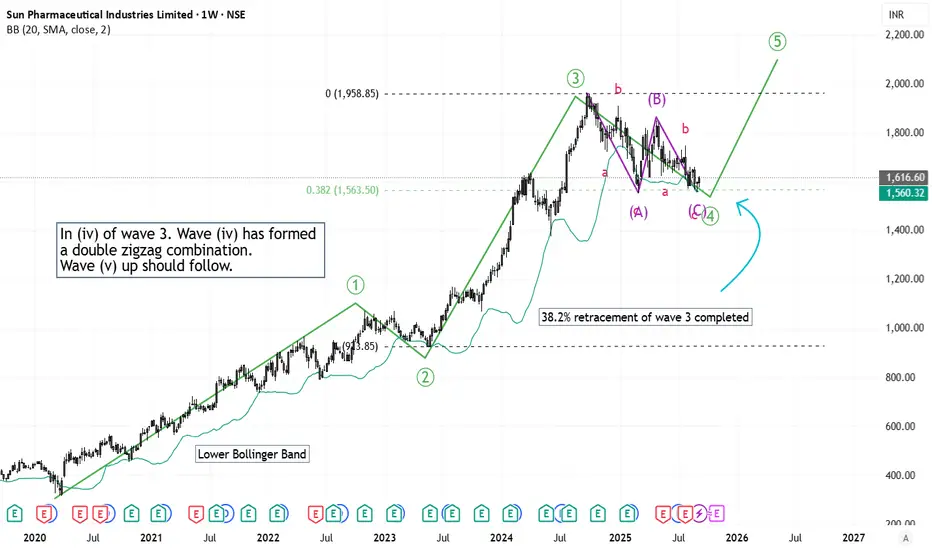
Elliott Wave Analysis of SUNPHARMAIn (iv) of wave 3. Wave (iv) has formed a double zigzag combination retracement pattern. The 38.2% retracement level has been completed. The script is bullish now for many months, upto a year or so.
Elliott Wave Analysis XAUUSD – September 10, 2025🌀
🔹 Momentum
• D1 timeframe: Momentum is showing signs of a bearish reversal → the market may enter a corrective decline, possibly lasting through the end of this week.
• H4 timeframe: Momentum is turning upward → a short-term recovery could appear today, pushing the indicator into the overbought zone.
• H1 timeframe: Momentum is already in the overbought area and turning down → a short-term decline is likely.
________________________________________
🔹 Wave Structure
• D1: Price has reached the projected target of wave iii (black). With D1 momentum reversing downward, wave iv (black) may be forming. Since wave ii (black) was relatively long, there is a possibility that wave iv (black) could unfold more quickly.
• H4: Yesterday’s decline may suggest that wave v (purple) has temporarily completed. If this scenario plays out, price could move into a corrective phase toward the wave iv target area. The correction may develop as a Zigzag, Flat, or Triangle.
• H1: Price is consolidating within the liquidity zone 3657 – 3631. With H4 momentum hinting at correction, one possible scenario is sideways movement here to complete wave B, followed by a decline into wave C.
o If price breaks and closes below 3631 → the liquidity zone at 3595 may act as the next support.
o Potential targets for wave C:
3595 (aligned with 23.8% Fibonacci retracement).
Or 3556 – 3528 (aligned with 38.2% Fibonacci retracement).
________________________________________
🔹 Trade Scenarios (for reference only)
• Sell Zone: 3657 – 3659
o SL: 3667
o TP1: 3631
o TP2: 3563
• Buy Zone 1: 3596 – 3594
o SL: 3585
o TP1: 3669
o TP2: 3749
• Buy Zone 2: 3557 – 3555
o SL: 3547
o TP1: 3597
o TP2: 3705
📌 Note: The Sell setup at 3657 should be considered with small position size as it goes against the main trend. If price reaches 3595, this Sell scenario could lose validity.

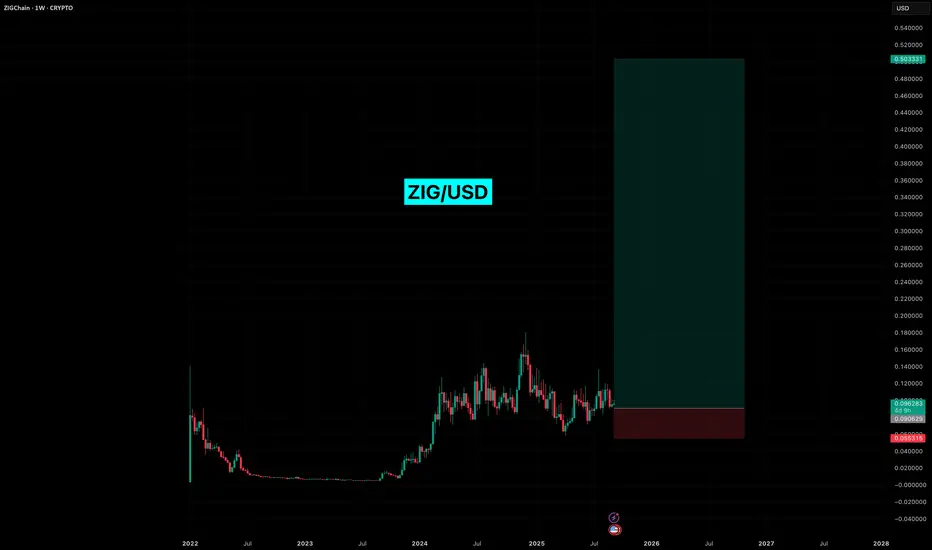
ZIG Getting Ready For The Blast!ZIG coin has proven extreme resilience since its launch and with its new partnership announcement with APEX Global Group, which is one of the largest asset management firms with over $3.4 Trillion USD, this beast is just getting started.
Buying a decent bag here for 1 to 2 years hold.
ENJOY and dont forget to thank me later.
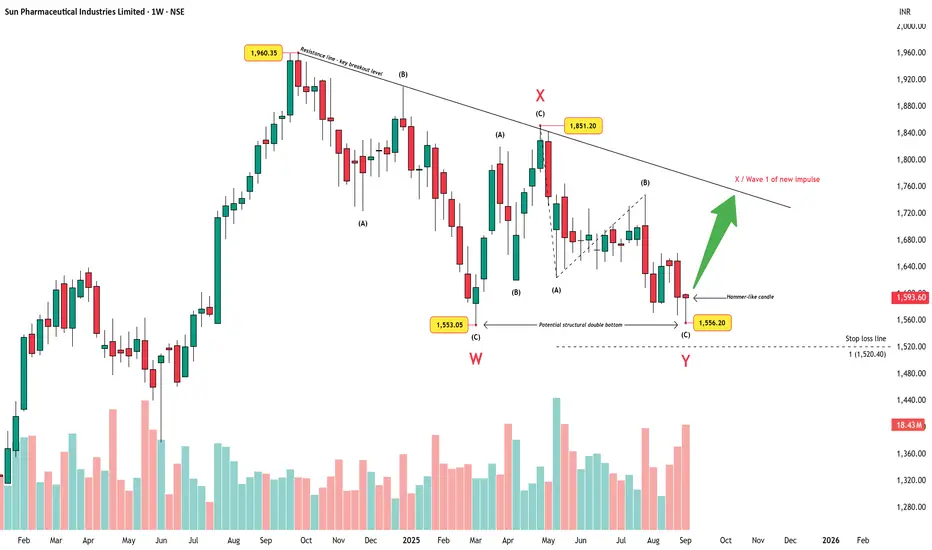
Sun Pharma – Double Bottom and Trendline Test AheadChart Summary
Sun Pharma’s weekly chart shows a completed W–X–Y corrective structure. Wave W bottomed near ₹1,553.05, followed by a corrective X at ₹1,851.20, and Wave Y terminating at ₹1,556.20. This final Y-leg has unfolded as an abc zigzag, respecting the larger corrective framework.
Price Action Highlights
A potential structural double bottom has formed around the ₹1,553–₹1,556 zone, hinting at possible exhaustion of the correction.
The latest candle is a hammer-like bar, suggesting demand stepped in around support levels.
Overhead, a major downtrend resistance line connecting the highs (₹1,960.35) to the swing X (₹1,851.20) remains the decisive breakout level.
A clear stop-loss line sits near ₹1,520.40, aligned with the 100% extension of Wave A inside Y. A break below this level invalidates the bullish case.
Volume Perspective
Recent selling has come with a volume spike, often seen during exhausation selling phases. If volume eases on follow-up candles while price holds above the support zone, it strengthens the case for a reversal.
Outlook
If price can sustain above the ₹1,553–₹1,556 support cluster and eventually break the trendline resistance, it may confirm the end of the corrective phase and open the door for a new impulsive sequence higher. Failure to hold the stop-loss zone, however, would negate this view and suggest further downside.
Disclaimer: This analysis is for educational purposes only and does not constitute investment advice. Please do your own research (DYOR) before making any trading decisions.
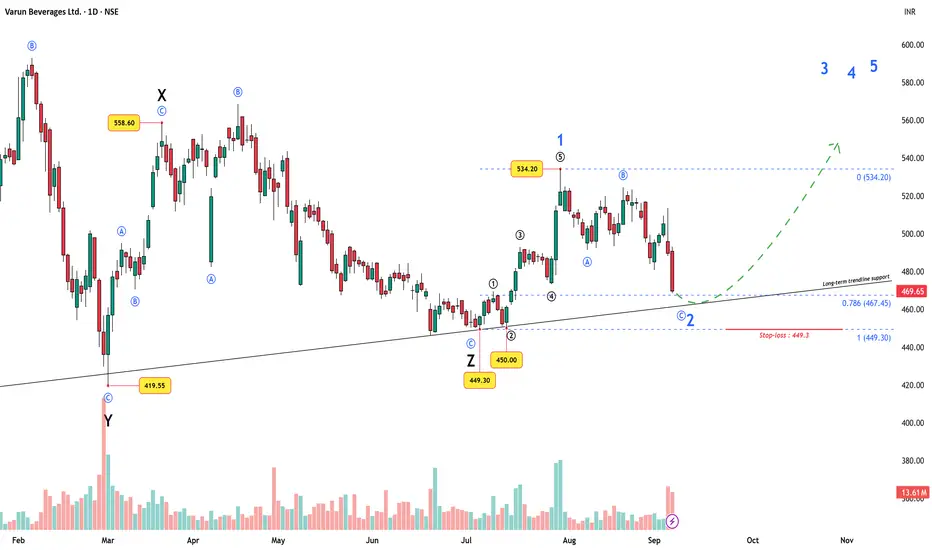
Varun Beverages Ltd – Wave 2 Setup at Trendline SupportVarun Beverages Ltd. (VBL), PepsiCo’s second-largest global bottling partner, has been through a long and exhausting corrective phase. On the Elliott Wave chart, this stretched out as a W–X–Y–X–Z sequence, finally bottoming out at ₹449.3 .
On the current chart you may not clearly see the entire W–X–Y–X–Z sequence, as it plays out on a slightly smaller scale — but it has been marked.
From that final low of ₹449.3, price started a fresh impulse :
Wave 1 up, then a tiny Wave 2 ending at ₹450 (just above the start of Wave 1).
A smooth, non-overlapping Wave 3, 4, and 5 followed, with Wave 5 topping at ₹534.20.
This whole structure completes a higher-degree Wave 1 .
The current decline from ₹534.20 is unfolding as a classic ABC zigzag , which fits perfectly as a Wave 2 correction .
Why this zone matters
Fibonacci retracement: Price is now testing the 0.786 retrace of the entire rally (449.3 → 534.2).
Trendline support: Aligns with a long-term rising trendline.
Invalidation: As per Elliott rules, Wave 2 cannot break below 449.3 (start of Wave 1). That level is the final stop-loss.
Trading roadmap
Entry Zone: Around 467–470 (Fib + trendline confluence).
Stop-loss: 449.3 (Wave 1 origin).
Targets: A move above 534.20 would confirm Wave 3 is in progress, with further Wave 4 and Wave 5 projections to be plotted as price action evolves.
This makes the setup very attractive from a risk–reward perspective : a tight stop vs. potentially large upside.
Fundamentals lining up
VBL just incorporated its joint venture with White Peak Refrigeration Pvt. Ltd . for visi-coolers and refrigeration equipment.
Q2 CY2025: despite a 3% volume dip, revenue grew 2.5% and net profit rose 5% , aided by efficiencies and lower finance costs.
International volumes (esp. South Africa, +16%) remain strong.
So, while the chart points to a possible Wave 2 bottom , the fundamentals also provide support.
(Source: in.tradingview.com)
Conclusion
If support holds at current levels, Varun Beverages could be setting up for a strong Wave 3 rally . If ₹449.3 is breached , the bullish impulse count is invalid and the structure must be re-evaluated.
Disclaimer: This analysis is for educational purposes only and does not constitute investment advice. Please do your own research (DYOR) before making any trading decisions.
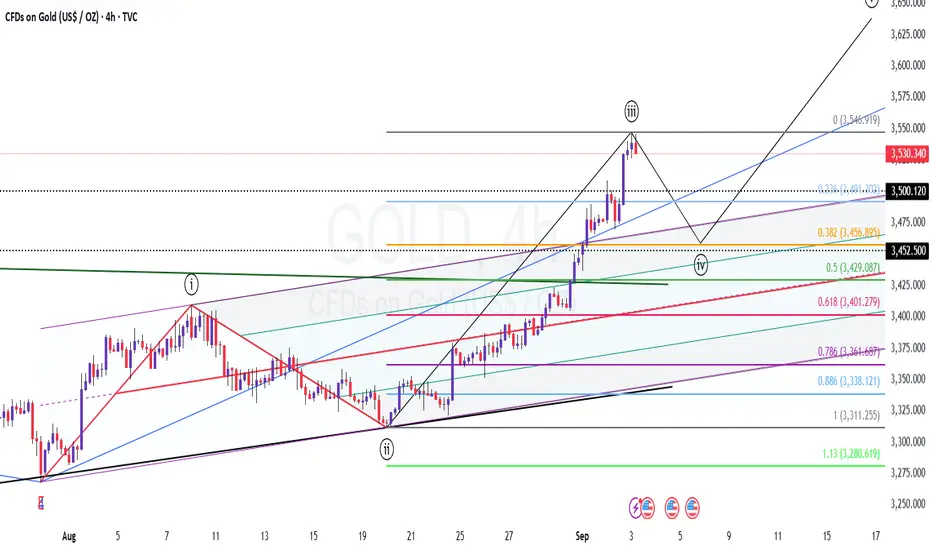
Gold - correction in 4th waveCMP: 3530
TF: 4 Hours
Dont jump to buy at this price.. Ideally the price should move below 3500 to complete the 4th wave correction..
EW counts and Pitchfork set ups are marked for the possible target location
Remember, this fall will be zigzag or complex.. so whipsaws can be seen often.
Sharing this to time your entry for LONG.. Dont short just because it is heading lower..
One can wait and ride the 5th wave up.. Mostly euphoric..
Disclaimer: I am not a SEBI registered Analyst and this is not a trading advise. Views are personal and for educational purpose only. Please consult your Financial Advisor for any investment decisions. Please consider my views only to get a different perspective (FOR or AGAINST your views). Please don't trade FNO based on my views. If you like my analysis and learnt something from it, please give a BOOST. Feel free to express your thoughts and questions in the comments section.
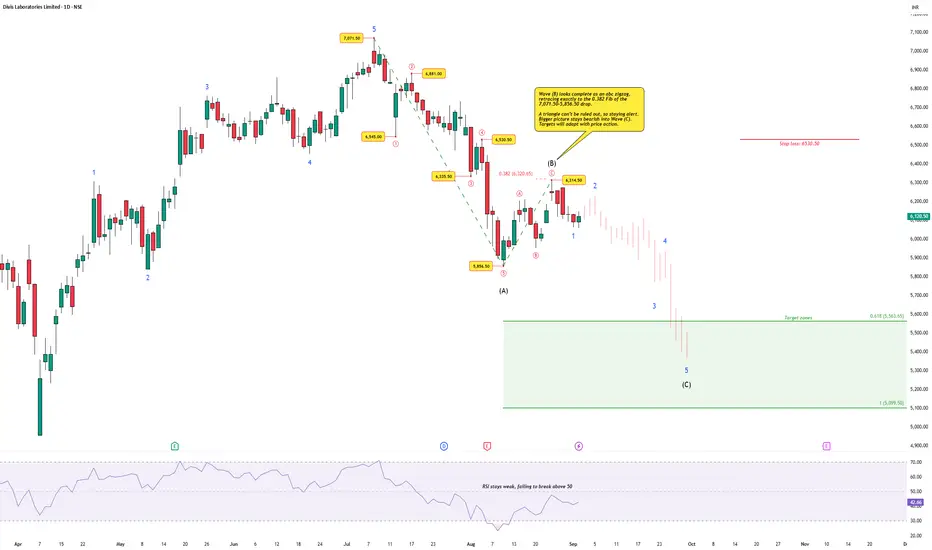
Divi’s Laboratories – Wave (C) Decline Targeting Lower ZonesWave Count
Divi’s Laboratories topped at ₹7,071.50, completing a 5-wave impulse.
From there, price declined in five clear waves into Wave (A) at ₹5,856.50.
The subsequent bounce unfolded as an abc zigzag, peaking at ₹6,314.50 — aligning perfectly with the 0.382 Fibonacci retracement of the 7,071.50–5,856.50 fall.
Wave (B) therefore looks complete, though the possibility of a triangle cannot be fully dismissed. The structure now favors a Wave (C) decline, unfolding in five waves toward lower zones.
Momentum
RSI stays weak, repeatedly failing to break above 50. This confirms lack of bullish strength and supports the bearish case.
Targets
Wave (C) is expected to stretch into the ₹5,563–₹5,100 zone, defined by the 0.618-1.00 extension and prior structural supports.
Trade Plan
Bias: Bearish until Wave (C) completes
Target zone: ₹5,563–₹5,100
Stop-loss / invalidation: Close above ₹6,350.50
Disclaimer: This analysis is for educational purposes only and does not constitute investment advice. Please do your own research (DYOR) before making any trading decisions.
Elliott Wave Analysis – XAUUSD (01/09/2025)
Momentum
• D1 timeframe: Momentum has been stuck in the overbought zone for the past 4 days, showing strong buying pressure. However, this also creates noise since extended overbought conditions can reverse at any time.
• H4 timeframe: Momentum is about to turn down in the overbought zone. Once an H4 candle closes with confirmation, we can expect a correction lasting around 4–5 H4 candles.
• H1 timeframe: Momentum is heading into the overbought zone. Within 1–2 more H1 candles, a short-term pullback is likely.
________________________________________
Wave Structure
• D1 timeframe:
Price has risen sharply and steeply, with momentum staying overbought for a long time. This suggests that wave 4 has likely completed, and the market is entering a long-term uptrend. The minimum target is 3684 (equal to the length of wave W).
• H4 timeframe:
Price is currently in red wave 3. We expect a correction into red wave 4, which aligns with H4 momentum preparing to turn down.
• H1 timeframe:
o Wave i (green) is labeled as a leading diagonal, even though wave ii (green) did not retrace as deeply as expected.
o Price is now in an extended wave iii (green).
o Within wave iii (green), a 5-wave structure 1-2-3-4-5 (red) is unfolding. Red wave 3 has already completed with its internal 5-wave (black).
o The target for black wave 5 was achieved at the Fibonacci 0.618 projection of black waves 1–3 → confirming that red wave 3 has completed and price is now correcting into red wave 4.
• Red wave 4 outlook:
Likely to take shape as a zigzag, flat, or triangle. Two retracement zones are identified:
1. 3462 – 23.6% retracement of red wave 3.
2. 3447 – 38.2% retracement of red wave 3.
Considering the guideline that wave 4 often returns to the territory of wave 4 of a smaller degree, and that H4 momentum needs more time to move into the oversold zone, we select 3447 as the primary target for a sell setup.
________________________________________
Trade Plan
• Buy Zone: 3448 – 3446
• Stop Loss: 3438
• Take Profit:
o TP1: 3485
o TP2: 3521

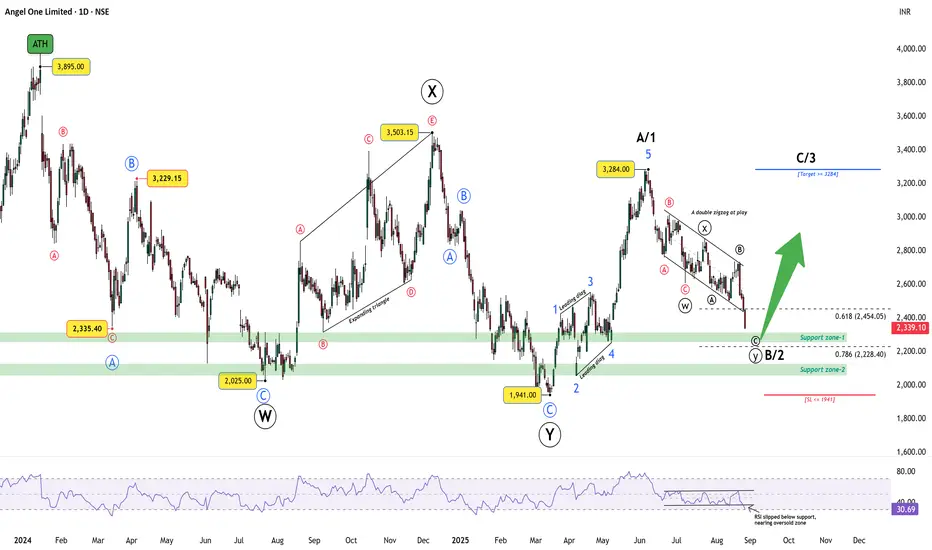
Angel One: Corrective pattern aligning for bounceAngel One topped at an all-time high of 3895 before entering a corrective phase. The decline into 2025 marked Wave W, followed by a rally into 3503 as Wave X, and then a fall to 1941 completing Wave Y. From there, the stock advanced to 3284, counted as Wave A/1 with a leading diagonal.
The decline since 3284 has unfolded as a double zigzag (W–X–Y) within a parallel bearish channel. Wave Y is testing key supports at 2454 (0.618 Fib) and 2228 (0.786 Fib). RSI is near the oversold band around 30, setting up the possibility of bullish divergence if price makes a marginal new low. The bullish view remains valid above 1941; a close below this level invalidates the count.
Trade Plan:
Bias: Expecting Wave B/2 to complete around 2228
Trigger: Watch for bullish divergence or reversal candles near support
Target: A break above 3284 would confirm Wave C/3
Risk: Stop loss at 1941
Disclaimer: This analysis is for educational purposes only and does not constitute investment advice. Please do your own research (DYOR) before making any trading decisions.
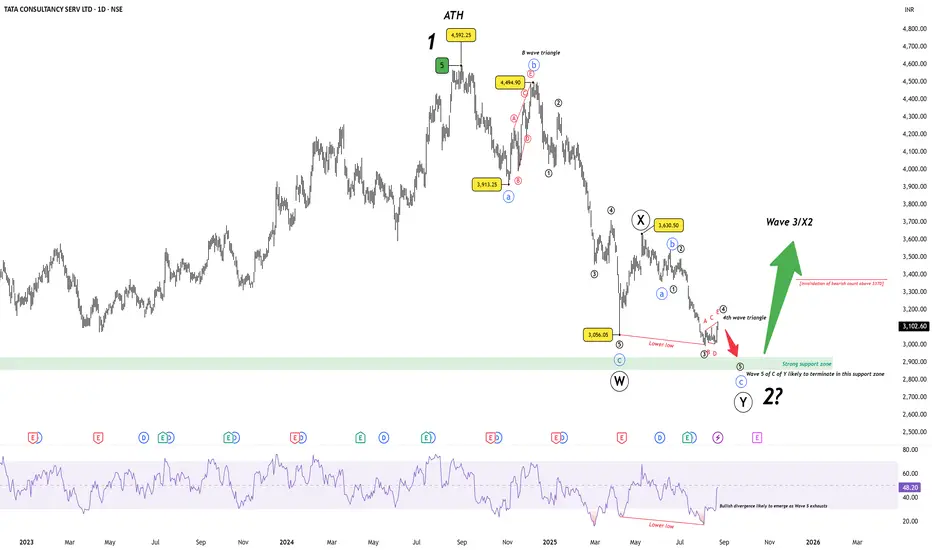
TCS – Wave 2 Correction Nearing Completion?TCS has been in a prolonged corrective phase since the all-time high at ₹4592. The decline has unfolded best as a W–X–Y double zigzag, with the current leg (Wave Y) progressing into its final stages.
Wave W ended at ₹3056 after a sharp A–B–C decline.
Wave X retraced to ₹3630.
Wave Y is in progress, and its C leg appears close to exhaustion. A mini 4th-wave triangle has developed, suggesting a final push lower remains.
The termination zone for Wave 2 is highlighted between ₹2926–₹2850, aligning with the prior Wave 4 support zone. Importantly, bullish divergence is likely to emerge on RSI if price makes a marginal new low.
Key Levels:
Support zone : 2926–2850 (probable Wave 2 low).
Bearish invalidation : A sustained move above 3370 would invalidate the immediate bearish count.
Bigger picture : If this structure holds, it would complete Wave 2 of a higher degree, setting the stage for a powerful Wave 3 rally ahead.
Disclaimer: This analysis is for educational purposes only and does not constitute investment advice. Please do your own research (DYOR) before making any trading decisions.
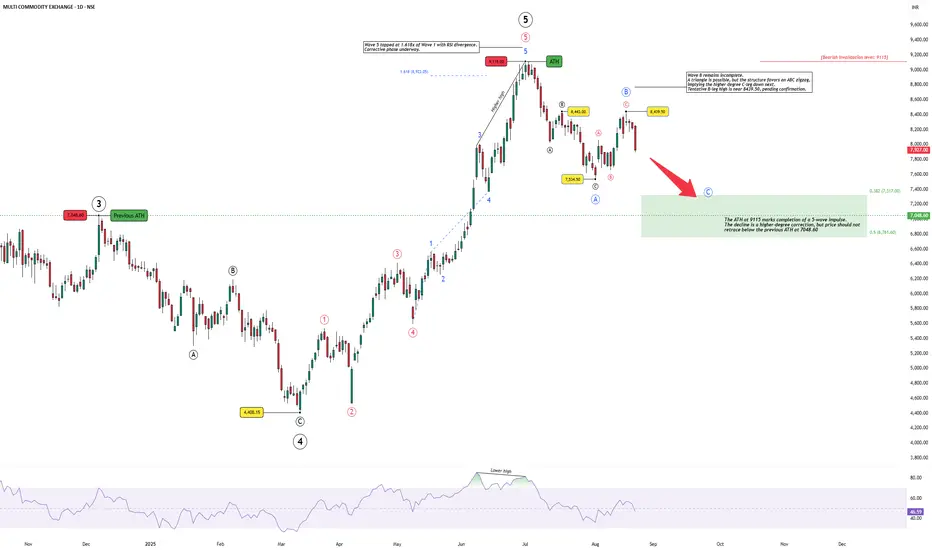
MCX: A Higher-Degree Correction Begins After Wave 5 TopThe rally in MCX reached its climax at 9115, which now marks the completion of a full 5-wave impulse sequence. Wave 5 stretched to 1.618x of Wave 1 and was accompanied by RSI divergence, a classic signal of exhaustion. This makes the top at 9115 significant, not just as an all-time high, but as the end of a higher-degree cycle.
From here, the market is unfolding into a higher-degree corrective phase. The immediate decline from the top appears corrective in nature, with an incomplete Wave B still in progress. While a triangle remains a possibility, the structure currently favors a simple ABC zigzag, implying that a C-leg down may follow.
The important level to watch is 7048.60, the previous ATH. Price should ideally hold above this zone to preserve the broader impulsive character of the rally. A sustained move below it would weaken the bullish outlook and raise the risk of a deeper correction.
At the same time, 9115 now serves as the bearish invalidation level. If price were to break above this peak, it would negate the current corrective view and open the possibility of a new bullish sequence unfolding.
In summary, the long-term uptrend has reached a natural pause. The near-term focus will be on how the correction develops — whether 7048.60 can provide support or whether the corrective leg extends deeper, with 9115 acting as the critical line in the sand for bearish continuation.
Disclaimer: This analysis is for educational purposes only and does not constitute investment advice. Please do your own research (DYOR) before making any trading decisions.
Elliott Wave Analysis – XAUUSD (21/8/2025)
1. Momentum
• D1 timeframe: Yesterday’s daily candle closed bullish, confirming upward momentum. This suggests that the dominant trend could remain bullish for the next 4–5 days.
• H4 timeframe: Currently in a corrective move with only 2 bearish candles formed so far. This decline may need another 2–3 candles to complete. A potential bullish reversal could occur during the US session tonight.
• H1 timeframe: Momentum is turning bullish, signaling a short-term upward move. However, since H4 is still in a corrective phase, it is better to observe for now rather than take immediate action.
2. Wave Structure
• D1 timeframe:
With the bullish confirmation on D1, the corrective a–b–c–d–e triangle scenario remains valid. At present, the market is forming wave 1 and wave 2 in blue. This view will be further confirmed once price breaks above the top of wave 1 (blue).
• H4 timeframe:
Previously, I anticipated a possible ending diagonal for wave C in purple. However, with yesterday’s strong rally and the bullish confirmation on D1, the updated structure is more consistent with:
o Wave B (purple) forming a triangle.
o Wave C (purple) already completed.
This suggests the market has entered wave 1 (yellow) and we are now waiting for wave 2 (yellow) to complete in order to look for buy opportunities.
If price drops below 3314, the extended scenario remains valid with a target around 3298. But since D1 momentum supports the bullish case, I will prioritize the bullish scenario for trading.
• H1 timeframe:
H1 momentum indicates a possible pullback. Typically, wave 2 forms as a zigzag or flat correction, retracing to the Fibonacci levels of 0.5 – 0.618 – 0.782.
I believe wave 1 (yellow) may already be complete. However, if H1 momentum continues to push higher, price could reach around 3362 before finalizing wave 1. In that case, traders can use Fibonacci retracement levels to identify entry points for a buy on wave 2.
Potential retracement zones for wave 2: 3333 – 3327 – 3315.
3. Trading Plan
• Buy Zone: 3333 – 3330
• Stop Loss: 3323
• Take Profit 1: 3350
• Take Profit 2: 3381
• Take Profit 3: 3409

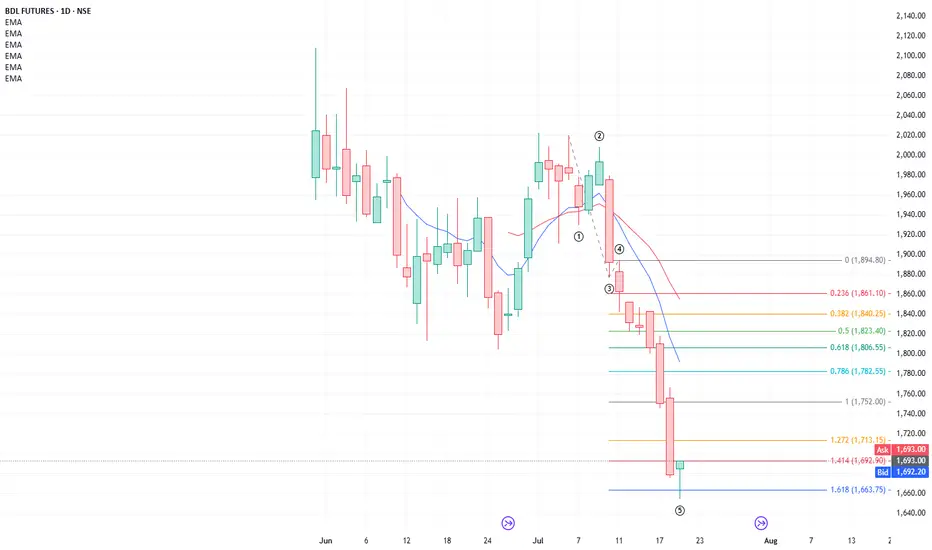
Buy Bharat Dynamics
Bharat Dynamics has been undergoing correction in the form of a zigzag (originally considered as a flat). The stock has completed wave C as a 5th wave extension at 1.618x of wave 0-3 to 4 as given in the charts. Go long on BDL with a target of last high.
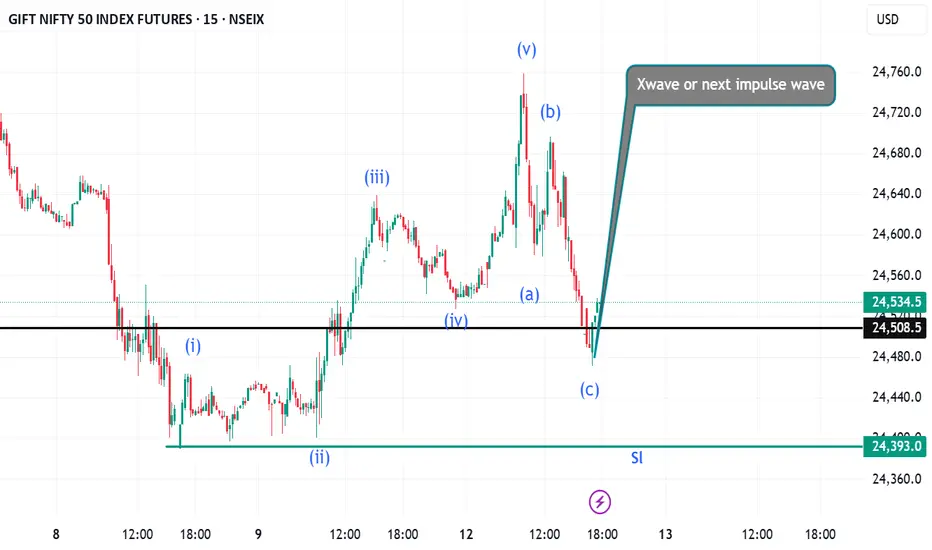
Gift Nifty Future 15 min time frame wave analysisGift nifty future 15 min chart wave analysis
In our nifty future chart a new piece has developed in a motive wave. This is the nature of impulse wave which has 5 waves. After that abc zigzag correction has happened. Therefore the next impulse wave anticipate. If a complex correction is formed then x wave will be formed.
Thank you
Disclaimer
I am not SEBI registered financial adviser, it is my personal research and posted for only educational purpose. Before taking any trade or investments please take advice from your financial adviser.
MKT Learner