BANKNIFTY: A LEADING DIAGONALTheory:
DIAGONAL:
Diagonal are the motive waves like an impulse wave, but diagonals are different from impulse wave in that they do follow the first two Sutras (rules of impulse wave) of Elliott Wave analysis, but they may or may not follow the third one i.e. Wave 4 should not intervene the territory of the wave 1. In a diagonal wave 4 almost all the time enters into the price territory of the wave 1.
Properties Of Diagonals:
Diagonals can be contracting or expanding type being expanding diagonal a rare one.
In contracting type, wave 3 is shorter than wave 1, wave 5 is shorter than wave 3, and wave 4 is shorter than wave 2.
In expanding type, wave 3 is longer than wave 1, wave 5 is longer than wave 3, and wave 4 is longer than wave 2.
Types Of Diagonals:
LEADING DIAGONAL
ENDING DIAGONAL
LEADING DIAGONAL: In a leading diagonal , waves 1,3, and 5 are all impulsive in nature or all in corrective form of zigzags. Wave 2 and wave 4 are always present in a zigzag form. A leading diagonal suggests the starting of a new wave & that is why it can develop wave 1 of a impulse wave and a first wave of a zigzag pattern.
ENDING DIAGONAL : This is the most common diagonal that can be found out at the ending of a main trend or main correction. It consists of all the waves 1-2-3-4-5 in a single or multiple zigzags. They can be found placed at 5th wave of an impulse wave or can been seen as a wave ‘C’ of a corrective waves zigzags or flat.
After the termination of the diagonal , a swift & a sharp reversal takes place which bring the prices back to the level from where the diagonal has began. (generally it retrace back to the wave-2 of the diagonal structure)
TRADING STRATEGY:
Sell BANKNIFTY 41150-41300 SL: 42100 and look for the downside target of 39700/38700/37700
Search in ideas for "zigzag"

ULTRATECH CEMENT: A LEADING DIAGONALTheory:
DIAGONAL:
Diagonal are the motive waves like an impulse wave, but diagonals are different from impulse wave in that they do follow the first two Sutras (rules of impulse wave) for wave analysis, but it does not follow the third one i.e. Wave 4 should not intervene the territory of the wave 1. In a diagonal wave 4 always enters into the price territory of the wave 1.
Properties Of Diagonals:
Diagonals can be contracting or expanding type being expanding diagonal a rare one.
In contracting type, wave 3 is shorter than wave 1, wave 5 is shorter than wave 3, and wave 4 is shorter than wave 2.
In expanding type, wave 3 is longer than wave 1, wave 5 is longer than wave 3, and wave 4 is longer than wave 2.
Types Of Diagonals:
LEADING DIAGONAL
ENDING DIAGONAL
LEADING DIAGONAL: In a leading diagonal , waves 1,3, and 5 are all impulsive in nature or all in corrective form of zigzags. Wave 2 and wave 4 are always present in a zigzag form. A leading diagonal suggests the starting of a new wave & that is why it can develop wave 1 of a impulse wave and a first wave of a zigzag pattern.
ENDING DIAGONAL : This is the most common diagonal that can be found out at the ending of a main trend or main correction. It consists of all the waves 1-2-3-4-5 in a single or multiple zigzags. They can be found placed at 5th wave of an impulse wave or can been seen as a wave ‘C’ of a corrective waves zigzags or flat. After the termination of the ending diagonal , a swift & a sharp reversal takes place which bring the prices back to the level from where the diagonal began.
TRADING STRATEGY:
Plan A: Buy with SL of 7147 and look for the upside target of 7600/7800
Plan B : Sell in the region of 7800-7900 keeping SL of 8150 and look for the downside targets of 7050/6600/6400

GBPUSD: Ending DiagonalTheory:
DIAGONAL:
Diagonal are the motive waves like an impulse wave, but diagonals are different from impulse wave in that they do follow the first two Sutras (rules of impulse wave) for wave analysis, but it does not follow the third one i.e. Wave 4 should not intervene the territory of the wave 1. In a diagonal wave 4 always enters into the price territory of the wave 1.
Properties Of Diagonals:
Diagonals can be contracting or expanding type being expanding diagonal a rare one.
In contracting type, wave 3 is shorter than wave 1, wave 5 is shorter than wave 3, and wave 4 is shorter than wave 2.
In expanding type, wave 3 is longer than wave 1, wave 5 is longer than wave 3, and wave 4 is longer than wave 2.
Types Of Diagonals:
LEADING DIAGONAL
ENDING DIAGONAL
LEADING DIAGONAL: In a leading diagonal , waves 1,3, and 5 are all impulsive in nature or all in corrective form of zigzags. Wave 2 and wave 4 are always present in a zigzag form. A leading diagonal suggests the starting of a new wave & that is why it can develop wave 1 of a impulse wave and a first wave of a zigzag pattern.
ENDING DIAGONAL : This is the most common diagonal that can be found out at the ending of a main trend or main correction. It consists of all the waves 1-2-3-4-5 in a single or multiple zigzags. They can be found placed at 5th wave of an impulse wave or can been seen as a wave ‘C’ of a corrective waves zigzags or flat.
After the termination of the diagonal , a swift & a sharp reversal takes place which bring the prices back to the level from where the diagonal has began. (generally it retrace back to the wave-2 of the diagonal structure)
TRADING STRATEGY:
Buy GBPUSD with SL of 1.1590 and look for the upside target of 1.1760 and 1.1800

EURCHF: ENDING DIAGONALTheory:
DIAGONAL:
Diagonal are the motive waves like an impulse wave, but diagonals are different from impulse wave in that they do follow the first two Sutras (rules of impulse wave) for wave analysis, but it does not follow the third one i.e. Wave 4 should not intervene the territory of the wave 1. In a diagonal wave 4 always enters into the price territory of the wave 1.
Properties Of Diagonals:
Diagonals can be contracting or expanding type being expanding diagonal a rare one.
In contracting type, wave 3 is shorter than wave 1, wave 5 is shorter than wave 3, and wave 4 is shorter than wave 2.
In expanding type, wave 3 is longer than wave 1, wave 5 is longer than wave 3, and wave 4 is longer than wave 2.
Types Of Diagonals:
LEADING DIAGONAL
ENDING DIAGONAL
LEADING DIAGONAL: In a leading diagonal , waves 1,3, and 5 are all impulsive in nature or all in corrective form of zigzags. Wave 2 and wave 4 are always present in a zigzag form. A leading diagonal suggests the starting of a new wave & that is why it can develop wave 1 of a impulse wave and a first wave of a zigzag pattern.
ENDING DIAGONAL : This is the most common diagonal that can be found out at the ending of a main trend or main correction. It consists of all the waves 1-2-3-4-5 in a single or multiple zigzags. They can be found placed at 5th wave of an impulse wave or can been seen as a wave ‘C’ of a corrective waves zigzags or flat.
After the termination of the diagonal , a swift & a sharp reversal takes place which bring the prices back to the level from where the diagonal has began. (generally it retrace back to the wave-2 of the diagonal sturcuture)
TRADING STRATEGY:
Buy EURCHF with SL of 0.955 and look for the upside target OF 0.9800

IRCTC: Case of ENDING DIAGONALTheory:
DIAGONAL:
Diagonal are the motive waves like an impulse wave, but diagonals are different from impulse wave in that they do follow the first two Sutras (rules of impulse wave) for wave analysis, but it does not follow the third one i.e. Wave 4 should not intervene the territory of the wave 1. In a diagonal wave 4 always enters into the price territory of the wave 1.
Properties Of Diagonals:
Diagonals can be contracting or expanding type being expanding diagonal a rare one.
In contracting type, wave 3 is shorter than wave 1, wave 5 is shorter than wave 3, and wave 4 is shorter than wave 2.
In expanding type, wave 3 is longer than wave 1, wave 5 is longer than wave 3, and wave 4 is longer than wave 2.
Types Of Diagonals:
LEADING DIAGONAL
ENDING DIAGONAL
LEADING DIAGONAL: In a leading diagonal , waves 1,3, and 5 are all impulsive in nature or all in corrective form of zigzags. Wave 2 and wave 4 are always present in a zigzag form. A leading diagonal suggests the starting of a new wave & that is why it can develop wave 1 of a impulse wave and a first wave of a zigzag pattern.
ENDING DIAGONAL : This is the most common diagonal that can be found out at the ending of a main trend or main correction. It consists of all the waves 1-2-3-4-5 in a single or multiple zigzags. They can be found placed at 5th wave of an impulse wave or can been seen as a wave ‘C’ of a corrective waves zigzags or flat.
After the termination of the diagonal , a swift & a sharp reversal takes place which bring the prices back to the level from where the diagonal has began. (generally it retrace back to the wave-2 of the diagonal sturcuture)
TRADING STRATEGY:
Buy IRCTC with SL of 557 and look for the upside targets of 700-710

AUDUSD:CASE OF ENDING DIAGONAL Theory:
DIAGONAL:
Diagonal are the motive waves like an impulse wave, but diagonals are different from impulse wave in that they do follow the first two Sutras (rules of impulse wave) for wave analysis, but it does not follow the third one i.e. Wave 4 should not intervene the territory of the wave 1. In a diagonal wave 4 always enters into the price territory of the wave 1.
Properties Of Diagonals:
Diagonals can be contracting or expanding type being expanding diagonal a rare one.
In contracting type, wave 3 is shorter than wave 1, wave 5 is shorter than wave 3, and wave 4 is shorter than wave 2.
In expanding type, wave 3 is longer than wave 1, wave 5 is longer than wave 3, and wave 4 is longer than wave 2.
Types Of Diagonals:
LEADING DIAGONAL
ENDING DIAGONAL
LEADING DIAGONAL: In a leading diagonal , waves 1,3, and 5 are all impulsive in nature or all in corrective form of zigzags. Wave 2 and wave 4 are always present in a zigzag form. A leading diagonal suggests the starting of a new wave & that is why it can develop wave 1 of a impulse wave and a first wave of a zigzag pattern.
ENDING DIAGONAL : This is the most common diagonal that can be found out at the ending of a main trend or main correction. It consists of all the waves 1-2-3-4-5 in a single or multiple zigzags. They can be found placed at 5th wave of an impulse wave or can been seen as a wave ‘C’ of a corrective waves zigzags or flat. After the termination of the ending diagonal , a swift & a sharp reversal takes place which bring the prices back to the level from where the diagonal began.
TRADING STRATEGY:
Buy AUDUSD with SL of 0.66800 (clbs) and look for the upside targets of 0.7000/ 0.71000/ 0.71800

USDJPY: A DIAGONALTheory:
DIAGONAL:
Diagonal are the motive waves like an impulse wave, but diagonals are different from impulse wave in that they do follow the first two Sutras (rules of impulse wave) for wave analysis, but it does not follow the third one i.e. Wave 4 should not intervene the territory of the wave 1. In a diagonal wave 4 always enters into the price territory of the wave 1.
Properties Of Diagonals:
Diagonals can be contracting or expanding type being expanding diagonal a rare one.
In contracting type, wave 3 is shorter than wave 1, wave 5 is shorter than wave 3, and wave 4 is shorter than wave 2.
In expanding type, wave 3 is longer than wave 1, wave 5 is longer than wave 3, and wave 4 is longer than wave 2.
Types Of Diagonals:
LEADING DIAGONAL
ENDING DIAGONAL
LEADING DIAGONAL: In a leading diagonal , waves 1,3, and 5 are all impulsive in nature or all in corrective form of zigzags. Wave 2 and wave 4 are always present in a zigzag form. A leading diagonal suggests the starting of a new wave & that is why it can develop wave 1 of a impulse wave and a first wave of a zigzag pattern.
ENDING DIAGONAL : This is the most common diagonal that can be found out at the ending of a main trend or main correction. It consists of all the waves 1-2-3-4-5 in a single or multiple zigzags. They can be found placed at 5th wave of an impulse wave or can been seen as a wave ‘C’ of a corrective waves zigzags or flat. After the termination of the ending diagonal , a swift & a sharp reversal takes place which bring the prices back to the level from where the diagonal began.

GAIL : Leading DiagonalTRADING STRATEGY: Sell on rise keeping SL of 174 and look for the target of 145 zone in coming trading sessions
Theory:
DIAGONAL:
Diagonal are the motive waves like an impulse wave, but diagonals are different from impulse wave in that they do follow the first two Sutras (rules of impulse wave) for wave analysis, but it does not follow the third one i.e. Wave 4 should not intervene the territory of the wave 1. In a diagonal wave 4 always enters into the price territory of the wave 1.
Properties Of Diagonals:
Diagonals can be contracting or expanding type being expanding diagonal a rare one.
In contracting type, wave 3 is shorter than wave 1, wave 5 is shorter than wave 3, and wave 4 is shorter than wave 2.
In expanding type, wave 3 is longer than wave 1, wave 5 is longer than wave 3, and wave 4 is longer than wave 2.
Types Of Diagonals:
LEADING DIAGONAL
ENDING DIAGONAL
LEADING DIAGONAL: In a leading diagonal , waves 1,3, and 5 are all impulsive in nature or all in corrective form of zigzags. Wave 2 and wave 4 are always present in a zigzag form. A leading diagonal suggests the starting of a new wave & that is why it can develop wave 1 of a impulse wave and a first wave of a zigzag pattern.
ENDING DIAGONAL : This is the most common diagonal that can be found out at the ending of a main trend or main correction. It consists of all the waves 1-2-3-4-5 in a single or multiple zigzags. They can be found placed at 5th wave of an impulse wave or can been seen as a wave ‘C’ of a corrective waves zigzags or flat. After the termination of the ending diagonal , a swift & a sharp reversal takes place which bring the prices back to the level from where the diagonal beagan.

TORRENT PHARMA: Its a DIAGONALTRADING STRATEGY: Sell on rise keeping SL of 3230 and look for the target of 2530/2350 in coming weeks.
Theory:
DIAGONAL:
Diagonal are the motive waves like an impulse wave, but diagonals are different from impulse wave in that they do follow the first two Sutras (rules of impulse wave) for wave analysis, but it does not follow the third one i.e. Wave 4 should not intervene the territory of the wave 1. In a diagonal wave 4 always enters into the price territory of the wave 1.
Properties Of Diagonals:
Diagonals can be contracting or expanding type being expanding diagonal a rare one.
In contracting type, wave 3 is shorter than wave 1, wave 5 is shorter than wave 3, and wave 4 is shorter than wave 2.
In expanding type, wave 3 is longer than wave 1, wave 5 is longer than wave 3, and wave 4 is longer than wave 2.
Types Of Diagonals:
LEADING DIAGONAL
ENDING DIAGONAL
LEADING DIAGONAL : In a leading diagonal , waves 1,3, and 5 are all impulsive in nature or all in corrective form of zigzags. Wave 2 and wave 4 are always present in a zigzag form. A leading diagonal suggests the starting of a new wave & that is why it can develop wave 1 of a impulse wave and a first wave of a zigzag pattern.
ENDING DIAGONAL : This is the most common diagonal that can be found out at the ending of a main trend or main correction. It consists of all the waves 1-2-3-4-5 in a single or multiple zigzags. They can be found placed at 5th wave of an impulse wave or can been seen as a wave ‘C’ of a corrective waves zigzags or flat. After the termination of the ending diagonal, a swift & a sharp reversal takes place which bring the prices back to the level from where the diagonal beagan.

Sail Bullish (17-01-2022)sail chart 1 hour time stock correction show triangle correction (A,B,C,D,E).
wave A = (A,B,C)
wave b =(A,B,C)
wave c =(A,B,C)
wave d =(A,B,C)
wave e = (A,B,C)
Triangles are a correction five-wave pattern (marked as A-B-C-D-E), which is divided into five types. This pattern is formed in a position prior to the final wave in an impulse or a correction. For example, a triangle could be formed in a wave four in an impulse or wave B in a zigzag.
Also, this pattern occurs in final wave X in a double/triple zigzag or three patterns.
Wave two of an impulse can’t be a triangle.
Waves A, B and C are usually zigzags, double zigzags, triple zigzags (that’s rare), double and triple threes.
Waves D and E could be triangles themselves.
Triangle’s classification
On the next picture, you can find all types of triangles (Horizontal, Barrier, Expanding, Running and Skewed). Let’s examine them one by one.
All types of triangles Elliott Wave analysis

YZ Bollinge//@version=4
study("YZ Bollinger", overlay=true)
length10 = input(title="Bollinger Length", type=input.integer, defval=34, minval=1)
multiplier = input(title="Bollinger Deviation", type=input.float, defval=2, minval=1)
overbought = input(title="Overbought", type=input.integer, defval=1, minval=1)
oversold = input(title="Oversold", type=input.integer, defval=0, minval=1)
custom_timeframe = input(title="Use another Timeframe?", type=input.bool, defval=false)
highTimeFrame = input(title="Select The Timeframe", type=input.resolution, defval="60")
res1 = custom_timeframe ? highTimeFrame : timeframe.period
smabasis = sma(close, length10)
stdev = stdev(close, length10)
cierre = security(syminfo.tickerid, res1, close, false)
alta = security(syminfo.tickerid, res1, high, false)
baja = security(syminfo.tickerid, res1, low, false)
basis1 = security(syminfo.tickerid, res1, smabasis, false)
stdevb = security(syminfo.tickerid, res1, stdev, false)
dev5 = multiplier * stdevb // stdev(cierre, length)
upper = basis1 + dev5
lower5 = basis1 - dev5
bbr = (cierre - lower5) / (upper - lower5)
// plot(bbr)
// // MARCA LAS RESISTENCIAS
pintarojo = 0.0
pintarojo := nz(pintarojo )
pintarojo := bbr > overbought and bbr < overbought ? alta : nz(pintarojo )
p = plot(pintarojo, color=color.red, style=plot.style_circles, linewidth=2)
// // MARCA LOS SOPORTES
pintaverde = 0.0
pintaverde := nz(pintaverde )
pintaverde := bbr < oversold and bbr > oversold ? baja : nz(pintaverde )
g = plot(pintaverde, color=color.black, style=plot.style_circles, linewidth=2)
//
//
Pivot = input(false, title="Show Pivot High/Lows")
LP = input(defval = 4, title = "Left bars for Pivot")
RP = input(defval = 3, title = "Right bars for Pivot")
PH1 = pivothigh(LP,RP)
PH = valuewhen(PH1,PH1,0)
plotshape(Pivot and barstate.ishistory?PH1:na,style=shape.circle, color=#FF4500, text = "PH", textcolor=color.orange,location=location.abovebar, offset=-3, transp = 0, title="Pivot High")
plot(Pivot?PH:na,style=plot.style_circles, linewidth=2,color=security(syminfo.tickerid,timeframe.period,high,barmerge.lookahead_off)<=PH?#FF4500:na,title="Pivot High")
PL1 = pivotlow(LP,RP)
PL = valuewhen(PL1,PL1,0)
plotshape(Pivot and barstate.ishistory?PL1:na,style=shape.circle, color=#6B8E23, text = "PL", textcolor=color.orange,location=location.belowbar, offset=-3, transp = 0,title="Pivot High")
plot(Pivot?PL:na,style=plot.style_circles, linewidth=2, color=security(syminfo.tickerid,timeframe.period,low,barmerge.lookahead_off)>=PL?#6B8E23:na,title="Pivot High")
// inputs
Depth = input(12, title="Depth") // Depth
Deviation = input(5, title="Deviation") // Deviation
// ZigZag
lastlow = 0.0, lasthigh = 0.0
lastlow := nz(lastlow )
lasthigh := nz(lasthigh )
data(x) =>
d = security(syminfo.tickerid, timeframe.period, x, gaps = barmerge.gaps_off, lookahead = barmerge.lookahead_on)
d
getLow(x, y, z, a) =>
lastlow = y
v = data(x)
m = v==lastlow or data(z) - v > a*syminfo.mintick
if v!=lastlow
lastlow := v
if m
v := 0.0
getHigh(x, y, z, a) =>
lasthigh = y
v = data(x)
m = v==lasthigh or v - data(z) > a*syminfo.mintick
if v!=lasthigh
lasthigh := v
if m
v := 0.0
= getLow(lowest(Depth), lastlow, low, Deviation)
lastlow := e
zBB = v != 0.0
= getHigh(highest(Depth), lasthigh, high, Deviation)
lasthigh := e1
zSS = v1 != 0.0
zigzagDirection = -1
zigzagHigh = 0
zigzagLow = 0
zigzagDirection := zBB ? 0 : zSS ? 1 : nz(zigzagDirection , -1)
virtualLow = zigzagLow + 1
if not zBB or (zBB and zigzagDirection == zigzagDirection and low > low )
zigzagLow := nz(zigzagLow ) + 1
virtualHigh = zigzagHigh + 1
if not zSS or (zSS and zigzagDirection == zigzagDirection and high < high )
zigzagHigh := nz(zigzagHigh ) + 1
a=bar_index-zigzagLow
b=bar_index-zigzagHigh
var color c = na, c := fixnan(a < b ? color.lime : a > b ? color.red : na)
line zigzag = line.new(bar_index-zigzagLow, low , bar_index-zigzagHigh, high , color=c, style=line.style_solid, width=2)
if (zigzagDirection == zigzagDirection )
line.delete(zigzag )
zzPrevHigh = zigzagHigh
zzPrevLow = zigzagLow
if not na(zzPrevHigh )
zzPrevHigh := zzPrevHigh + 1
if not na(zzPrevLow )
zzPrevLow := zzPrevLow + 1
if zigzagDirection != zigzagDirection
if zigzagDirection == 1
zzPrevHigh := zigzagHigh + 1
if zigzagDirection == 0
zzPrevLow := zigzagLow + 1
//
f_draw_infopanel(_x, _y, _line, _text, _color)=>
_rep_text = ""
for _l = 0 to _line
_rep_text := _rep_text + "\n"
_rep_text := _rep_text + _text
var label _la = na
label.delete(_la)
_la := label.new(
x=_x, y=_y,
text=_rep_text, xloc=xloc.bar_time, yloc=yloc.price,
color=color.black, style=label.style_labelup, textcolor=_color, size=size.large)
posx = timenow + round(change(time)*10)
posy = highest(30)
f_draw_infopanel(posx, posy, 0, "Zigzag", a < b ? color.lime : color.red)
//
//
zz= crossover(pintaverde,pintaverde ) or crossunder(pintaverde,pintaverde )
kp= crossover(pintarojo,pintarojo ) or crossunder(pintarojo,pintarojo )
plotshape(zz,title="Low", color=color.red, style=shape.arrowup,location=location.belowbar,size=size.normal, text="Low",offset=0)
plotshape(kp ,title="High", color=color.green, style=shape.arrowdown,size=size.normal, text="High",offset=0)

AUDJPY: Ending Diagonal Pattern; A Reversal on the Horizon.The advance from Mar 24, 2023 low of 86.06 subdivides into five waves. Notice that this price action contains overlapping waves that contract and form a wedge shape. That is the emblem of an ending diagonal which cues a swift and dramatic reversal on the horizon.
According to Elliott Wave guideline, the expected reversal is projected to reach at least the point where the diagonal initiation occurred, and potentially extend beyond. In this instance, the relevant level is identified by the conclusion of wave ((b)) at 86.06.
A salient attribute of ending diagonal is that all initial subwaves form either a single or multiple zigzag patterns. Waves (i), (iii), (iv) and (v) appear to be single zigzags, while wave (ii) is a double zigzag. Wave (v) often makes a throw-over (a brief break beyond the trendline connecting waves (i) and (iii) ). A throw-over suggests a diagonal has finished. Once price action pushes below the trendline connecting waves (ii) and (iv), we would have compelling proof that the diagonal has ended. The next event should be a swift move to at least 86.06 and probably beyond.
The wave count is not the sole basis for considering a short position. Beyond what is illustrated, there has been a divergence in prices and MACD since June 16, 2023, suggesting a diminishing upward momentum and indicating a weakening uptrend. Despite new highs in prices on November 16, 2023 and February 21, 2024, MACD did not follow suit. This bearish divergence frequently foreshadows a potential downturn in prices. (Insert MACD on your chart and draw a trendline connecting the highs)
Trading Plan
Entry: Sell above wave (iii) high.
Protective Stop: 100.95; the price level at which wave (v) would be longer than wave (iii),
which would render our diagonal scenario invalid. As a rule, within a
contracting ending diagonal, wave three is always shorter than wave
one, and wave five is always shorter than wave three.
Target: 86.06 and below
Risk-Reward: 1:5

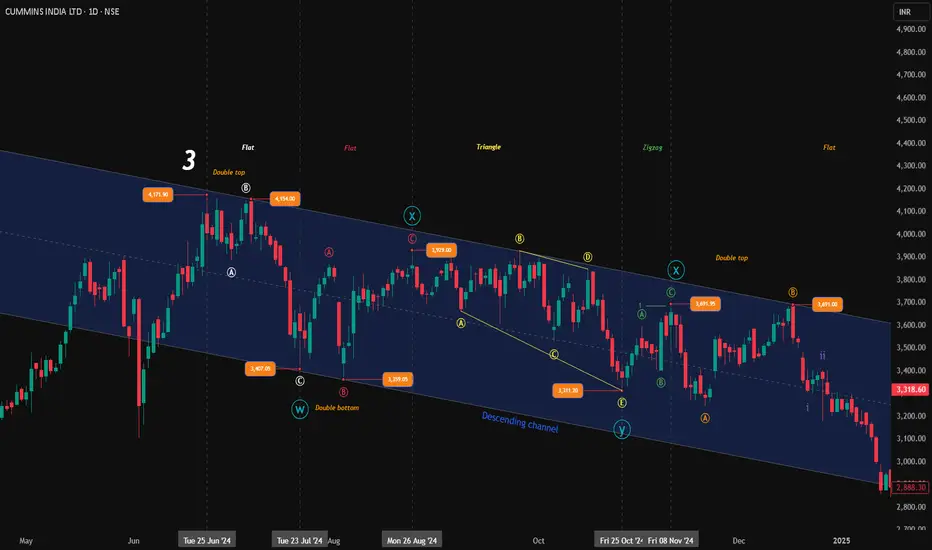
Waves Gone Wild: Understanding Complex CorrectionsUntangling the Mystery of Complex Corrections – A Simple Walkthrough Using CUMMINS INDIA
Ever wondered why the market suddenly becomes messy and confusing after a big rally? Welcome to the land of Elliott Wave corrections, where things aren't always a straight road—but if you know the signs, you won’t get lost.
Let’s break it down using a real chart – CUMMINS INDIA , where we can spot all types of corrections playing out like a drama series.
Step 1: Why Do Corrections Happen?
Corrections mostly show up in Wave 2 and Wave 4, which come after a strong trend (Wave 1 or 3). The job of corrections is simple – to cool things down before the next move.
Step 2: The Simple Ones – Flats and Zigzags
Zigzags (Pattern: 5-3-5):
Wave A: 5 waves
Wave B: 3 waves (does not cross the start of A)
Wave C: 5 waves, usually equal to or 1.618x of A
Zigzags are sharp and directional – like a quick jab.
Flats (Pattern: 3-3-5):
All about sideways movement.
The B wave often ends near or slightly above/below A’s start – forming what we call expanded flats (hello, double tops and bottoms!)
C wave finishes things off with 5 waves.
Flats are more chill – like the market catching its breath.
Step 3: The Slow Builders – Triangles
Triangles are like coiled springs. They’re made of five legs: A-B-C-D-E, all 3-wave moves. These usually show up in:
Wave 4 of an impulse
Y wave inside complex corrections
Think of triangles as the calm before the final push. You’ll often spot them before Wave 5 explodes.
Step 4: When One Correction Isn't Enough – Enter WXY
Imagine the market says, “One ABC correction? Nah, let’s keep going.”
WXY: Two corrections joined by an X wave.
W = ABC
X = ABC (a connector)
Y = ABC again
So it’s like: ABC + ABC + ABC
Step 5: When Even That’s Not Enough – The WXYXZ Beast
Sometimes the market just doesn’t want to move on. So it throws in another ABC.
WXYXZ:
That’s three ABC corrections, joined by two X waves.
If that’s still not enough? (Yes, this happens)
The whole mess becomes just Wave W of another larger correction. Fun, right?
CUMMINS INDIA – The Perfect Textbook Example
In the chart:
You’ll see flats, zigzags, triangles, all wrapped inside a giant WXYXZ correction.
It spanned months, unfolded in layers, and just maybe, it’s done now.
From April onwards, the move looks impulsive (non-overlapping), hinting at a fresh trend. Or… is it just a big Zigzag in disguise? (C = 1.618 × A, remember?)
Only time (and maybe a bit more charting) will tell.
Final Thoughts
There are amazing books, and thousands of charts to study if you’re serious about learning.
"Give a man a fish, he eats for a day. Teach him how to fish, he eats for life." Trading is the same. Learn the process. Dont chase the calls.
I’m just sharing what I’ve learned with this post. Hope it helps someone out there. Happy charting, and remember— no one is ever 100% right. Stay curious. Stay humble.
Disclaimer: This analysis is for educational purposes only and does not constitute investment advice. Please do your own research (DYOR) before making any trading decisions.
Nifty view post 26/2Hey Everyone,
Fantastic February month, Market moved 1K points up and 1K points down post our last analysis in unfolding wave 4 and Wave 5 of the final corrective Wave C in ABC pattern started last October. ( waves are labelled on the chart)
New interesting things.
Last post we saw how market fooled 'some' analysts while performing " contracting leading diagonal" in Wave A.
This time, Market is unfolding as an "expanding ending diagonal".
You might remember that i mentioned i will save this for later day and today is the day.
Will keep it simple.....
1) ******* Leading diagonal ***** - Always appears as subdivision of wave 1 in an impulse or subdivision of wave A in a zigzag. ( we saw this in the wave A in a zigzag).
Simply means, either during starting of a rally ( wave 1) or start of a corrective wave (wave A in zigzag)
This we already saw and it was a "contracting leading diagonal".
Wave 1 > Wave 3 > Wave 5
Internal structure - 5-3-5-3-5
2) ***** Ending diagonal****** - Always appears as subdivision of wave 5 in an impulse or subdivision of wave C in a zigzag. ( we are seeing this in wave C now).
Simply means, either during end of a rally ( wave 5) or end of a corrective wave (wave C in zigzag)
....................................................................
Ok, but how did we identify it? Remember , we told Wave 5 target can only be identified once wave 4 is unfolded.
Even though wave 3 is longer than wave 1,
wave 4 had entered into the wave 1 territory which is against Elliot wave principles ( this is because of the budget day relief to Indian markets or whatever the reason). This itself has changed the target of wave 5 .
Internal structure - 3-3-3-3-3
Wave 1 (1321) < Wave 3 (1438) < Wave 5 ( ?????)
with small calculation , based on % increase btw wave 1 and wave 3 , its coming close to 1567 points which gives a target of around ~22246. ( approximate) .
That should complete the final 5th and end of Wave ABC.
Its not happening tomorrow or in next 3 or 4 days, as per Fib time extension may take till March 19th ( this works or not, hence just sharing as side note) But level is important. so some up moves, down moves, sideways are still in cards.
This is just an idea as per market price action, I may be totally wrong, but hey having a view is better than having nothing. :D . Few points here and there is all fine with margin or error.
------Always look any analysis as an area of interest and confirm only based on price action------
Also, I share only few important rules, for others do check online.
Happy Trading
Cheers!!!!!!!!!!!!
Ohh...btw how it will be fooling 'Some' analysts ??
As per Elliot waves
There are three different ways to measure wave 5. First, wave 5 is inverse 123.6 – 161.8% retracement of wave 4. Second, wave 5 is equal to wave 1. Third, wave 5 is 61.8% of wave 1-3.
Since this is a diagonal wave , market will never respect these above levels and leave folks frustrated either by breaking them or never reaching them. In mean time, market will wind up things and start next rally.
Don't miss this bus as this bus not ending till 2027 somewhere ( month will we see later) .
I don't reply often and exact levels are a myth. I use only fib levels to estimate an area of potential reversal.
"Finding levels in market is like finding underwear in the ocean, you always come out naked" ( heard recently somewhere, thought to share).
Happy Shivaratri , Maha kal Blessings to all.

Nifty Elliott wave UpdateCurrently Nifty trading pattern is like expanding triangle. Nifty wave (c) -(yellow) is continuing in zigzag pattern and currently price is in second phase of zigzag. There are maximum 3 phase in wave theory. Current price is in wave "c" of (c). Wave "c" should be equal in length of wave "a". So Price near 10320 will be Important to watch either price reverse for bigger degree down trend or take minor correction for 3rd phase of zigzag.
Any break below 9900 will indicate that wave (c) is going to finish with second phase of zigzag and next bigger degree downtrend has been started towards 9400.
At the level of 9400 then will be important for new formation of 7 leg diametric pattern or price fall sharply below 9400 to Complete larger wave

Bank Nifty Ultimate Target this season....!Hey guys,
Its being manipulated but the targets will come downside no matter what time.
Keeping finger crossed until then...
Regards

Nifty looking for zig zag correction 15th Jan 2021Bounce retracement towards 14530-50 possible after which should go down.
Confirmation entry on sell side if 14435 breaks (non risky wait for this 14435 break level)then 14400-14300-14270 possible on downside
Stop loss of this analysis 14618
DISCLAIMER:There is no guarantee of profits nor exceptions from losses.
Technical analysis provided on the chart is solely the personal views of my research.
You are advised to rely on your own judgments while taking any investing/Trading decisions.
Past performance is not an indicator of future returns. Investment/trading is subject to market risks.
Seek help of your financial advisors before investing/trading.
I may or may not trade this analysis. Details in description.
-------(((((Please LIKE & Donate Coins to support my analysis)))))-------

Banknifty in Leading Diagonal 5th Wave coming to EndFrom March Lows Bank nifty is slow mover but now formed leading diagonal which is sign of uptrend coming in future.
But right now we will experience corrective wave to 5 wave leading diagonal before uptrend.
Current price 26798 and at parallel channel resistance max 27000-27162 can be expected.
We can see zig zag wave (a)-(b)-(c) from 27000 levels.
Wave (a) is expected from this point towards 25232 or 24432 (0.236 Fibonacci level of wave 1-5 of leading diagonal)
Wave (b) should retrace towards 26361 (0.618 Fibonacci between all time high and march low)
Wave (c) should retrace towards lower end of channel towards 23000 or 22842 (0.382 Fibonacci level of wave 1-5 of leading diagonal)
DISCLAIMER:There is no guarantee of profits nor exceptions from losses.
Technical analysis provided on the chart is solely the personal views of my research.
You are advised to rely on your own judgments while taking any investing/Trading decisions.
Past performance is not an indicator of future returns. Investment/trading is subject to market risks.
Seek help of your financial advisors before investing/trading.
I may or may not trade this analysis. Details in description.
-------(((((Please LIKE & Donate Coins to support my analysis)))))-------

Wondering where the Dollar is headed next? He're is a hint. Analysis
A five wave decline from 107.34, the high on Oct 03, 2023 to 100.62, the low on Dec 28, 2023.
In Elliott terms, this impulse structure tells us that the movement at the next larger degree of trend is also downwards. Within this impulsive structure, wave (i) is a Leading Diagonal, wave (ii) is a Flat which neatly predicts a Zigzag wave (iv) by guideline of Alternation. Both waves (iii) and (v) are extensions. The impulsive decline holds well within the parallel trend channel as is often expected.
A five wave move is always followed by a three wave corrective pullback or variation thereof, irregardless of degree; in this case, a rally wave ((ii)).
To where? The Elliott wave guideline on the depth of corrective waves suggests that price action should ideally end within the span of travel of the previous fourth wave of one lesser degree.
Second, the ensuing correction, wave (ii) is unfolding as a sharp Double Zigzag correction labelled (w)-(x)-(y) with waves (w) and (x) completed, wave (y) in progress.
In ratio relationships, sharp corrections tend more frequently to retrace 61.8% of the previous wave particularly when they occur as wave (ii) of an Impulse or wave (b) in a larger Zigzag.
Also, the actionary waves in a Double Zigzag correction namely waves (w) and (y) are often related by equality or Fibonacci (0.618) in time or amplitude.
wave (y) = 0.618 X (w) at 104.87; this level falls neatly within the previous guidelines.
Thus, the cluster of evidence suggest the rally is nearing its end and a reversal is onset; a third wave.
Trade Plan
1) Conservative Approach
Entry: Short at 104.879; the 0.618 retracement.
Protective Stop: 107.34; in an Impulse wave (ii) CAN NEVER retrace more than 100% of wave (i).
Target: 10.87 decline; in an impulse the third wave commonly travels 1.618 times the loss of
the first, as in:
wave ((i)) = -6.72 (100.62-107.34),
wave ((iii))= 1.618 X (-6.72) equals (-10.87)
Risk-Reward: 1:3
2) Aggressive Approach
Requires price action to break below a recent swing low; wave b of a Zigzag, that will virtually suggest the rally has ended and a reversal was underway.
Entry: Break below 103.89
Protective Stop: Recent swing high
Targets: Below 100.62
Risk-Reward: Greater than 1:3
NOTE: Stay tuned to get follow-up adjustments to stops as we monitor the move through completion.

#banknifty analysis for the short term#banknifty analysis for the short term:-
Expanding Rising Wedge:- A triangle is a sideways corrective wave with sub-waves labeled A-B-C-D-E. In most cases, all the sub-waves of a triangle are zigzags or multiple zigzagsTherefore, we call the triangle a 3-3-3-3-3 structure.
Looking at the structure, we expect selling pressure from the upside, which will drag the market below the recent low.
Always trade what you see, not what you feel.
Best Regards,
SG

EURUSD: CASE OF ENDING DIAGONALENDING DIAGONAL : This is the most common diagonal that can be found out at the ending of a main trend or main correction. It consists of all the waves 1-2-3-4-5 in a single or multiple zigzags. They can be found placed at 5th wave of an impulse wave or can been seen as a wave ‘C’ of a corrective waves zigzags or flat. After the termination of the ending diagonal , a swift & a sharp reversal takes place which bring the prices back to the level from where the diagonal began.
TRADING STRATEGY: One should go long on the current levels or any dip , keeping a stop loss of 1.15360 look for the target of 1.16400 & above.

HINDALCO: CASE OF ENDING DIAGONALENDING DIAGONAL : This is the most common diagonal that can be found out at the ending of a main trend or main correction. It consists of all the waves 1-2-3-4-5 in a single or multiple zigzags. They can be found placed at 5th wave of an impulse wave or can been seen as a wave ‘C’ of a corrective waves zigzags or flat. After the termination of the ending diagonal, a swift & a sharp reversal takes place which bring the prices back to the level from where the diagonal began.
Trading strategy:
One should go short on current levels keeping SL of 510 & look for the target area of 440/420/400

M&M FINANCE: Bullish (Ending Diagonal)This is the most common diagonal that can be found out at the ending of a main trend or main correction. It consists of all the waves 1-2-3-4-5 in a single or multiple zigzags. They can be found placed at 5th wave of an impulse wave or can been seen as a wave ‘C’ of a corrective waves zigzags or flat. After the termination of the ending diagonal , a swift & a sharp reversal takes place which bring the prices back to the level from where the diagonal began.
Trading Strategy:
Buy on cmp , add on dips , keep SL of 150 & look for the target of 173/180 zone
