Elliott Wave Analysis – XAUUSD | July 30, 2025📊
🔍 Momentum Analysis
• D1 Timeframe: Momentum has started to reverse upward, but we need to wait for today’s daily candle to close for confirmation. Until then, there is still a risk of another short-term decline.
• H4 Timeframe: Momentum lines are clustering in the overbought zone, signaling a possible weakening of the current upward move. However, this signal alone is not enough to confirm that the uptrend has ended.
________________________________________
🌀 Wave Structure
• Price has reached the projected target for wave e, but there has been no strong bullish reaction. The recent candles are short-bodied and overlapping – typical of corrective structures. Also, this wave has lasted longer than previous corrective upswings, suggesting that the decline may not be over yet and the wave count needs to be reviewed.
Currently, we are facing two equally probable scenarios (50/50), but they suggest opposite outcomes:
➤ Scenario 1: Zigzag (5-3-5) Structure
• The current structure may represent only wave A of a larger zigzag.
• We are now in wave B, which tends to be complex and unpredictable, making it not ideal for wave-based trading.
• The red zones marked on the chart indicate potential target areas for wave B.
➤ Scenario 2: Completed 5-Wave Correction
• The downtrend may have completed at wave (e).
• The current upward movement could be wave 1 forming as a triangle – a potential start of a new bullish cycle.
• However, to confirm this scenario, price must hold above 3309. If it fails to do so and H4 momentum reverses downward, a new low is very likely.
________________________________________
📝 Trading Plan
Given the current market conditions, I only recommend short-term scalp trading based on the predefined support and resistance zones.
Avoid wave-based trading until the structure becomes clearer. Once clarity returns, I will provide an updated trading plan.
Search in ideas for "zigzag"

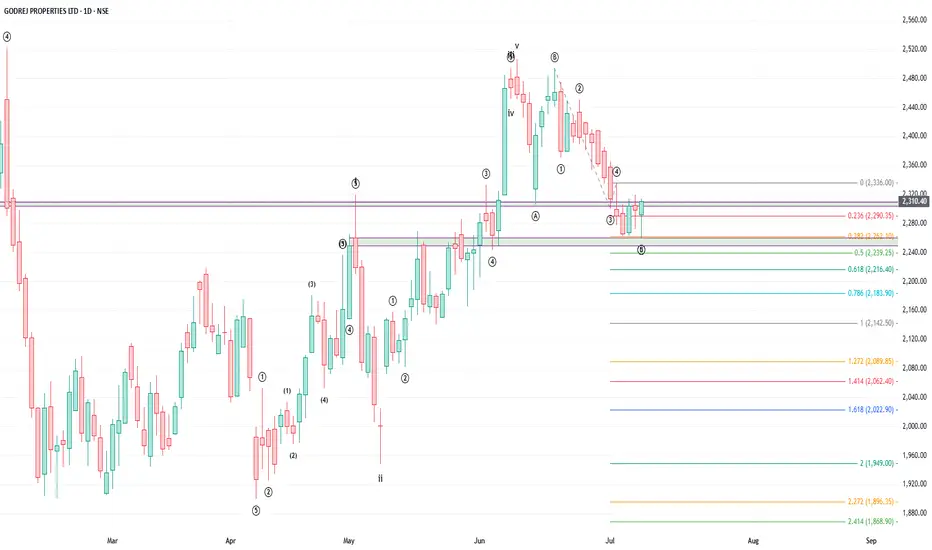
Buy Godrej Properties, target 2736, timeframe 2-3 monthsGodrej Properties completed its first impulse after the Sep'24-Mar'25 correction on 10 June '25 and has been undergoing correction (possibly) in the form of a zigzag.
There is a good possibility that wave C of the zigzag has been completed at fibo 0.382 of wave 0-3. One may reasonably assume that the next wave could be of minimum 78.6% of the impulse that has been completed which gives a target of 2736.
Maintain stoploss of 2180.
Happy Trading!!
Buy Chambal Fertilizer - Trade Wave B
Chambal Fertiliser is a one of the highly traded F&O stocks.
The stock had completed its (V) wave of larger degree and hence has been undergoing larger correction. Under Elliot Wave theory, corrections are always in three(s).
The present correction will be in the form of wave WXY. Wave W is a zigzag (which results in deeper correction), named as wave ABC; Wave X is an intervening upward wave which will be followed by Wave Y which is another zigzag. If the correction is not sufficient it may extent to wave Z, connected by another Wave X (WXYXZ structure).
Wave W comprises two downward impulses, i.e. 5 wave structures; Wave A and Wave C, connected by Wave B (upward counter wave). The stock has possibly completed its first impulse i.e. Wave A. Wave B is a corrective way (which is upward) and hence provides an opportunity for buy trade.
Normally the retracement could be about 0.5 / 0.618 to 0.786 of swing high or full wave. Trade with strict stop loss as correction can continue.
This can be taken as an example of how to count waves for larger corrective wave structures for people interested in Elliot Wave Theory.
Happy Trading!!

Elliott Wave Analysis – XAUUSD H1 Timeframe 29/05/2025🔍 Current Wave Structure
Price is currently correcting within a WXY structure, also known as a double zigzag. At the moment, the market is progressing through wave Y, with two potential targets:
🎯 Target 1: 3245 – already reached, and price has bounced sharply from this zone.
🎯 Target 2: 3215 – a deeper target, requiring further confirmation from price action and real-time momentum.
📈 If wave Y has already ended at 3245, the market may now be in wave 1 of a new bullish cycle. Once wave 1 completes, we’ll look for wave 2, which typically offers a prime entry point for wave 3.
👉 Wave 2 often forms as a zigzag or flat correction. Using Fibonacci confluence and liquidity zones, the potential wave 2 pullback area is 3265 – 3262.
⚡️ Momentum Outlook
🕯 D1: Momentum is entering oversold territory → high probability of bullish reversal today or tomorrow.
🕯 H4: Reversal setup is forming; current H4 candle closes in just over an hour → watch for confirmation.
🕯 H1: Momentum is rising. Wait for a pullback in H1, followed by renewed bullish momentum without breaking below 3245 — that’s likely the end of wave 2 and the entry point for wave 3.
📌 Important Note:
If H4 momentum reverses downward and price fails to break above 3324, it could signal a continuation of the broader downtrend, with 3215 remaining as the next wave Y target.
🛒 Trade Setu p
BUY ZONE: 3265 – 3262
Stop Loss: 3255
Take Profits:
• TP1: 3290
• TP2: 3324
• TP3: 3346
❗️ If price breaks below 3245, it would confirm that wave Y is still in progress. In that case, monitor the 3215 zone for a new buying opportunity.

Nifty 50 View . Trend Analysis.Hey Everyone,
Crazy week post "weekly no body Doji candle" , saw both buying and selling pressure as indicated by candle, both high and low of Doji candle is tested.
New Information ---->
Anyway....I wanted to share one learning with you guys which i will show you in the chart, how market fooled the analysts and is continuing downtrend.
I hope you guys must have heard or read about Elliot waves and one learning is that Wave 3 is the biggest of all waves.
But But But (people who already know can ignore).
There is a special type of impulsive wave called " leading diagonal" and also one more called "ending diagonal" . ( will be interesting will see this on Nifty chart)
What is leading diagonal ( Ending diagonal will see later some other time)
This is a Special type of motive wave which appears as subdivision of wave 1 in an impulse or subdivision of wave A in a zigzag. ( you can google and see who the structure is).
Whats the connection with Nifty?
From ATH, when market started correcting and it made wave 1 and wave 2 , then it made a wave 3 which is shorted than wave 1 and reversed to form wave 4.
1st wave - ( 1588 points fall) from ATH
3rd wave - ( 1399 points fall) and market made wave 4 fooling every one that this is not wave 3 and its a small correction.
But what market did later was after forming wave 4 it fall sharply for (1275 points) completing wave 5. Since its an impulse wave, it has to complete 5 sub waves. More info down ( theory)
------------------------------------------- So much info-------break----------------------------------------
How did market made wave 5 when wave 3 failed to be the longest wave of Elliot Model?
So much to write to come to this point.
-----------Impulsive wave------------------
Here comes the leading diagonal, when Elliot model was introduced in 192X year , there is no concept of this diagonal impulsive moves.
But as years passed and models developed, this new type of impulsive waves are surfacing on charts across the world indices. ( lot of people might already know this but this is only for learning).
Major identification of leading diagonal is the price action forming a "Wedge" pattern.
We also have a contracting leading diagonal and expanding leading diagonal. ( check google for more info). These are now termed as impulsive waves.
In a "contracting leading diagonal" , Wave 1 > Wave 3 > Wave 5 . fall in points -> 1588 > 1399 > 1275. Opposite case in expanding leading diagonal( wave 5 will be more than wave 3 than wave 1) . Each down move is smaller that previous down move ( yes, its true). Then we saw a nice up move making everyone forget about wave 5 and back to business ( from last week of November) but market formed the Wave B of ABC corrective wave secretly and started brutal fall)
This resulted in market forming the "Subdivision of wave A in a zigzag" Pattern. which is a 5-3-5 ( ABC move). This is enough information to say market is gonna fall , because it has to complete Wave C. There is no other option. We are going to see a nice down correction, Sub wave 3 of Wave C is still going on as per my understanding.
All Fib levels are shown on chart.
Remember Wave 5 cannot be more than Wave 3 in Wave C and once wave 4 is completed , we can estimate minimum TP levels and more.
Will see later how market unfolds.
Happy Trading,
Cheersss!!!!
AS always, this is a mere idea on how market unfolds itself in wave structures ( especially Fractals). Please take advice before taking any action.

ETH 2 days before Bitcoin halvingSimilar to bitcoin, ETH has just finished correcting the 3rd beat in its double correction ABC wave: zigzag - flat - zigzag. This 5th wave C also has a dead end (very weak wave) and cannot withstand the strong uptrend of ETH. Keep your wits about you if you are an ETH holder trader

EUR/USD: A Third Wave of an Impulse in Sight Analysis
The advance from Oct. 03, 2023 low of 1.0448 to 1.1140 subdivides into five waves. This wave pattern is significant because impulse waves identify the direction of the dominant trend. Thus the five wave advance implies further buying to come that would take prices above 1.1140 as wave 3.
The subsequent decline in EUR/USD is developing in three waves; Double Zigzag correction labelled ((w))-((x))-((y)) with wave ((y) in progress, supports this analysis. Counter trend price action typically consists of three waves, it's slow, choppy and often contained within parallel lines.
The depth of corrective wave guideline suggests that corrections tend to register their maximum retracement within the span of travel of the previous fourth wave of one lesser degree, most often ending near its terminus.
More over, in ratio relationships, sharp corrections tend more frequently to retrace 61.8% of the previous wave particularly when they occur as wave 2 of an Impulse or wave B in a larger Zigzag. Observe that this level is near the previous fourth wave of one lesser degree.
Within wave 2, wave ((y)) = 0.618 X ((w)) at 1.0701. Observe that this level is near the previous guidelines.
All this evidence virtually suggest that a bottom is at hand and a reversal could be around the corner.
Trade Plan
Entry: Buy at Market Price
Protective Stop: 1.0448;in an Impulse wave 2 CAN NEVER retrace 100% of wave 1.
Target: 1120 pips; in an Impulse the third wave commonly travels 1.618 times the gain of the
first as in; wave 1 = 692 pips (1.1140-1.0448), wave 3 = (1.618 X 692)
Risk-Reward: 1:3

Nifty View (Long Term Trend)Good Evening!
I was looking at the chart today. I have studied Elliot waves and Harmonic patterns. While analysing the chart, i concluded that we are in long bull run and this is a time bound correction.
Elliot wave analysis:
1. This is a Corrective Combination which started in Oct 2021. First Leg was a "Flat Structure" and after completion of "X", market completed a ZigZag yesterday i.e. 19 June. (for Ref: Please look at page no 30 in AJ Frost and Robert Prechter Book of Elliot Wave Principle)
There could be some exceptions in forming first leg of Flat structure and third leg of flat structure, but overall it seems to be a flat structure plus a zigzag. It may emerge something different after a month but we have to live with something in present so:
2. I am saying yesterday because
A. Yesterday market made a Doji (which could be reversing pattern in candlestick)
B. We are very near to the support line.
3. If we look at it another way, then this type of Double Combination gives a look of "Flag". This type of typical flag if broken upside could tear apart Bears for long run.
Apart, If we bounce from yesterday low then it could be a start of new impulse wave upwards which could only be confirmed when we break out above life time high.
Till then we will only assume that another "X" is in formation and Market may seek more time to correct itself.
P.S. Above is my opinion and it may change as the market will emerge in future. I am not a future teller but all we can do is "Predict".

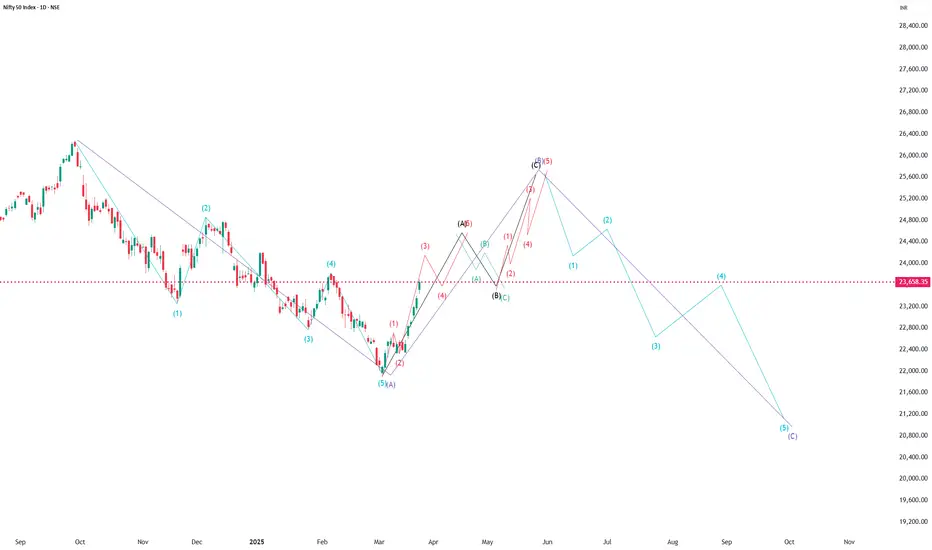
NIFTY OUTLOOK1-The retracement is zigzag.
2-Part A came in clear five waves.
3-Wave went up with a slight bend forming a-b-c
4-Wave B is unfolding in zigzag with with wave 3 in forming.
5-wave B went up slightly more than wave 0.5% of Wave A but is less than 61.8% of A.
5-Although premature to predict wave v but we can expect it to come around 9159
Information is meant for educational purpose only
All comments are wellcome.

Weekly Elliot Wave Analysis Elliott Wave View: Bank of America (BAC) Resumes Lower
April 22, 2020 By EWFHendra
Elliott Wave view in Bank of America (BAC) suggests the decline from January 15, 2020 high is unfolding as a 5 waves impulse. Down from January 15 high, wave (1) ended at 32.47 and bounce in wave (2) ended at 35.45. Stock has resumed lower in wave (3) which ended at 17.95. Bounce in wave (4) is proposed complete at 25.35 as a zigzag.
Short term 45 minutes chart below shows the stock ended wave (4) bounce at 25.35. This level is now the short term invalidation level for more downside. Internal of wave (4) unfolded as a zigzag where wave A ended at 23, wave B ended at 19.51, and wave C of (4) ended at 25.35. While below 25.35, wave (5) lower is currently in progress as an impulse, but BAC still needs to break below wave (3) at 17.95 to avoid a double correction.
Down from 25.35, wave 1 ended at 21.09 and wave 2 bounce ended at 23.40. Near term, while rally fails below 25.35, expect Bank of America to extend lower within wave (5). Potential target lower is 123.6 – 161.8% external extension of wave (4) which comes at 13.3 – 16.1. NSE:MOTILALOFS

Nifty Elliott wave analysis for 1st July 2019It seems Nifty currently in triple zigzag correction and will complete its last abc below 11625(most probably in an ellipse drown in chart). So Nifty needs to go below 11617 before breaking upper wedge line. But if it breaks upper wedge line before going below 11617 then we could conclude that correction is completed at 11625 as double zigzag.

#BANKNIFTY Short Term Positional View ( 1 - 3 months)#BANKNIFTY Short-Term Positional View ( 1 - 3 months):-
Let me post what I see: a double zig-zag painful correction in the market, where positional buy is only above 42,000 levels (closing basis). People will get trapped on both sides and until and unless, you are ready to read this complex correction in a minute way, making money will be challenging in the coming 2 to 3 months of time.
I prefer to trade lightly in the coming few months.
Techno Funda on double zig-zag:-
Double Zigzag Correction is a complex corrective wave pattern that appears in Elliott Wave Theory. It is a variation of the standard Zigzag correction that consists of two zigzag patterns separated by a complex correction in the opposite direction. The double zigzag correction can occur in both bullish and bearish markets and is considered a corrective wave that corrects the previous impulse wave.
The Double Zigzag Correction is identified by the following characteristics:
The correction consists of two zigzag patterns, labeled (W) and (Y).
The zigzag patterns are separated by a complex correction labeled as (X).
The correction ends with a final zigzag pattern, labeled as (Z).
The (X) wave is usually longer and more complex than the (W) and (Y) waves.
The (W) and (Y) waves are usually equal in length.
The Double Zigzag Correction is a time-consuming correction that can take a long time to complete. It is usually seen in markets that are undergoing a strong trend reversal. The pattern is useful for traders who are looking for a countertrend trading opportunity, as the pattern provides a clear entry and exit point for trades.
It is important to note that the Elliott Wave Theory is a highly subjective method of analysis, and the accuracy of any wave count is subject to interpretation. Therefore, traders should use caution when using the Elliott Wave Theory as a basis for trading decisions and should always use additional technical and fundamental analysis to confirm their trading decisions.
Always trade what you see, not what you feel. Always enjoy trading and avoid trading when you are mentally disturbed.
Regards,
SG

View on Nifty The bottomed out is not yet happened, it Is just a pause or small relief in the DOWN trend. This week or early next week the market will resume its real direction. Prepare yourself.
In the pullback (Wave B), wave WXY completed and another X is in progress. Wave W is not very clear, so possibility for either one - flat or zigzag. Wave Y is zigzag.
There is possibility for a triangle (the current wave X) based on the development happened so far. If so, wave AB in the triangle completed and wave C is about to end.
Disclaimer: This is just my personal view and not recommending any trading ideas.

NIFTY has broken 50% level on closing basis.NIFTY is making a double zigzag.
We are in last leg of double zigzag.
Has broken 50% of retracement and we will definitely see the 61.8% level.
Only for education purpose.
Regards

BTCUSDT | The best scenario for moving this week🔥Hello traders, Bitcoin in daily timeframe , this analysis has been prepared in daily timeframe but has been published for a better view in 3 day timeframe.
In counting, the main waves 1, 2 and 3 are labeled and we are now inside wave 4.
Wave 4, according to the main wave 2, will be a wave that will have a moderate correction both in terms of price and time.
The structure of the main wave 2 was zigzag , a zigzag that is not normal, so it is far from expected that wave 4 is also zigzag .
In the previous analysis, we thought the first zigzag would end in wave 4, and the x-wave would consist of a double zigzag or wave b of a flat.
But this was not the case and the descent went beyond the previous floor. We considered this descent to be part of wave c of the first zigzag of wave 4, and now the trend is in the support range of around 40 ,000 and we will expect the formation of wave x, which is up to 0.618 Fibonacci. Will move, and if it moves beyond, it seems more likely to form a flat pattern for wave 4.
It should also be said that if the support range of 40 ,000 is broken, the movement up to Fibo 0.50 and the price of 36,500 will continue, and it can be said that the ascent will take place at the bottom of the Orange Channel, and this ascent is definitely for wave b of the flat.
🙏If you have an idea that helps me provide a better analysis, I will be happy to write in the comments🙏
❤️Please, support this idea with a like and comment!❤️

BTCUSDT | The best goal for price correction♻️Hello traders, Bitcoin in daily timeframe , this analysis has been prepared in daily timeframe but has been published for a better view in 3 day timeframe.
In the wave count we did, the main waves 1, 2 and 3 were labeled and now we are inside wave 4.
Wave 4, according to the main wave 2, will be a wave that will have a moderate correction both in terms of price and time.
The structure of the main wave 2 was zigzag , a zigzag that is not normal, so it is far from expected that wave 4 is also zigzag .
In the previous analysis, we thought the first zigzag would end in wave 4 and the x wave would consist of a double zigzag or wave b of a flat.
But this was not the case, and the decline went beyond the previous price floor. And if it moves further, a flat pattern for wave 4 seems more likely.
It should also be said that if the support range of 40 ,000 is broken, the movement up to Fibo 0.50 and the price of 36,500 will continue, and it can be said that the ascent will occur at the bottom of the green channel, and this ascent is definitely for wave b of the flat.
🙏If you have an idea that helps me provide a better analysis, I will be happy to write in the comments🙏
❤️Please, support this idea with a like and comment!❤️

Uflex wave countsCurrent wave count as per my view.
Cycle : wave 2
Primary : wave A(In case of zigzag correction) or wave B(In case of Flat correction)
Intermediate : wave 4(In case of zigzag correction) or wave A(In case of Flat correction)
Primary 5 has taken a form of an ending diagonal with an truncated 5th intermediate wave.This is followed by 2-4 trendline and wave 4 low breach in a shorter duration then wave 5 took to form giving two stage confirmation of trend reversal.
Possibilities of the form of current correction
1)Zigzag
Generally wave 2's are zigzag,not necessarily but in general,if that's the case then Intermediate count would be 4 and price should not touch 517 level as per this chart and should make new lower low for intermediate wave 5 of primary A which would then be followed by wave B bounce followed by wave C decline to complete 5-3-5 zigzag structure.
2)Flat
If price touches 517 as per this char,then rule of impulse would be violated meaning correction will be a Flat one with 3-3-5 structure of which primary A is done @ 428 and primary B is in progress.Now where this B will terminate cannot be known but depending upon it will be the form of the flat correction will be decided upon which we can calculate target for wave C to complete cycle wave 2(considering correction not being an complex one).
Irrespective of either form of correction that we are in wave C is yet to come for both form of correction (Zigzag/Flat) hence as per this count longs previously held should be covered in this current bounce once we get a close below previous day low.
DISCLAIMER:There is no guarantee of profits or no exceptions from losses. The study provided is solely the personal views of my research. You are advised to rely on your judgment while investing/Trading decisions. Past performance is not an indicator of future returns. Investment is subject to market risks. Seek help of your financial advisors before investing/trading.
I may or may not trade this analysis

Nifty View 25/03/25Hello Everyone,
Just wanted to update on what's happening in Nifty50. Couldn't get time to put together a bit early( other works) . Anyway.....lets start. This is just my idea, views can and will differ.
As per our previous view, market bounced somewhere from ~21970 levels but its getting unfolded as an impulse wave...so the party is over for downside and sub wave A in ABC corrective wave is over. one wave is done ( corrective wave against the major trend which started from March 2020)
We are currently in wave B. Some people might be wondering how this sub wave B will unfold and some might even be thinking that downside is over as we are seeing an impulse wave and may hit ATH soon blah blah blah...
----------------------------------------------------------------------
First thing first always sharing knowledge.
Motive waves
Impulse or diagonal wave or Impulse with extensions
- Impulse is a 1-2-3-4-5 pattern where sub wave 3 is bigger.
- Diagonal is a 1-2-3-4-5 pattern where sub wave 1 ( wave 1 > wave 3 > wave 5 ) or
sub wave 5 ( wave 1 < wave 3 < wave 5 ) is bigger. Further classified into leading diagonal
and ending diagonal. Check online for more info or my previous post. saving my writing time.
- Extension is a 1-2-3-4-5 pattern similar to impulse but we will see one more (1-2-3-4-5)
inside wave 1 or wave 3 or wave 5.
Corrective waves
We have Zigzag (5-3-5) , Flat ( 3-3-5) , Triangle ( 3-3-3-3-3) , double 2 and double 3 as the corrective wave structures. Any where you see, these are the ones that unfold .
Lets see what market has done till now
Down move (Completed) (27th Sep 2024 - 4th March 2025)
Since its against the trend ( which started from covid time) market has to unfold in ABC pattern which is nothing but correction. This is over, we saw a "Contracting leading diagonal" . Leading diagonals always form in wave A of ABC
-----------------------------------------------------------------------------
Up move ( Current)
3) Wave B can be any corrective structure. ( any of the above i mentioned)
Currently we are again seeing an impulse wave, which confirms that we are again going to see
a zigzag pattern (5-3-5) . . ( 1-2-3-4-5 / a-b-c/ 1-2-3-4-5) . More up move is
pending.
Wave B = 50%, 61.8%, 76.4% or 85.4% of wave A
------------------------ We are in sub wave A (1-2-3-4-5) of wave B .............................
Down move (Next)
4) During the next down move after completing wave B , market can go to complete wave C or trap people by forming a double 2 or double 3 patterns and then start the final down move and complete wave C ( it will be fast)
double 2 - zigzag + flat / triangle
double 3 - flat + zigzag + triangle ....these generally form in any order. Not saying market will form , just sharing theory.
Wave C is typically at least as large as wave A and often extends to 1.618 times wave A or beyond.
I think too much already...lets see how the markets trend...................
Tips
1) Always count Elliot waves in 1 H timeframe or more. Lower time frame will make you mad .
2) 3rd wave always gets confirmed with a break away gap ( 18th march 25) and followed by run away gaps ( following days) . The more the gaps the more strength the more bigger , this is how you identify an impulse wave
3rd wave in a diagonal wave doesn't have run away gaps , only break away gaps ( 19th Dec 24) and (13th Jan 25) . This is the reason why the 3rd wave is not the biggest in a diagonal wave and how it gets a "wedge" kind of shape.
Don't follow the levels on chart, its only for representation.
Happy Trading
Cheers!!!!!!!!!!!!!!!!
What's happening in ITC?ITC daily chart: After completion of Normal or Trending Impulse, the price falls.
We can see clearly that the first leg of this fall looks like an impulse (shown by red 1-2-3-4-5), which is wave A of Zig-zag.
Then price retraced to 38.2% forming wave B.
Currently, wave C is developing in ITC. The minimum fall for this is 61.8% extension, which is near the 459 level.
Remember that this is a minimum fall for any Zig-zag pattern.
If the price breaks 459 and starts trading below it, the target of 100%, which is near 438.85, will be achieved. (This also fulfills the Rule of Equality).
This analysis is based on Elliott Wave theory and Fibonacci.
This analysis is for educational purposes only.

XAUUSD wave analysisXauusd currently near the resistance of 2365-2370
Two scenario from here :
Bullish scenario :
XAUUSD after making low of 2286 moving 3-3-3 waves till now
(a) wave completed from 2286 to 2368 (moved in 3 zigzag move up)
(b) wave completed from 2368 to 2293 (moved in 3 zigzag move down)
now
(c) wave started from 2293 to till now made high near 2365 ( internal wave a=wave b target done .
wave (c) can be 3 zigzag move abc which seems completed or it can be 3-3-5 up move
if wave (c) is in 5 wave than upside target is 2393.
Bearish scenario:
XAUUSD after making low of 2286 than moving 3-3-3-3-3 waves in triangle pattern.
of which wave abc completed
and wave d can be down in zigzag move for target of 2320-2310
Note : if it is bullish than gold should not go below 2340.
for bearish scenario one should wait for sturcture to change from HH-HL TO LH-LL

Nifty 50 Index EWT 1Hrs Time FramesNifty 50 1hrs time frames analysis
Lets see ((iii)) wave and internal sub-wave (v) has completed the current situation of the wave cycle.
After the accomplishment of the complex Triple Zigzag W-X-Y-X-Z formation, the price has started an impulsive wave and it has broken the X wave.
X was holder the correction and breakout of X wave increased public participant in Nifty 50
Wave formation of the impulsive waves of wave ((V)).
Wave ((i)) is leading diagonal.
Wave ((ii)) is a zigzag correction abc retraced 0.382%.
Wave ((iii)) is a five impulse wave where sub-wave (v) have completed and extended 2.618% at 18358 of wave ((i))
price high 18350.
Sub-Wave of wave ((iii)) or internals wave are
wave (i) is an impulse
wave (ii) is a time correction and retraced 0.23% and consolidations near breakout of the channel (Zigzag W-X-Y-X-Z).
wave (iii) is a five impulse wave structure and extended 2.618% at 17948 of wave (i) price high 17943.
wave (iv) is flat abc correction C point truncate above A point and retraced 0.382% of wave (iii).
wave (v) is a five impulse wave where wave ((iii)) has completed 18350.
After the completion of Wave ((iii)) and internal wave (v)
The price stated the correction wave ((iv)). The question is how to know the corrective wave ((iv)) is started two confirmation see today prices break down of lower level of channel and close below the previous swing low or In this Wave Structure, every 3rd impulse wave internal or higher degree wave completed Fibonacci extension 2.618% on 1hrs time frames 3rd wave completed 18350. the requirement of correction for 4th wave it anticipates 0.382% 17776 or 0.618% 17420.
4th corrective may be Zigzag so cautious and keep in mind Wave X Breakout level acts as a Supporting level.
Next Time we Discuses about wave ((V)) or when complete wave ((iv)) what situation occurs in the next trading session.
Disclaimer
This is only for educational purposes before trade please advise your financial adviser.
Thanks our Teams

GBPUSD | The best price targets to climb📍Hello traders , GBPUSD in daily timeframe ,This analysis is prepared in daily timeframe but has been published for better view in 2 days timeframe.
In our count, we conclude that we are in a leading cycle, and that this cycle is probably related to a larger zigzag .
In this count, waves 1, 2 and 3 are finished and wave 4 is formed. Wave 4 is in the form of a zigzag , and from this zigzag , waves a and b are completed, and now we doubt whether wave c is complete or not.
We will have two scenarios:
Scenario 1 Completion of Wave C: If Wave C is completed, it will break the range between 1.35000 and 1.34000 upwards, confirming the start of Wave 5.
Second scenario incomplete of wave c: we assume that the count we had for wave b of this zigzag is not correct and wave b is two waves behind the current situation and these two waves are related to waves 1 and 2 of wave c.
So we conclude that waves 1, 2 and 3 are composed of wave c and now wave 4 will be formed in the sideways state.
🙏If you have an idea that helps me provide a better analysis, I will be happy to write in the comments🙏
❤️Please, support this idea with a like and comment!❤️

Triple Correction WXYXZ in Infosys# Elliot corrective pattern called Triple Correction WXYXZ.
Charecteristics:
1)It is a combination of 3 correction.(Flat 3-3-5,Zigzag 5-3-5,triangle 3-3-3-3-3)
2)Each correction is connected by a counter trending wave x(also takes a form an elliot correction).This wave X is sideways movement there by not correcting significantly prior movement.
3)This three correction can either be flat,zigzag and triangle or a combination of either.
As per Elliot generally after triple correction market gives an impulsive move.
Over here we are seeing combination of two zigzag(5-3-5) in the Primary wave W and wave Y and third correction is yet to be formed,this third correction can either take form of zigzag(5-3-5) or a triangle(3-3-3-3-3) to complete entire WXYXZ pattern on primary degree
Reason behind naming entire movement as an corrective pattern and not an impulse.
1)There's no significant corrective price movement retracing prior up movement by 38.2-50%.Generally after an 5 wave up move one impulsive cycle complete's following which we see deeper correction in prices (atleast 38.2-50% of prior 5 wave impulsive cycle).
2)After every 5 wave impulsive move following correction is only retracing prices by 23% of prior up move there by not following price alternation rule of Elliot wave 2 & wave 4.
Reason behind naming current movement WXYXZ triple correction and not WXY double correction.
1)If this was a double correction then post wave Y on primary degree we would have seen impulsive move unfolding on the down side.The sideways movement is indicating that we might be seeing wave Z on the upside in future.
Analysis:
Wave degrees:
Primary :Blue
Intermediate:White
Minor:Purple for impulse and yellow for correction.
Current count
Primary:second wave X
Intermediate:leg F of diametric pattern(Not labelled)
So far it seems like we have completed WXY wave on primary degree, and second connecting wave X is going on.Both the wave X has taken a form of diametric pattern(7 leg corrective pattern) hence currently we are in the 6th leg of second wave X,a drop in the form of 7th leg can come in near future as prices are approaching ATH levels post which we will third correction Z on the upside giving us a target of 2800+.
Ideal time for investment as per this count is to wait for a dip towards 1680-1700 zone which would complete 7th leg of wave X post which we could see reversal.
Disclaimer:I am posting this analysis for my future reference,positions should be build or exited on the basis of this analysis.
