Search in ideas for "zigzag"

wave c or wave 3.get long.WE HAVE 5 IMPULSIVE WAVE WITH LEADING DIAGONAL STRUCTURE WHICH IS FOLLOWED BY 3 CORRECTIVE WAVE WITH ABC ZIGZAG STRUCTURE AS FOLLOWS:
IMPULSE-5 CORRECTIVE 3
WAVE 1:124-183 WAVE A:223-201
WAVE 2:183-139 WAVE B:201-203(ALTHOUGH TOO SHALLOW)
WAVE 3:139-209 WAVE C:203-186
WAVE 4:209-188
WAVE 5:188-223
IDEALLY LEADING DIAGONAL OCCURS IN WAVE A OF ZIGZAG OR WAVE 1 OF HIGHER DEGREE IMPULSE.HENCE ANOTHER 5 WAVE IMPULSIVE STRUCTURE CAN TAKE PLACE FOR WAVE C(INCASE OF ZIGZAG) OR WAVE 3(INCASE OF WAVE 3) WHICH CAN TAKE PRICES TO 282-309(WAVE C) OR 347(WAVE 3).
NOW ON MONTHLY CHART LAST MONTH PRICE GAVE CLOSING ABOVE WAVE B HIGH OF 203,WHICH IN ITSELF IS BUY SIGNAL.AS OF NOW CMP IS 212-213 AND IN COMING DAYS IF PRICE CLOSES ABOVE 223 ANOTHER BUY SIGNAL WILL BE GENERATED AS WAVE 1/A BREAKOUT WILL OCCUR.
AS PER MY VIEW THIS BOUNCE IS WAVE 3(HOWEVER I AM NOT RULING OUT SCENARIO FOR WAVE C) BECAUSE OF FOLLOWING REASON
1)WAVE 2/B RETRACED ONLY 38.2% OF WAVE 1/A.THIS SHOWS THAT CORRECTION IS NOT DEEP AS IT SHOULD BE INCASE OF AN ZIGZAG WAVE B(61.8% OF WAVE A)
2)IF PRICE MANAGES TO CROSS 224 IN THIS MONTH THEN IT NOT ONLY MEANS THAT CORRECTION IS OVER BUT SUBSEQUENT MOVE IS AN IMPULSIVE 3RD WAVE OF HIGHER DEGREE AS DURING 3RD WAVE HIGH OF WAVE 1 IS TAKEN OUT IN LESSER TIME AS COMPARED TO THE TIME TAKEN BY WAVE 2 CORRECTION.NOW THIS IS YET OT HAPPEN BUT CHANCES OF THIS HAPPENING IS HIGH AS CMP IS 212 AND WAVE 1 HIGH IS 224(ONLY 12RS TO GO)
REASONS FOR GOING LONG IN THIS STOCK.
1)ON MOMENTUM FRONT:PRICE IS TRADING ABOVE 20 SMA ON MONTHLY,WEEKLY AND DAILY CHARTS ALONG WITH RAISING RSI ON ALL TIME FRAME.ON WEEKLY CHART RSI CROSSING 55 LEVEL WHICH IN ITSELF IS A SIGN OF STRENGHT.
2)AS PER DOW THEORY:PRICE IS MAKING HIGHER HIGH AND HIGHER LOW'S ON ALL TIME FRAME(MONTHLY,WEEKLY,DAILY)
3)AS PER ELLIOT WAVE THEORY:WAVE C OR WAVE 3 IN MAKING.
ENTRY,EXIT AND STOPLOSS LEVELS ARE MENTIONED IN CHART.
TRADE WISELY BY FOLLOWING RISK MANAGEMENT RULES.
DISCLAIMER:There is no guarantee of profits or no exceptions from losses. The study provided is solely the personal views of my research. You are advised to rely on your judgment while investing/Trading decisions. Past performance is not an indicator of future returns. Investment is subject to market risks. Seek help of your financial advisors before investing/trading.
I may or may not trade this analysis

Tata Power Can Go All time HighDaily Chart Pattern
Pattern Inside Pattern
Ascending Triangle Pattern
Zig Zag Pattern
Best Buy Above 105 After mini resistance
can go all time high or Near Resistance of all time high
I am not a SEBI registered adviser. All the information provided by me are for educational/informational purposes only. Never invest more then 2 % Capital In Single trade. Trade on your own Risk and analysis


Reliance Zig Zag CorrectionDISCLAIMER:There is no guarantee of profits or no exceptions from losses.
Technical analysis provided on the chart is solely the personal views of my research.
You are advised to rely on your own judgments while investing/Trading decisions.
Past performance is not an indicator of future returns. Investment is subject to market risks.
Seek help of your financial advisors before investing/trading.
--------------------------(((((LIKE)))))-----------------------------
2277 Invalidation level
2130 target deduced cause Z is usually equal to Y
supports 2200,2165

USDCHF COMPLETE ANALYSIS AS PER THE WAVE THEORY
We have a downward 5 Wave Impulse complete; this is a WAVE 1 and now there is a Correction forming;
This Correction has Wave A comeplete and Wave B is forming; we need to verify the Wave A and B in the Lower Degree;
So here We have explained Wave As subdividions Wave A is a 5 Wave upward Impulse Wave B is a Triangle and Wave C is a Ending Diagonal;
Here we have Wave B forming now in the downward direction; Wave A is a Leading diagonal Wave B is a Zigzag and now Wave C is forming
So here the WAVE B ends and now we wil encash the WAVE C which will be an Upward Wave;
Here Wave 3 is a Zigzag (Zigzag is also an Impulse) hence
In Wave B we have a Wave A which is a downward Leading Diagonal; Wave B is a upward Zigzag; We see Wave B has retraced Wave A by 93.93%, hence as per the rule of Flat Wave C has to be a downward Impulse;
So then Wave B retraces Wave A 38.2% hence from here starts the WAVE C which will be an Upward Impulse
We have 2 Trades here One is a SHort Trade and then where we have the Target of the SHort trade we have a Buy Trade from there;
Long Trade

NIFTY Currently sideways (EXPLAINED)
We have 5 Wave Upward Impulse completed and then we have a Correction forming; The 5 Wave Impulse structure is gonna be WAVE 1 of the Higher Degree and the Correction that is about to form will be the WAVE 2 in the Higher Degree;
Now this Correction that is forming is a Flat structure because Wave A is a Flat; Wave B is a Upward Zigzag,
We have Wave A complete and now Wave B is forming; In Wave B as I mentioned we have a Upward Zigzag hence we have an Upward Impulse which is Wave A then Wave B is a downward simple correction structure; now Wave C of the Zigzag is forming;
In the Wave C of the Zigzag we have Waves 1, 2, 3 complete and Wave 4 is currently forming which is a Complex Correction as the Wave 2 is a simple correction; Hence justified the Sideways movement in NIFTY;
Once this sideways movement is over we have a Wave 5 in the Upward direction.
Go long with ICICI bankReason
-Trend line support
-EMA 20 suppor
-Zig zag chart pattern
-Demand zone
Good move expected above the green cloud

NTPC : Completion of Leading DiagonalDear Readers,
A Leading Diagonal Pattern formation has been witnessed and looks to have completed in the stock of NTPC from its low price of 107.10 to its recent high price of 178.85. The same can be visible from the given chart as shown.
After the completion of this leading diagonal, the stock of NTPC seems to be in corrective zone and looks like forming a simple zigzag (5-3-5) corrective pattern, though it is too early to predict the possible corrective formation. However, at first look it looks to be forming the simple zigzag pattern.
The first leg, wave 'A', of this simple zigzag pattern, looks to have completed its first three waves, is about to complete or have completed it fourth wave and will complete its last wave five over next few days. A parrallel channel has been drawn to show the possible resistance and support point for making entry or exit.
Secondly, the stock is witnessing sideways movement as against the sharp fall in the third wave of wave 'A'. This indicates that the stock has little less interest of retracing this fall aggressively. The upper line of the parrallel channel may act as resistance line. A decisive breach of resistance line with sharp rise in price with volume, may negate the possibility of the zigzag formation.
The stock of NTPC can be sold/shorted at current price of 160 for the price targe of 154, 150 and 144 with stop loss of 167.

Decoding Nifty’s Correction: What Lies Ahead?Is Nifty poised for a deeper correction? And if so, why? Let’s look at it through the lens of Elliott Wave Theory.
Elliott Wave distinguishes between motive waves, which unfold in 5-wave structures, and corrective waves, which unfold in 3-wave patterns. Within a 5-wave move, waves 2 and 4 act as counter-trend corrections. In a 3-wave correction, wave B typically moves against the prevailing trend.
Corrective patterns can take the form of flats, zigzags, or triangles, each with its own character. There are rules for their formation. Interestingly, in bullish market, corrections often behave like a runaway bride in waves 2 and 4 —where they defy clean textbook expectations.
Now, after every 5-wave advance, a correction typically follows. The depth of this correction depends on whether the preceding 5-wave structure was part of a smaller swing or the completion of a larger trend.
So, what’s happening with Nifty?
It appears that Nifty has completed a FULL 5-wave advance. The correction from 15 May to 13 June is a flat correction as posted earlier, which followed the end of wave (iii). (I’ll post why it is end of wave (iii) in the comments section.
The next swing up (13 June to 30 June) also unfolded as a clear 5-wave move. If the correction is attributable only to this swing, then it will not go lower than the lower extreme of the swing.
If this upward leg marks end of wave 5 of a larger structure , then what we’re seeing now is a proper 3-wave corrective structure which will bring a decent retracement to the entire up move.
Typically, end points of larger moves can be validated using Fibonacci ratios—like comparing wave 0–3 to 4, or wave 2–3 to 4. In this case, no clear Fibonacci relationship appears, but that sometimes happens.
Now, here's the tricky part: corrective waves are the hardest to decode in Elliott Wave analysis. Markets often react to multiple retracement levels, making early predictions risky unless at least one leg of the correction is fully formed.
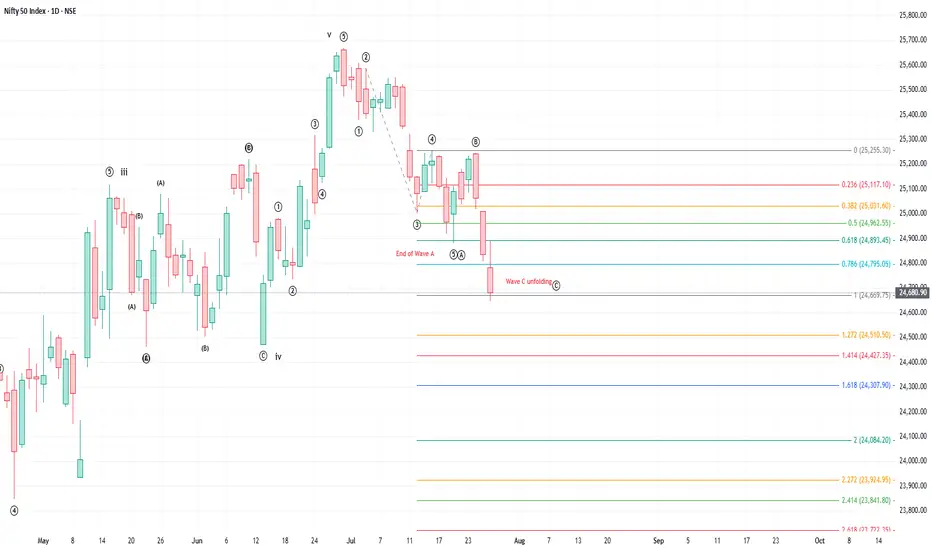
Looking at recent action:
The decline from 30 June to 21 July looks like a clean 5-wave down, suggesting a potential wave A. The bounce that followed fits well as a 3-wave move, likely wave B.
And now, Nifty seems to be forming wave C, unfolding rapidly with gap-downs and accelerated moves—a sign that the correction is still in play.
I’ll share more thoughts soon on Wave C as it unfolds in the comments section.
OFSS: Setting Up for a Relief Rally?🔍 Introduction
This analysis starts from the 1-hour timeframe, where price action shows signs of exhaustion at the tail end of a 5-wave decline. A classic ending diagonal in wave c, along with bullish RSI divergence, points toward a potential short-term reversal — possibly the start of Wave B in a larger A-B-C corrective structure. We then zoom out to place this setup within a broader W-X-Y correction that began from the 13,220 high.
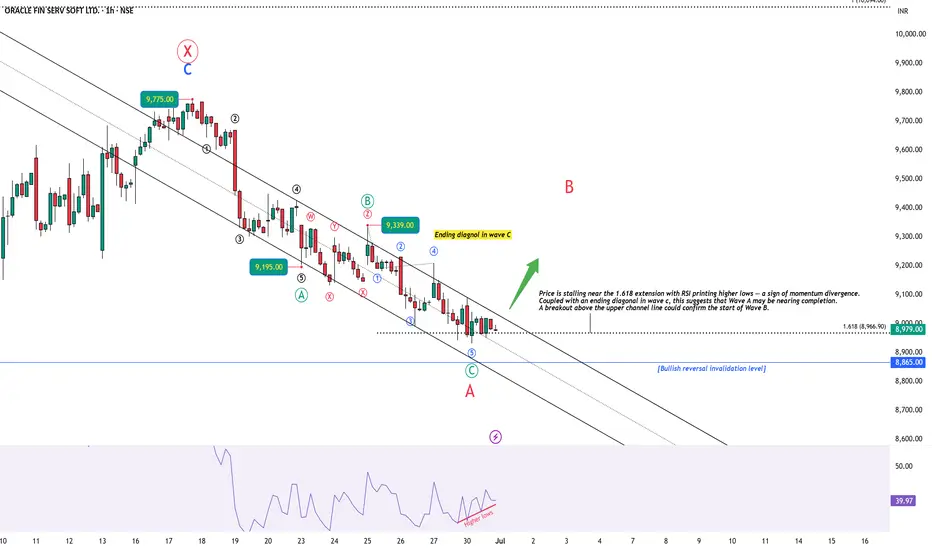
🕐 1H Chart: Ending Diagonal + RSI Divergence into Key Zone
Following the peak at 9775, price has been declining in what appears to be a ABC zigzag correction. Subwave 5 (within wave c) exhibits ending diagonal behavior, with overlapping internals and weakening thrust. Importantly, RSI has been printing higher lows, diverging strongly against lower price lows — a signal of potential bottoming.
Price is also testing the 1.618 Fibonacci extension level. A decisive breakout above the upper trendline would confirm a likely transition into Wave B.
🟢 Watching closely for a decisive breakout / close above the channel.
📆 Daily Chart: W-X-Y Structure from 13,220 High
Zooming out, ORACLE FIN SERV is unfolding a W-X-Y correction from its 13,220 high:
Wave W completed as a zigzag down to 7038.
Wave X unfolded as a zigzag rally, peaking at 9775. Notably, Wave C of X did not reach 100% of Wave A — signaling internal weakness.
Wave Y is now developing as a red A-B-C structure, with Wave A possibly ending near the 8930 level.
🧠 Conclusion & Key Levels to Watch
Wave A of Y appears to be nearing completion, supported by:
Ending diagonal structure in wave C (1H)
RSI bullish divergence
Price stalling at 1.618 extension
A breakout above the channel could mark the start of Wave B — potentially retracing 38–61.8% of the drop from 9775
📌 This setup offers both short-term and structural clues. I’ll post follow-ups as this unfolds.
⚠️ Disclaimer
This post is for educational purposes only and does not constitute financial advice. Please do your own research and manage risk appropriately.
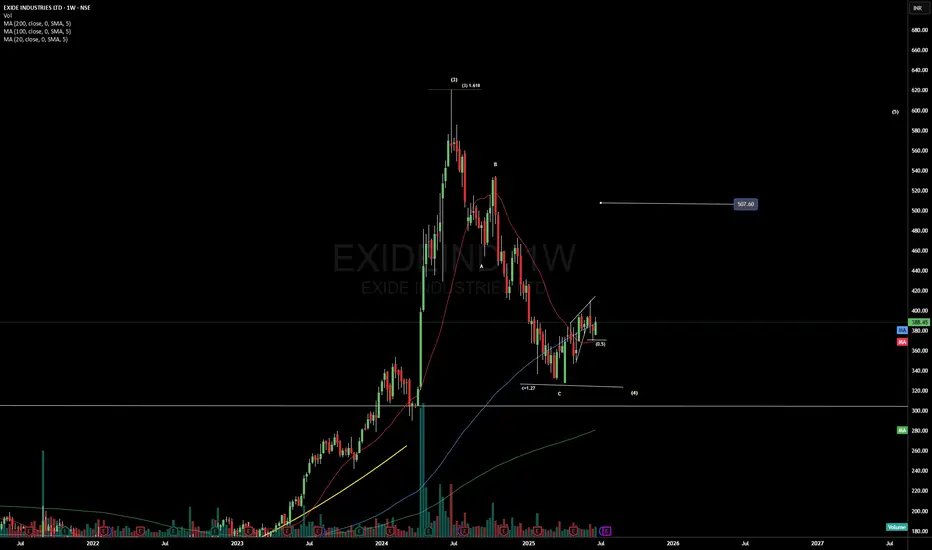
After steep correction - reversing with a leading diagonal Exide earlier formed a nice rounding bottom and moved to 600 levels which completed its up move and then completed the deep corrective move with a zigzag pattern at around 320, re-testing the neck of the rounded bottom / cup.
Currently it formed a leading diagonal (wave 1 or wave A) which indicates a good rally is in the offing. CMP is 388. Even wave 2 (B) also is done at 0.5 levels. This weeks candle closed above the hammer candle confirming the reversal and indicating that the rally is to continue.
Details below:
Though the 600 levels appear to be wave 3 and the correction expected was of wave 4. But such steep a correction is not expected in wave 4, especially after wave 2 corrected to 0.618 levels.
So I see 2 possibilities -
1. The 600 was wave 1 on a primary level and this current correction that corrected to almost 0.5 levels, could be wave 2. In that case we will be getting the next wave 3 which will take it to ATH and beyond.
2. The current correction is wave 4.
(a) - The correction of a zigzag got completed at around 320 levels, and its wave 5 in the making - in which case the min target is around 500 - even with a 5th wave failure.
(b) - The correction might continue to form a flat correction in which case too it has to touch 500 levels (0.618 of the zigzag for the B wave of flat).
So the tentative minimum levels expected is 500. And further clarity will emerge with its progress.
Disclaimer:
1. Not a trade recommendation but an analysis for learning.
2. I do not own this stock in my portfolio as of now.
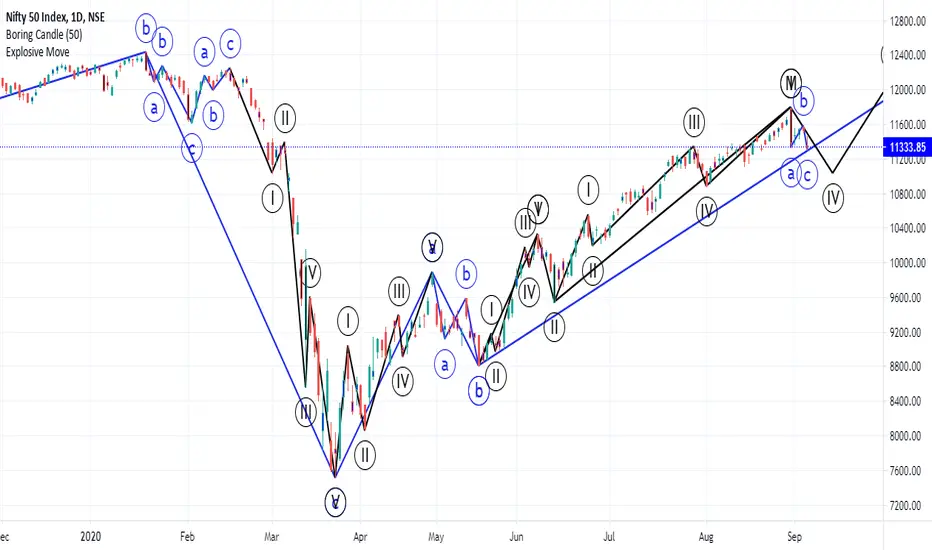
Elliott Wave Analysis: Nifty’s Final Corrective Leg UnfoldingOn October 31, I predicted that Nifty would enter a bearish phase based on my Elliott Wave Zigzag analysis. So far, the market has followed this pattern.
Currently, Nifty is in the final leg of its corrective phase. After reaching the 22,500–22,300 range, I expect it to complete its 5th corrective wave. The structure has played out in three key phases:
First Zigzag Pattern: Waves (i), (ii), (iii), (iv), (v)
ABC Correction Phase: A, B, C
Final Zigzag Pattern: Waves (i), (ii), (iii), (iv), (v)
As per my analysis, Wave (V) is close to completion, but some time correction is still pending, while the price movement has mostly aligned with expectations. Keep an eye on market signals for confirmation!

AUD/USD: A Third Wave "...Wonders to Behold..."Prices advanced in five waves from 0.6477 to 0.6667. This wave pattern is significant because impulse waves identify the direction of the larger trend. Thus, the five-wave advance in AUDUSD implies further buying to come that would push prices above 0.6667 as wave (iii).
The subsequent decline that is developing in three waves supports this analysis. Counter trend price action typically consists of three waves, so we expect another move up. Moreover, the three-wave decline travels to 0.6550 to retrace 61.8% of the previous impulsive advance. 61.8% is a common retracement for corrective waves especially when they occur as wave 2 of an impulse or wave B of a zigzag correction.
Also nearby is 0.6558, the price level at which wave c equaled wave a, which is a common Fibonacci relationship between wave C and A of zigzag correction.
Also adjacent is 0.6560, the end of the fourth wave of one lesser degree. As a guideline, corrections tend to end upon reaching the end of the previous fourth wave of one lesser degree.
Besides, the correction is unfolding as a Zigzag A-B-C with a triangle characteristic in the b wave position as is common. Also, the correction neatly adheres to the parallel channel with wave c hugging the lower boundary of the channel.
These cluster of evidence suggests that prices are approaching an important juncture and a reversal to the upside is on the horizon. If so, then a break above 0.6629 would virtually indicate the correction ended and the next significant move is to the upside.
Trading Plan
Entry : Buy at market.
Protective Stop : 0.6477; in an impulse wave 2 can NEVER retrace 100% of wave 1.
Target : 307 pips i.e ((0.6667-0.6477) X 1.618)
In an impulse, the third wave commonly travels 1.618 times the length of the
first.
Risk-to-Reward : 1:3

Part 1 - EUR/USD: Monthly Examination Utilizing Varied Approach
Price action Breakdown Analysis:
It is the EURUSD monthly timeframe, and it shows a downtrend for more than 15 years. The price has settled in a downward value area.
Elements of price action Breakdown:
Excess:
There are nine price excesses, four on the upper band and five on the lower band. It shows that the sellers were too aggressive when the price touched the upper band of the channel in comparison with the lower band at buyers. Buyers/Bulls tries makes the initiative to breakout the structure but end up when another party finds the price convenient for them.
Control line:
The control line represents the gravitational force to the price. The price can’t stay away until it breaks the range. There are twelve touches on the control line, and few are mentioned on the chart.
No Trading Activity Zone:
No trading activity is the zone where one party, either bull or bear, takes control and outnumbers the other. There are a total of 14 no-trading activities zone. Both of the participants have seen each other.
Sub-value area:
A rectangle sub-value area has taken place from March 2015 till now. An excess became a great place to buy the move, yet the upper band of the sub-value area provides strong resistance. The control line of this value area at 1.1480 is sharp enough to act as a pivot level. It could be a resistance to the current price.
Trend Justification:
Justification for the current market trend and the behavior of bulls and bears can be derived from four prominent lines on the chart.
Line 1, the lengthiest on the chart, connects the points from 1.5760 to the latest high at 1.2555. This line also intersects with the second line, indicating that a breakout in one line would likely trigger a simultaneous breakout in both lines.
Line 2 stands out as the most robust resistance line, evidenced by the price experiencing significant declines on more than three occasions upon reaching this line. Therefore, the continuation of the uptrend appears contingent upon a successful breakout above resistance line 2.
lliott Wave Projection:
According to Elliott wave analysis, the price has been undergoing a W-X-Y-X-Z formation, specifically identified as a triple zigzag, over a span of 15 years. The sequence involves the completion of wave (X) and the initiation of a downward impulsive wave denoted as (Z).
The Wave Formation unfolds as follows:
Wave (W): A flat correction pattern characterizes the formation of Wave (W).
Wave (X-1): Wave (X) takes shape in a standard zigzag formation, retracing 78.6% of Wave (W).
Wave (Y): This phase sees the construction of a zigzag pattern within Wave (Y), extended 1.618% of Wave (W)
Wave (X-2): Wave (X) materializes as an expanding triangle, retracing 50% of Wave (Y).
Wave (Z): The ongoing Wave (Z) is currently in progress, appearing to form sub-wave C. Notably, Wave (Z) has extended to 78.6% of Wave (Y).
For Bulls traders, a prudent entry point is identified as the breakout of Wave (X) at the level of 1.2349. No risky trader should initiate Long position until it breaks out Line 1 & Line 2.Wave (Y) = Wave (Z) at 0.8838. So, After the accomplishment of sub-wave B of wave (Z), traders can sell for final wave C of wave (Z).
Line 3, marked at 1.23427, serves as a horizontal resistance line. This line has played a crucial role, offering three supports and encountering two resistances. A substantial upward movement could potentially alter the overall trend post-breakout, given that it represents a lower high in the downward trend.
Line 4 represents a support level in close proximity to the current price, suggesting a potential stabilizing factor for the market at its current position.
Different pattern Formation:
Traders can see the following patterns on the monthly charts:
1. Wamine pattern
2. Contracting Triangle
3. Wave Diagonal
4. Expanding Triangle
5. ABCD Pattern
6. Moolahs pattern
We will Update Further information on weekly & Daily time frame soon.

#BANKNIFTY Weekly Overview#banknifty Triangle Formation on the lower time frame, high probability of #banknifty touching the falling trendline, before next move.
#learning:-
Contracting triangles are the most common type of triangle. When they’re in the fourth wave position, they predict an end to the entire trend with one more wave (fifth wave).
Rules (these are “hard” rules; they cannot be broken)
A triangle always subdivides into five waves.
At least four waves among waves A, B, C, D, and E each subdivide into a zigzag or zigzag combination.
Wave C never moves beyond the end of wave B, wave D never moves beyond the end of wave C. Wave E never moves beyond the end of wave D (sometimes the Dow reading at the end of a triangle subwave can exceed a previous subwave’s ending value by a small amount as the market approximates an equal level, as it does in ascending and descending triangles (barrier triangles)). (The result is that in the future in time, a line connecting the ends of waves B and D converges with a line connecting the ends of waves A and C.)
A triangle never has more than one complex subwave, which is always a zigzag combination.
Regards,
SG

BANKNIFTY INTRADAY FOR TOMORROWhave to see tomorrow market to see
whether it will be a B zigzag or
Impulsive
higher chance it will be zigzag and
if B is zigzag then we will see
impulsive wave C downside

ReefIt's hard to ignore the clear zigzags throughout this entire build since late January. I can see this is still going on. My macro view is still bullish. See lows are still possible

CANARA BANK bearish #Elliot_HarishRao CANARA BANK
--> Elongated Flat CORRECTION
Wave formations:
Wave (A,B,C) denoted circle black colour
Wave A ==> inner wave (a,b,c)
Wave b ==> inner wave (a,b,c)
Wave c ==> inner wave (1,2,3,4,5)
Rules and objectives
Elongated Flat:
If the c-wave is more than 138.2% of
wave- b, the market is forming an
Elongated Flat
The Elliott Wave Principle, or Elliott wave theory, is a form of technical analysis that finance traders use to analyze financial market cycles and forecast market trends by identifying extremes in investor psychology and price levels, such as highs and lows, by looking for patterns in prices.
Ralph Nelson Elliott (1871–1948), an American accountant, developed a model for the underlying social principles of financial markets by studying their price movements, and developed a set of analytical tools in the 1930s. He proposed that market prices unfold in specific patterns, which practitioners today call Elliott waves, or simply waves. Elliott published his theory of market behavior in the book The Wave Principle in 1938, summarized it in a series of articles in Financial World magazine in 1939, and covered it most comprehensively in his final major work, Nature's Laws: The Secret of the Universe in 1946. Elliott stated that "because man is subject to rhythmical procedure, calculations having to do with his activities can be projected far into the future with a justification and certainty heretofore unattainable."
he Elliott Wave Principle states that markets grow from small price movements by linking Elliot wave patterns to form larger five-wave and three-wave structures that exhibit self-similarity, applicable on all timescales. Each level of such timescales is called the degree of the wave, or price pattern. Each degree of waves consists of one full cycle of motive and corrective waves. Waves 1, 3, and 5 of each cycle are motive in character, while waves 2 and 4 are corrective. The majority of motive waves assure forward progress in the direction of the prevailing trend, in bull or bear markets, but yielding an overall principle of growth of a market.
The overall movement of a wave one degree higher is upward in a bullish trend. After the initial five waves forward and three waves of correction, the sequence is repeated on a larger degree and the self-similar fractal geometry continues to unfold. The completed motive pattern comprises 89 waves, followed by a completed corrective pattern of 55 waves.
Each degree of a pattern in a financial market has a name. Practitioners use symbols for each wave to indicate both function and degree. Numbers are used for motive waves, and letters for corrective waves (shown in the highest of the three idealized series of wave structures or degrees). Degrees are not strictly defined by absolute size or duration, by form. Waves of the same degree may be of very different size or duration.
While exact time spans may vary, the customary order of degrees is reflected in the following sequence:
Grand supercycle: multi-century
Supercycle: multi-decade (about 40–70 years)
Cycle: one year to several years, or even several decades under an Elliott Extension
Primary: a few months to two years
Intermediate: weeks to months
Minor: weeks
Minute: days
Minuette: hours
Subminuette: minutes
Some analysts specify additional smaller and larger degrees.
Wave personality and characteristics
Elliott wave analysts (or Elliotticians) hold that each individual wave has its own signature or characteristic, which typically reflects the psychology of the moment. Understanding those personalities is key to the application of the Wave Principle; they are defined below. (Definitions assume a bull market in equities; the characteristics apply in reverse in bear markets.)
Five wave pattern (dominant trend) Three wave pattern (corrective trend)
Wave 1: Wave one is rarely obvious at its inception. When the first wave of a new bull market begins, the fundamental news is almost universally negative. The previous trend is considered still strongly in force. Fundamental analysts continue to revise their earnings estimates lower; the economy probably does not look strong. Sentiment surveys are decidedly bearish, put options are in vogue, and implied volatility in the options market is high. Volume might increase a bit as prices rise, but not by enough to alert many technical analysts. Wave A: Corrections are typically harder to identify than impulse moves. In wave A of a bear market, the fundamental news is usually still positive. Most analysts see the drop as a correction in a still-active bull market. Some technical indicators that accompany wave A include increased volume, rising implied volatility in the options markets and possibly a turn higher in open interest in related futures markets.
Wave 2: Wave two corrects wave one, but can never extend beyond the starting point of wave one. Typically, the news is still bad. As prices retest the prior low, bearish sentiment quickly builds, and "the crowd" haughtily reminds all that the bear market is still deeply ensconced. Still, some positive signs appear for those who are looking: volume should be lower during wave two than during wave one, prices usually do not retrace more than 61.8% of the wave one gains, and prices should fall in a three wave pattern. Wave B: Prices reverse higher, which many see as a resumption of the now long-gone bull market. Those familiar with classical technical analysis may see the peak as the right shoulder of a head and shoulders reversal pattern. The volume during wave B should be lower than in wave A. By this point, fundamentals are probably no longer improving, but they most likely have not yet turned negative.
Wave 3: Wave three is usually the largest and most powerful wave in a trend (although some research suggests that in commodity markets, wave five is the largest). The news is now positive and fundamental analysts start to raise earnings estimates. Prices rise quickly, corrections are short-lived and shallow. Anyone looking to "get in on a pullback" will likely miss the boat. As wave three starts, the news is probably still bearish, and most market players remain negative; but by wave three's midpoint, "the crowd" will often join the new bullish trend. Wave three often extends wave one by a ratio of 1.618:1. Wave C: Prices move impulsively lower in five waves. Volume picks up, and by the third leg of wave C, almost everyone realizes that a bear market is firmly entrenched. Wave C is typically at least as large as wave A and often extends to 1.618 times wave A or beyond.
Wave 4: Wave four is typically clearly corrective. Prices may meander sideways for an extended period, and wave four typically retraces less than 38.2% of wave three (see Fibonacci relationships below). Volume is well below that of wave three. This is a good place to buy a pullback if you understand the potential ahead for wave 5. Still, fourth waves are often frustrating because of their lack of progress in the larger trend.
Wave 5: Wave five is the final leg in the direction of the dominant trend. The news is almost universally positive and everyone is bullish. Unfortunately, this is when many average investors finally buy in, right before the top. Volume is often lower in wave five than in wave three, and many momentum indicators start to show divergences (prices reach a new high but the indicators do not reach a new peak). At the end of a major bull market, bears may very well be ridiculed (recall how forecasts for a top in the stock market during 2000 were received).
Pattern recognition and fractals
Elliott's market model relies heavily on looking at price charts. Practitioners study developing trends to distinguish the waves and wave structures, and discern what prices may do next; thus the application of the Wave Principle is a form of pattern recognition.
The structures Elliott described meet the common definition of a fractal (self-similar patterns appearing at every degree of trend). Elliott wave practitioners argue that just as naturally occurring fractals often expand and grow more complex over time, the model shows that collective human psychology develops in natural patterns, via buying and selling decisions reflected in market prices: "It's as though we are somehow programmed by mathematics. Seashell, galaxy, snowflake or human: we're all bound by the same order." Critics, however, argue it is a form of pareidolia.
Wave rules and guidelines
A correct Elliott wave count must observe three rules:
Wave 2 never retraces more than 100% of wave 1.
Wave 3 cannot be the shortest of the three impulse waves, namely waves 1, 3 and 5.
Wave 4 does not overlap with the price territory of wave 1, except in the rare case of a diagonal triangle formation.
A common guideline called "alternation" observes that in a five-wave pattern, waves 2 and 4 often take alternate forms; a simple sharp move in wave 2, for example, suggests a complex mild move in wave 4. Alternation can occur in impulsive and corrective waves. Elliott observed that alternate waves of the same degree must be distinctive and unique in price, time, severity, and construction. All formations can guide influences on market action. The time period covered by each formation, however, is the major deciding factor in the full manifestation of the Rule of Alternation. A sharp counter-trend correction in wave 2 covers a short distance in horizontal units. This should produce a sideways counter-trend correction in wave 4, covering a longer distance in horizontal units, and vice versa. Alternation provides analysts a notice of what not to expect when analyzing wave formations.
Corrective wave patterns unfold in forms known as zigzags, flats, or triangles. In turn these corrective patterns can come together to form more complex corrections. Similarly, a triangular corrective pattern is formed usually in wave 4, but very rarely in wave 2, and is the indication of the end of a correction.
Fibonacci relationships
R. N. Elliott's analysis of the mathematical properties of waves and patterns eventually led him to conclude that "The Fibonacci Summation Series is the basis of The Wave Principle". Numbers from the Fibonacci sequence surface repeatedly in Elliott wave structures, including motive waves (1, 3, 5), a single full cycle (8 waves), and the completed motive (89 waves) and corrective (55 waves) patterns. Elliott developed his market model before he realized that it reflects the Fibonacci sequence. "When I discovered The Wave Principle action of market trends, I had never heard of either the Fibonacci Series or the Pythagorean Diagram".
The Fibonacci sequence is also closely connected to the Golden ratio (1.618). Practitioners commonly use this ratio and related ratios to establish support and resistance levels for market waves, namely the price points which help define the parameters of a trend. See Fibonacci retracement.
Finance professor Roy Batchelor and researcher Richard Ramyar, a former Director of the United Kingdom Society of Technical Analysts and formerly Global Head of Research at Lipper and Thomson Reuters Wealth Management, studied whether Fibonacci ratios appear non-randomly in the stock market, as Elliott's model predicts. The researchers said the "idea that prices retrace to a Fibonacci ratio or round fraction of the previous trend clearly lacks any scientific rationale". They also said "there is no significant difference between the frequencies with which price and time ratios occur in cycles in the Dow Jones Industrial Average, and frequencies which we would expect to occur at random in such a time series".
Robert Prechter replied to the Batchelor–Ramyar study, saying that it "does not challenge the validity of any aspect of the Wave Principle...it supports wave theorists' observations", and that because the authors had examined ratios between prices achieved in filtered trends rather than Elliott waves, "their method does not address actual claims by wave theorists". Prechter also claimed through the Socionomics Institute, of which he is the executive director, that data in the Batchelor–Ramyar study show "Fibonacci ratios do occur more often in the stock market than would be expected in a random environment".
Extracted from the same relationship between Elliott Waves and Fibonacci ratio, a 78.6% retracement level is identified as the best place for buying or selling (in continuation to the larger trend) as it increases the risk to reward ratio up to 1:3.
It has been suggested that Fibonacci relationships are not the only irrational number based relationships evident in waves.
After Elliott
Following Elliott's death in 1948, other market technicians and financial professionals continued to use the Wave Principle and provide forecasts to investors. Charles Collins, who had published Elliott's "Wave Principle" and helped introduce Elliott's theory to Wall Street, ranked Elliott's contributions to technical analysis on a level with Charles Dow.
Hamilton Bolton, founder of The Bank Credit Analyst, also known as BCA Research Inc., provided wave analysis to a wide readership in the 1950s and 1960s through a number of annual supplements of market commentary. He also authored the book "The Elliott Wave Principle of Stock Market Behavior".
Bolton introduced the Elliott Wave Principle to A.J. Frost (1908-1999), who provided weekly financial commentary on the Financial News Network in the 1980s. Over the course of his lifetime Frost's contributions to the field were of great significance and today the Canadian Society of Technical Analysts awards the A.J. Frost Memorial Award to someone each year who has also made a significant contribution to the field of technical analysis.
The first A.J. Frost Memorial Award was awarded to Robert Prechter in 1999, with whom Frost co-authored the Elliott Wave Principle in 1978.
Adoption and use
Robert Prechter found Elliott's work while working as a market technician at Merrill Lynch. His prominence as a forecaster during the bull market of the 1980s brought wide exposure to Elliott's work. Prechter remains the most widely known Elliott analyst.
Among market technicians, wave analysis is widely accepted as a component of trade. The Elliott Wave Principle is among the methods included in the exam that analysts must pass to earn the Chartered Market Technician (CMT) designation, a professional accreditation developed by the CMT Association.
Robin Wilkin, Ex-Global Head of FX and Commodity Technical Strategy at JPMorgan Chase, says "the Elliott Wave Principle ... provides a probability framework as to when to enter a particular market and where to get out, whether for a profit or a loss."
Jordan Kotick, Global Head of Technical Strategy at Barclays Capital and past President of the Market Technicians Association, has said that R. N. Elliott's "discovery was well ahead of its time. In fact, over the last decade or two, many prominent academics have embraced Elliott's idea and have been aggressively advocating the existence of financial market fractals." One such academic is the physicist Didier Sornette, professor at ETH Zurich. In a paper he co-authored in 1996 ("Stock Market Crashes, Precursors and Replicas") Sornette stated,
It is intriguing that the log-periodic structures documented here bear some similarity with the "Elliott waves" of technical analysis ... A lot of effort has been developed in finance both by academic and trading institutions and more recently by physicists (using some of their statistical tools developed to deal with complex times series) to analyze past data to get information on the future. The 'Elliott wave' technique is probably the most famous in this field. We speculate that the "Elliott waves", so strongly rooted in the financial analysts' folklore, could be a signature of an underlying critical structure of the stock market.
Technical Analysis of Stock Trends and The Elliott Wave Theorist both give very specific and systematic ways to approach developing great reward/risk ratios for entering into a business contract with the marketplace, which is what every trader should be if properly and thoughtfully executed.
Glenn Neely, financial market analyst and author of the book Mastering Elliott Wave , studied the Elliott Wave Principle for years and used it to develop a forecasting method by expanding on the concepts Elliott created in the 1930s.
Researchers at the Technical University of Crete found that using a neuro-fuzzy system based on the Elliott wave principle delivered returns between 9.14% and 39.05% higher than a buy-and-hold strategy when using a hypothetical 10,000 € portfolio.
Criticism
Benoit Mandelbrot, who developed mathematical models of market pricing based on fractal geometry, expressed caution about the validity of wave models:
But Wave prediction is a very uncertain business. It is an art to which the subjective judgment of the chartists matters more than the objective, replicable verdict of the numbers. The record of this, as of most technical analysis, is at best mixed.
Robert Prechter had previously stated that ideas in an article by Mandelbrot "originated with Ralph Nelson Elliott, who put them forth more comprehensively and more accurately with respect to real-world markets in his 1938 book The Wave Principle."
Critics warn the Wave Principle is too vague to be useful since practitioners cannot consistently identify the beginning or end of waves, resulting in forecasts prone to subjective revisions. Technical analyst David Aronson wrote:
The Elliott Wave Principle, as popularly practiced, is not a legitimate theory, but a story, and a compelling one that is eloquently told by Robert Prechter. The account is especially persuasive because EWP has the seemingly remarkable ability to fit any segment of market history down to its most minute fluctuations. I contend this is made possible by the method's loosely defined rules and the ability to postulate a large number of nested waves of varying magnitude. This gives the Elliott analyst the same freedom and flexibility that allowed pre-Copernican astronomers to explain all observed planet movements even though their underlying theory of an Earth-centered universe was wrong.
Some analysts consider the Elliott Wave Principle as too dated to be applicable in today's markets, as explained by market analyst Glenn Neely:
Elliott wave was an incredible discovery for its time. But, as technologies, governments, economies, and social systems have changed, the behavior of people has also. These changes have affected the wave patterns R.N. Elliott discovered. Consequently, strict application of orthodox Elliott wave concepts to current day markets skews forecasting accuracy. Markets have evolved, but Elliott has not.
See also

Hero MotoThese Zigzag corrective Complex formations are M-C-M-C-M or 5-3-5-3-5
Hero moto Correct 36% from 52 weeks high 1) it made Zigzag formation WXYXZ. 2) wave W is Motive wave internals is 12345. 3) Wave 1stX is a corrective and correct 0.382% of wave W internals are abc. 4) Wave Y is Motive wave Internals is 12345. 5) Wave 2ndX is again a corrective wave (0.618%) of wave Y internals are abc. 6) Wave Z is the Motive wave and extended or Targeted Price 1.618% price move this area it is ending point of Zigzag correction and starting point of new impulsive wave 7) Confirmation when price cross previous swing high and sustain 4 days then price blast. if anybody invest in hero moto for a long time buy in every dip 8) last point explanation for long time investors price correct motive wave or Impulsive wave 0.618% on a Higher degree which is complete 2295 price turn around 2310
Disclaimer
This is only for Educational purposes before investment please advise your financial adviser .

WXY:Start of second correction wave YBajaj Auto post covid low's in March 2020,has been raising in an corrective manner there by forming WXY double correction.Of this WXY we are done with wave W and wave X,and wave y has begun just before 2 days when it broke past 3372 wave 4 peak.
Wave W:zigzag
Wave X:zigzag
Wave Y:Zigzag(however not clear as of now)
So far we cannt conclude which form wave y will take but minimum target for wave y is coming at 4600,hence one can go long woth wave x low's of 3050 as stop-loss and 4600 as initial target.CMP is 3436 one can go long at cmp and should keep adding till 3200 at every 3% dip from current levels.
Disclaimer:This are just my views on the stocks,position should not be build on its basis,i am posting this just for my future reference.

Tatamotor in corrective wave - Short?
Currently, Looking at structure of "Weekly continuation Chart" with all-time high 606. I'm want to call your attention little bit about picture "Corrective Phase A,B, and C" which is already completed. We have had a long run here right from the "low 63.5" back in 2020. It appears to be "motive phase(1,2,3,4 and 5 waves)" or "ABC corrective phase".
Wave ((A))=Wave ((C)) at 567 - recent high 537
OR
Let's look at lower 2D-TF for another scenario as "motive-phase".
it looks like we're making side-wave structure here and I'm trying to analyze correction to see if we had potential further downside or maybe the correction was over. I've showed in chart zigzag W,X and Y which i interpreted as wave X at 443, B at 506 and followed by zigzag downward for wave Y that I'm considering going "Short Tatamotors".
Before taking action short side, we have to consider couple other things there is chance to move upward. if the price move 500 +, this WYZ zigzag is invalid.
