Elliott wave analysis # up-trend started and its possibilitiesHere I discussed current waves and its possibilities. It is very clear that the correction from Feb'21 was completed as triple-zigzags correction and new impulse wave started.
Mar'20 low to now:
2008 low to now:
Search in ideas for "zigzag"

Elliott wave analysis # up-trend starts hereWave 4 (the impulse started from Mar'20 low) was completed as triple-zigzags correction and wave 5 is in progress. Now wave (iii) of 5 starts.
Disclaimer: This is just my personal view. You are advised to rely on your own analysis while taking trading decisions.

Elliott wave analysis # correction completed !!Wave 4 (the impulse started from Mar'20 low) was completed as triple-zigzags correction and wave 5 is already started.
Disclaimer: This is just my personal view. You are advised to rely on your own analysis while taking trading decisions.

Nifty Elliott wave update for 30march 2021 onwardFrom 15431 it seems like a complex correction is going on where,
15431-14467 1st abc
14467-15336 link wave(X) as double zigzag
15336-14264 2nd abc
At 14573 nifty completed double zigzag correction.
Now trading above 14500 is a positive sign for nifty and it may go for new high unless this correction will turn into triple zigzag correction.

Long This scrip is highly volatile , due to which i had to switch to Ranko Bar , Box size of 225 Points
the scrip has corrected and moved out form Ending diagonal , One can visually identify that the down move pattern is zig zag and usually
ZigZag are reflective in nature
What i mean is if down move is in ZigZag the up side move is very high likely Zigzag move with 100 % movement in the price
on daily its still bearish sign but i do look the noiseless chart its clearly showing its about to make turn around
One can position Long in future contract ( Preferably March ) for next up side move
Book using trailing stop on daily low basis
Good luck

Nifty Elliot Wave Analysis - Part 3 - We see the outcomeLet us analyse Nifty further drilled down - after Part 1, Part 2 series of analysis
Outcome from this analysis :
1. We have not yet gone back and corrected anything from previous Part 1, Part 2. It is a continuation. We understand now in Part 3 analysis that the previous markings needs correction, but we will look them again later.
2. Part 1, part 2 all shown the Leading diagonal which is most interesting. Yes we already knew when part 1 was made. But we are analysing one after another.
The prized result - We got the Leading Diagonal.
Analysis
------------------------
We are doing analysis from 12103 top.
The subwave 1 was made with zigzag correction
The subwave 2 was made with zigzag correction
From (c) to 2 is a double zigzag correction.
Check the marking X, we are analysing this part down. From 11980 where (c) and 2? are marked.
We found our (a) subwave at 11464. We got (b) at 11706. The subwave (c) is in the making going further down. We are analysing now this part.
We found (i), (ii), (iii), (iv) properly. The (v) subwave is in the making. Let us analyse this down.
When (v) started forming, the expectation was that it could be making a leading diagonal. We were expecting a diagonal here as we wanted the big downmovement to slow down.
If we see the parts of the diagonal, it was bringing idea of diagonal from 19th onwards.
See the leg 1,2,3,4,5 of the diagonal. 1,2,3,4 is made, 5 is in the making
What is the outcome from this ?
1. A leading diagonal is made when it is going to cancel the previous long correction/movement/change
2. Here the change is ? we are facing a bear trend from sometime. Should this diagonal brings us relief that the trend is complete ?
3. We need to analyse further to confirm correction - trend completion.
Happy Trading.
Previous posts
-----------------------
1. Part 2 of analysis
2. Part 1 of analysis

Nifty Elliott wave analysis for 26th june 2019Decline from life time high 12102 is seems to be corrective and looks like double zigzag in which 12102-11770 as first abc, 11770-12000 as X and 12000-11625 as second abc. Now If correction is completed at 11625 as double zigzag then we will see new high above 12102 OR pattern could also turn in to Triple zigzag(In which one more low below 11625 is possible from 11870-11921 range). As of now nifty needs to bounce in the range of 11870-11921. and from there we will see further possibilities which explained above.

AAPL Apple stocks sitting on edge of a cliffhey guys welcome to an update of apple stocks prices, as you guys can already see that we've seen a massive decline in AAPL prices from oct 2018 and may 2019 and with the current price movement looks like apple is now entering in wave c of a zigzag correction, as you see from charts prices decline heavily from 234 in oct 2018, and forms support at 142 in jan 2019, here we also get 200 weekly SMA support, prices exactly bounce from this level and rallied upto 215, here we have also fib786 resistance, this shows the property of wave B in ABC simple zigzag corrective pattern where wave B normally retraces 78.6% of wave A.
so from this principle most likely we're now entering in wave C which could lead us to lower levels.
a normal wave c in a zigzag correction could travel upto 100-127.2% of wave A which in this case goes upto 125 and 100 dollar level respectively and wave goes in the formation of 5 sub waves.
in above chart you can see that wave 1 has already completed and now wave 2 is in the process which could go upto 198 in short term, meanwhile wave 2 could also go upto 100% of wave 1 but not more than that, which in this situation is 215 level, so its better to keep our stop loss slightly above this, i'll recommend from 217-220 is a good level to place your stops.
if wave 2 rejects from fib618 around 198-200 which is most likely than wave 3 could go upto 161.8% of wave 1, around 130-120 level, meanwhile we could also see a double bottom formation around 142 level where we made the previous low or the bottom of wave 1, but most likely bulls will fail here coz wave 3 will be the most impulsive, than wave 4 could go upto 38.2% of wave 3, around 155-160 level and finally we could see the wave 5 driving prices lower around 100-95 dollar level.
but before you jump to short apple stocks, let me clear that this complete analysis is based on elliot wave theory and there's no guarantee for this price action, apple is the biggest player and it needs huge huge fud and massive selling for this kind of price action which could wipe out billions of dollar from the market.
but hey there's also a good news for bears and that's massive fud ahead,
Bloomberg: "Apple Must Face iPhone App Antitrust Suit, Supreme Court Rules"
devil's laugh ;)
Short AAPL
Entry 195-200
T1 145
T2 130
T3 100
SL 217-220

ETH Bearish vs Bullish playThere is a lot of zigzags and choppy price action in crypto for the last couple of weeks. In general it says that we are in corrective territory. The main question is were are we going first, base on 4H chart. This is my first public post, so please be mercy to me in my comment section.
Have a profitable play, cheers.
E1

RELIANCE - DECEMBER 2018 VIEWRELIANCE SEEMS TO BE MAKING A ZIGZAG CORRECTION IN WHICH WAVE A ENDED AT 1016. THE B WAVE IS A AGAIN A ZIGZAG CORRECTION. C WAVE OF THIS B WAVE SEEMS TO BE AN ENDING DIAGONAL, WHICH GIVES US A TARGET OF 1070, WHICH SHOULD BE REACHED LATEST BY 10 DECEMBER 2018 AND SINCE THIS IS A ZIGZAG CORRECTION, THE FINAL TARGET IS THE END OF WAVE A, I.E. 1016.7.
RELIANCE HAS ALSO MADE HEAD & SHOULDER PATTERN IN SMALLER TIMEFRAME, WHICH GIVES A MINIMUM TARGET OF 1141.5.
CONCLUSION
RELIANCE CAN BE SHORTED WITH A STOPLOSS OF 1210.15 WITH TARGETS OF 1141.5, 1070.5 AND 1016.7.
STOPLOSS CAN BE MODIFIED IN DUE COURSE BASIS THE CHART FORMATION AT THAT POINT IN TIME

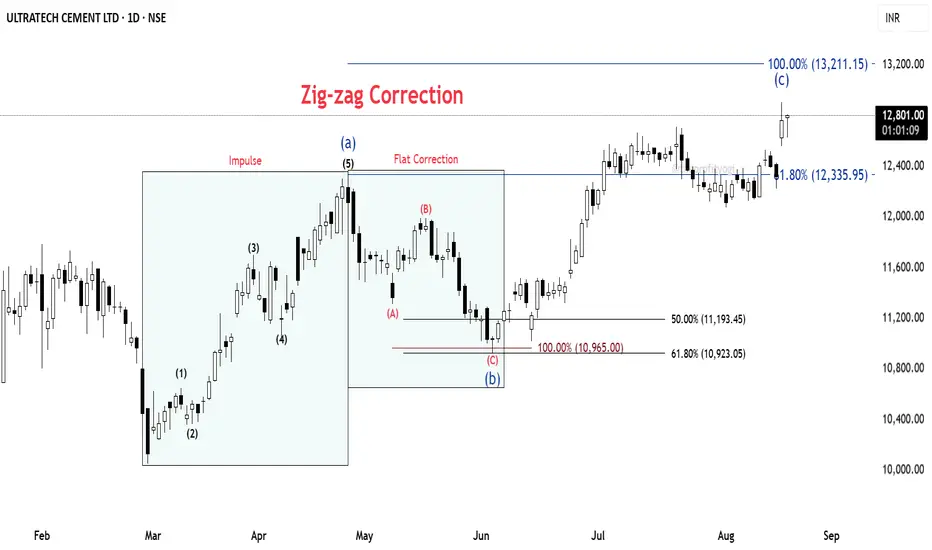
ULTRACEMCO: Wave C started from strong Fib clusterULTRACEMCO – Daily Chart Analysis
🔹 Base Point: The count begins from the low made on 3rd March 2025.
🔹 From this low, the price moved up in the form of a clear impulse wave, completing a 5-wave structure.
🔹 This was followed by a corrective fall, retracing 61.8% Fibonacci of the prior impulse.
⚡ Correction Phase:
The decline is counted as an ABC Flat correction (red).
Within this, the C wave extended fully to the 100% Fibonacci projection.
At this point, we observe a strong cluster zone formed by the 61.8% retracement and 100% extension, indicating confluence and potential support.
📈 Current Development:
From this support, the price has begun to move up again, showing the characteristics of a fresh impulse.
The overall structure fits into a larger Zig-Zag correction, where Wave C is still under development.⏳
📝 Summary:
✅ Impulse up (5 waves)
✅ Flat correction (A-B-C) complete at Fib cluster
🚀 Wave C of Zig-Zag unfolding
#ULTRACEMCO #NSEStocks #ElliottWave #Fibonacci #WaveAnalysis #TradingSetup #PriceAction
DOW JONES PREDICTIONWhy analysis of DJI?
It is mostly seen that Indian markets follow US markets as FII infuse lot of investment in our markets. However there psychology is to follow the trend in US markets. However it is not entirely true as Indian markets do spring to life and at times do there own trajectories. eg In end Sep DJI touched its pre Covid levels of 28700, however Indian markets were at 15300 much away from pre COVID levels of 12400.
However the similarities of market structures can't be ignored, both of the indexes had a similar structures of HH/HL & LL/LH. In a globalised world the interconnected things can be easily seen. Whats next?
On monthly chart DJI has formed a flag pattern with two point touch at the bottom of flag around 31500.
Twin Trendline Concept
First Trendline. On weekly charts, following twin trendline and four point touch concept is elucidated on the chart. The first trendline clearly shows touch points at apr 22, aug 22 & oct 22. Thereafter at fourth touch point Nov 22 there was a breakout seen and DJI made a high of 34800. The first trendline also has acted as support twice in Dec22 and mar 23.
Second Trendline. The touch points occurred at 34800 in Dec 22, 34300 Feb 23 & going by the geometry the fourth touch Pont should happen in Apr 23 at 34000 levels.
This will entail a 2200 point move from current 32717 to 34000 levels. Of course this will be not a straight move but it will have some zigzags.
Price action.
Montly charts - Flag patterns
Weekly Charts - Two consecutive Green Candles
daily charts - W structure which is a bullish structure is underway.
Future Likelyhoods. There may be reaction at fourth touchpoint and thereafter in May/Jun there will be breakout to touch the top of box 37200.
RSI analysis. On monthly charts RSI is above 50 levels, on weekly charts it is 48 and daily charts at 51. RSi is supporting an upmove.
Overall Analysis. DJi should touch 34000 levels based on price action, price pattern, twin trendline concept and RSI. However any crisis emerging at geo-political levels at economic or military will negate this hypotheses and DJI may head southwards.
Modelling and simulation are important to predict the future movements. However they will always remain prediction with no certainties. Markets like GOD have their own ways which are difficult to fathom. But human endeavour must continue for TOMMOROW is always ANOTHER DAY!
Views Welcome.
Regards

Infosys in Trouble along with All Tech stocksInfosys is in Zig zag correction after making top near 1955. The Rally from covid low ends in 5 waves near 1955.
Currently in Wave C which can head up to 1073 and worst case 700 which is 1.618 extension.
Analysis invalidation level will be 1620.
The LAST Time we analyzed it, moved as per chart
DISCLAIMER:
There is no guarantee of profits or no exceptions from losses.
The stock and its levels discussed are solely the personal views of my research.
You are advised to rely on your judgement while investing/Trading decisions.
Seek help of your financial advisor before investing/trading.
Investment Warnings:
We would like to draw your attention to the following important investment warnings.
-Investment is subject to market risks.
-The value of shares and investments and the income derived from them can go down as well as up.
-Investors may not get back the amount they invested - losing one's shirt is a real risk.
-Past performance is not a guide to future performance.
-I may or may not trade this analysis
--------------------------(((((LIKE)))))-------------------------------

Dear Nifty, Watch out for JanuaryA beautiful expanding diagonal appears to be developing in the nifty from the 1st december top at 18887. The fall on the 23rd december culminates into wave 3 of the diagonal and the current weeks rally would then be wave 4. The Zigzagish behaviour of the 2 falls are clearly visible.
If correct, this rally will be subsequently fully retraced to the downside as wave 5 is the most brutal in an expanding diagonal. Friday may well mark the end of wave 4. Nifty targets of 17200 and lower possible.


Shyam Metalics out of Falling channelShyam Metalics and Energy seems to have completed ABC zig zag correction at 300 and came out of channel.
Channel breakout confirmed after it crossed 338 and while coming out formed rising wedge pattern or leading diagonal pattern.
Leading diagonal are found at start of new trend.
DISCLAIMER:There is no guarantee of profits nor exceptions from losses.
Technical analysis provided on the chart is solely the personal views of my research.
You are advised to rely on your own judgments while taking any investing/Trading decisions.
Past performance is not an indicator of future returns. Investment/trading is subject to market risks.
Seek help of your financial advisors before investing/trading.
Not recommended to take FnO positions based on this analysis
I may or may not trade this analysis. Details in description.

LEADING DIAGONAL IN INFOSYS. EXIT LONGLOOKS LIKE INFOSYS IS MAKING LEADING DIAGONAL.
IS IT A NEW IMPULSE OR WAVE A OF ABC ZIGZAG.THIS CANT BE SAID BUT ONE SHOULD LOOK TO EXIT LONGS AROUND 1450 LEVELS AS TRENDLINE CONNECTING WAVE 1 AND WAVE 3 TOP CAN ACT AS RESISTANCE.HENCE WAVE 1 OR WAVE A,MIGHT TERMINATE AROUND THE SAME LEVEL.
A DECENT PULL-BACK IN THE FORM OF WAVE 2 OR B CAN COME IN COMING FUTURE.

Apollo Hospitals - correction may be overApollo Hospitals seems to have completed a W-X- Y correction, there are other ways to label the correction but that leads to the same conclusion - indicating a resumption of the uptrend. Look to enter on strength above 3040 levels expecting new highs

NIFTY: preparation of a zig-zag correction ?Nifty can repeat the fall of september again which was in a form of zig-zag having the initial run as leading diagonal.
Trading strategy :
1. Buy nifty on dips for target of 15000-15050 , holding 15050 can extend to 15200-225. maintain SL of 14465 on the downside.
2. As soon nifty reaches in the resistance zone and starts rejecting then , create sell position close to 15250-300 with SL of 15350 for the downside objectives of 13700-500 .

BHEL Elliott Wave Analysis Jan 2021DISCLAIMER:There is no guarantee of profits or no exceptions from losses. The investment advice provided is solely the personal views of my research. You are advised to rely on your judgement while investing/Trading decisions. Past performance is not an indicator of future returns. Investment is subject to market risks. Seek help of your financial advisor before investing/trading.
I may or may not trade this analysis
--------------------------(((((LIKE)))))-------------------------------

Banknifty Deep Zig Zag correction in Wave (4)DISCLAIMER:There is no guarantee of profits nor exceptions from losses.
Technical analysis provided on the chart is solely the personal views of my research.
You are advised to rely on your own judgments while taking any investing/Trading decisions.
Past performance is not an indicator of future returns. Investment/trading is subject to market risks.
Seek help of your financial advisors before investing/trading.
I may or may not trade this analysis. Details in description.
-------(((((Please LIKE & Donate Coins to support my analysis)))))-------


ICICIBANK Pitchfork Pattern Elliot C wave correctionICICIBank respecting lower line of pitchfork pattern. Tripple Zig Zag in C correction wave.
Multiple major resistance 364,375,385 above which 410,442 is expected.
Entry 360 Stop Loss 335 (7%) target conservative 410(13.9%), Aggressive 442 (22.7%)
