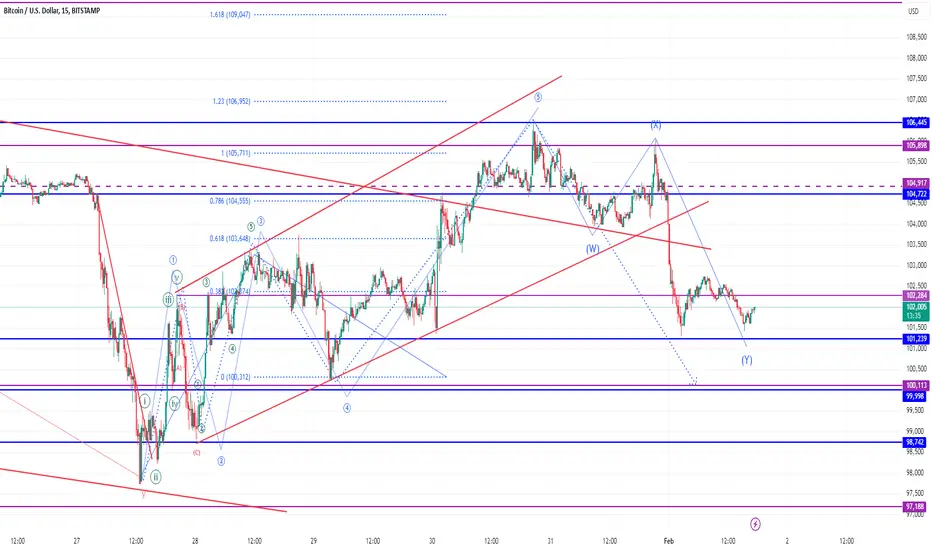
[SeoVereign] BITCOIN BEARISH Outlook – October, 03 2025The core basis for presenting a bearish perspective in this idea consists of two main points.
First, within the Double Zigzag pattern, each zigzag forms a 1:1 length ratio.
WAVE.Y1=WAVE.Z1
For easier identification, I have illustrated this section in the chart below.
The second is ZIF.
ZIF (Zone of Interpretive Freedom) is a concept I devised myself, and it refers to the price range between the 1.0 ratio and the 1.414 ratio when Fibonacci retracement is drawn.
This range serves as a critical zone for determining the validity of the idea, and as long as the range is not breached, the strategy is considered to remain valid. Also, the closing basis of ZIF is the daily candle’s closing price.
Simply moving outside of ZIF does not immediately invalidate the perspective.
Although the high of September 18 has been broken upward as of the current point in time, I regard this upward breakout as a false breakout (whipsaw).
The reason is that leading altcoins are moving sideways, failing to follow Bitcoin’s movement, and are showing declining momentum.
Accordingly, the average target price is set around 112.970 USDT.
Additional briefings will be continuously updated to this idea as the chart develops.
Search in ideas for "zigzag"

Indian Railway Finance Corporation – Complex Correction in PlayDisclaimer: This analysis is for educational purposes only and does not constitute investment advice. Please do your own research (DYOR) before making any trading decisions.
Technical Picture
Indian Railway Finance Corporation (IRFC) stock rallied from the swing low of 65.75 to an all-time high of 229 in a strong impulsive move. Since then, the stock has entered a corrective phase.
The decline from 229 to 108.04 unfolded as a clear three-wave ABC zigzag.
From 108.04 to 148.95, the rise was overlapping and choppy, best counted as an X wave triangle rather than a fresh impulsive sequence.
The fall from 148.95 to 117.33 looks impulsive and is labelled as Wave A of the Y leg.
The ongoing bounce can be labelled as Wave B, with retracement levels around 124–129 acting as possible resistance.
Once Wave B completes, a Wave C decline is expected to finish Wave Y. This Y leg can either:
terminate near 108.04, forming a double bottom structure, or extend toward the 0.786 retracement of the 65.75–229 rally, around 100.70.
Momentum and Indicators
On the D,2D and Weekly charts, RSI is below the 50 mark, showing weak momentum.
Price remains under the 50, 100, and 200-day moving averages, which are acting as resistances (not plotted here to keep the chart uncluttered).
The invalidation level for this corrective view is 148.95. A break above this level would challenge the corrective structure and point to a new impulsive rally.
Fundamentals
Growth : FY25 sales at Rs 27,152 crore vs Rs 26,645 crore in FY24. Net profit at Rs 6,502 crore vs Rs 6,412 crore. Quarterly profits continue steady.
Cash flows : Operating cash flow improved to Rs 8,229 crore. Net cash flow turned positive at Rs 5,657 crore from negative last year.
Leverage : Debt-to-equity is high at 7.83, with interest coverage at just 1.3x, leaving little buffer.
Returns and margins : Return on equity stands at 12.3%, but margins have narrowed from earlier highs.
Valuation : P/E around 25 and P/B at 3.1 suggest the stock is not cheap given its nature as a financing PSU.
in.tradingview.com
Summary
IRFC appears to be in the final stages of a complex W–X–Y correction. Wave Y is unfolding, and price can either find support near 108.04 to form a double bottom or stretch further toward the 100.70 zone. The 129 area is key resistance for the current B wave bounce, and 148.95 remains the invalidation level.
While the company’s fundamentals are stable with steady sales and profits, the balance sheet remains heavily leveraged, and valuations are not inexpensive. Investors should watch for price action around 108–100 for signs of a structural bottom and confirmation before positioning for the next major trend.

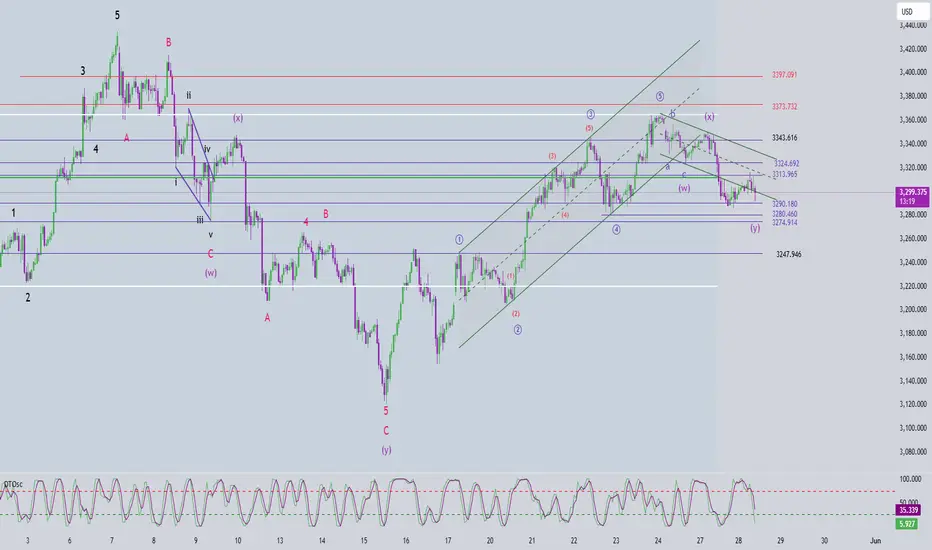
Elliott Wave Analysis – XAUUSD 27/08/2025
Momentum
• D1 timeframe: Momentum is showing reversal signals, as mentioned in yesterday’s plan. Currently, D1 is in the overbought zone, suggesting that bullish momentum has weakened and the market needs at least one corrective move to regain strength.
• H4 timeframe: Momentum is turning bearish. We need to wait for the current candle to close for confirmation, but there is a high probability that today’s main trend will be bearish.
• H1 timeframe: Momentum is in the oversold zone and preparing to turn up. If price rises into the overbought zone, then reverses bearish without breaking above 3394, there is a strong chance of a long-term decline – creating a sell opportunity.
________________________________________
Wave Structure
• D1 timeframe: With current reversal signals, there are two possible scenarios:
1. Triangle abcde – as shown in previous plans.
2. Combination correction (WXY) – where wave W is a zigzag, wave X is a double zigzag, and wave Y is a triangle (as on the chart). In this case, price may decline back toward 3311.
👉 Both scenarios are valid, with no clear dominance, so continued observation is required.
• H4 timeframe: A diagonal ending triangle is forming, combined with H4 momentum turning bearish. Although we need confirmation from the current H4 close, it is clear that bullish momentum is weakening → we should look for sell opportunities in line with H4 momentum.
• H1 timeframe: According to yesterday’s plan, we expected wave 3. However, several factors suggest otherwise:
o Price corrected deeply toward 3350.
o The rebound lacked strong momentum.
o An ending diagonal triangle appeared (not typical in wave 3, as it reflects very weak buying pressure).
o RSI shows bearish divergence, further confirming weakening bullish momentum.
Altogether, these point to a likely strong and sharp decline once the pattern completes.
📌 Ideal target zone: 3387 – 3390. If the current drop is wave A or wave 1, then the rebound of wave B or wave 2 should unfold within this zone.
________________________________________
Trading Plan
• Sell Zone: 3387 – 3390
• Stop Loss: 3397
• Take Profit:
o TP1: 3371
o TP2: 3350
o TP3: 3330

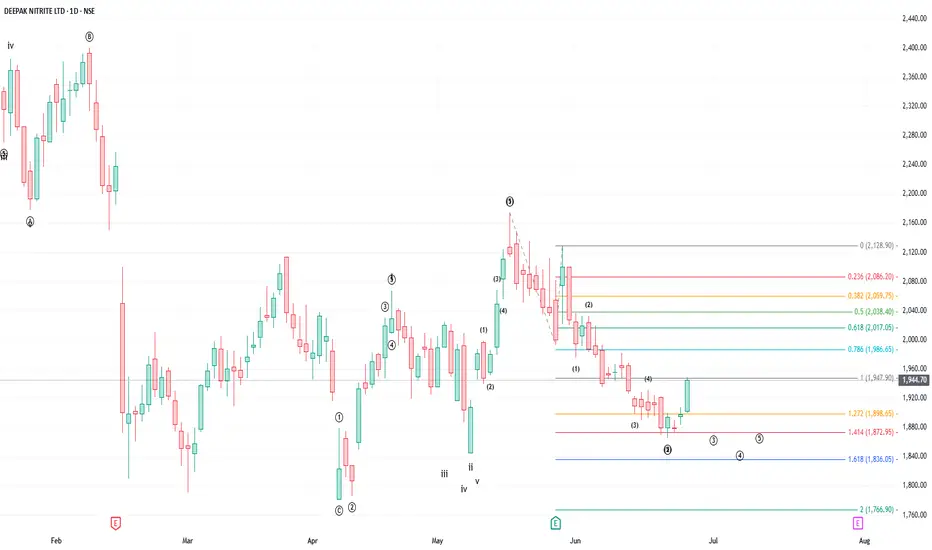
Buy Deepak Nitrite, target 2174, over 10% upsideDeepak Nitrite completed major correction in the form of a zigzag (ABC) and started forming a new impulse wave.
Stock while forming the third sub-wave again went into a correction in the form of a zigzag which seem to have been completed.
All the wave markings are given in the chart.
Buy Deepak Nitrite with a target of 2174 (>10% upside potential in a short timeframe), maintain stoploss of 1857.
Stock is at a good level to buy with a medium-term outlook.
Will update further targets as the wave progresses.
Happy trading !!
Buy Grasim Industries
Grasim Industries had completed first motive/impulse wave after the Sep-March correction.
After the 5-wave motive structure, the stock has been undergoing correction in the form of a zigzag, which is a 5-3-5 structure (marked conventionally as ABC).
The chart has all the wave markings.
The stock is likely to complete correction 'shortly' (end of wave C, i.e. third wave of the zigzag).
Buy on completion of correction.
Happy Trading.

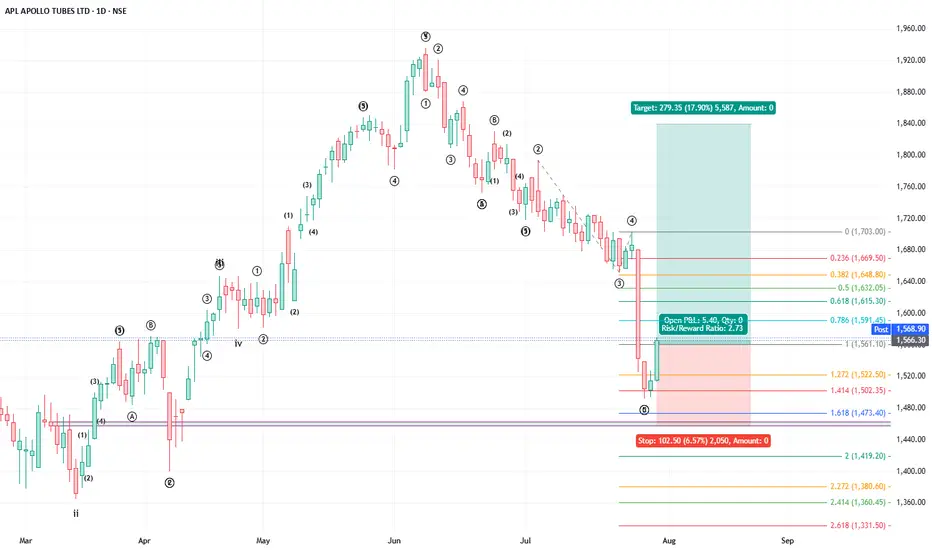
Buy Apollo TubesAPL Apollo Tubes has completed one full motive wave and related corrective wave in the form of a zigzag. All the wave markings are given in the chart.
One may consider going long on the stock with an initial target of 0.786 fibo retracement of the corrective wave. Stop loss is considered below 1.618 fibo retracement of Wave 2-3 to 4 of wave C of the corrective structure providing a risk-reward ratio of over 2.5x.
Will update the further targets as the stock waves unfold.
Happy Trading !!
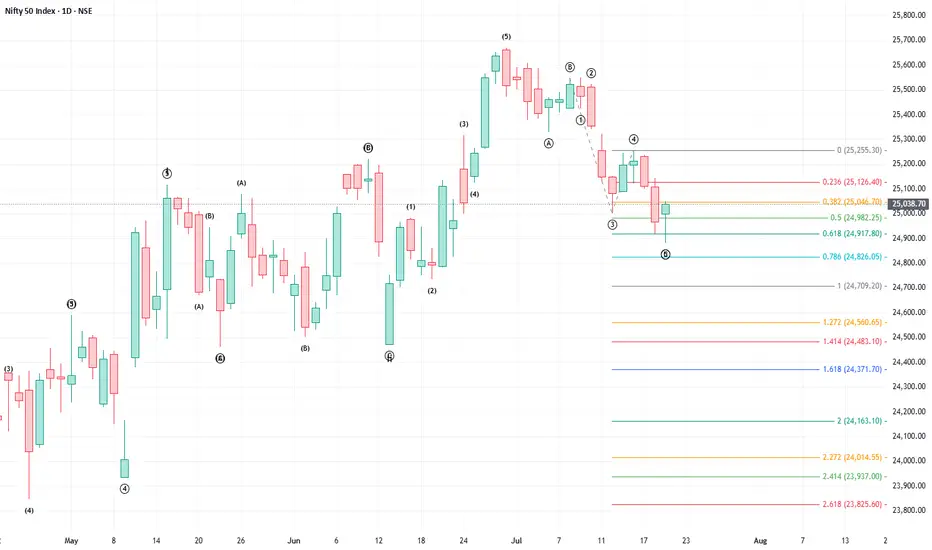
Go long on Nifty
Refer to my earlier publication on Nifty Trajectory wherein I had mentioned that Nifty is undergoing a correction in the form of a Flat and had correctly predicted that wave C got completed at little over 1 x of Wave A and that one may consider going long on Nifty (May - June consolidation).
Further to this, Nifty completed its first order impulse wave on 1 July and has been undergoing correction in the form of a zigzag. Wave C in all probability is complete at 0.618 fibo extention of wave 0-3 to 4 as given in the charts.
One may consider long position on Nifty with stop loss below today's low.
Elliott Wave Analysis – XAUUSD – July 8, 2025
🔎 Momentum Analysis
On the daily (D1) timeframe, momentum is currently declining. At the same time, the 4H momentum is showing signs of reversing downward. This suggests a likely short-term corrective decline, which provides a basis for projecting potential Elliott Wave patterns.
🌀 Elliott Wave Structure
On the 4H chart, I currently see two main possible scenarios:
Scenario 1: Contracting Triangle Correction (abcde – purple)
This scenario assumes a contracting triangle correction labeled abcde in purple.
The market appears to be in wave d (purple), which is unfolding as a wxy corrective structure. Currently, it is likely in wave y.
The projected target for the end of wave y is between 3393 – 3402.
However, due to the declining momentum, I expect a short-term pullback to the 3318 – 3321 region before price resumes upward to complete wave d.
Scenario 2: Larger WXY Correction
In this case:
Wave W has completed as a standard 3-wave abc.
Wave X has also completed as a double zigzag.
Wave Y appears to be forming a small contracting triangle abcde in red.
Currently, the price is being compressed between the upper and lower boundaries of the red triangle, suggesting that it is in the final wave e.
In this scenario, the projected retracement also aligns with the 3318 – 3321 zone. After completing wave e, price is expected to break out strongly above the upper boundary of the red triangle.
✅ Strategic Conclusion
Both scenarios point to a confluence zone at 3318 – 3321, making this a key potential buying area. Two trading approaches can be considered:
Aggressive Entry: Buy within the 3318 – 3321 range.
Conservative Entry: Wait for a confirmed breakout above the red triangle before entering a long position.
📈 Suggested Trade Plan
Buy Zone: 3318 – 3321
Stop Loss: 3308
Take Profit 1: 3342
Take Profit 2: 3362
Take Profit 3: 3393

LIC Housing: A Correction That Refuses to End?After completing the first upward leg from the March low near 483.70, LIC Housing Finance rallied sharply to 623.90. This rise is being marked as wave 1 or A, depending on whether the structure develops into an impulse or a zigzag.
After that peak, a correction was expected. Initially, price dropped to 565.40 in a clear abc formation, which could have marked the end of wave 2 or B. However, the market didn’t follow through with a strong rally. Instead, price began moving sideways in a choppy, overlapping manner — a strong clue that the correction wasn’t over.
This overlapping price action evolved into a WXYXZ structure, a complex form of correction.
Here’s how the structure now looks:
The initial drop to 565.40 is being treated as wave a of a larger correction.
The sideways consolidation that followed is marked as wave b.
The current expectation is for a final wave c down — which would complete the full abc correction of a higher degree, labeled as wave 2 or B. The ideal target zone for wave c lies between 1x to 1.618x the length of wave a, projected from the end of wave b.
Support lies in the 568.80–532.65 zone. If price dips into this area and shows signs of reversal — particularly with bullish divergence on RSI — it could set the stage for the next leg higher in wave 3 or C.
The invalidation level for this count stands at 627.30. A sustained move above this level would negate the possibility of a wave c decline and instead suggest that a new impulsive leg has already begun.
Disclaimer: This analysis is for educational purposes only and does not constitute investment advice. Please do your own research (DYOR) before making any trading decisions.

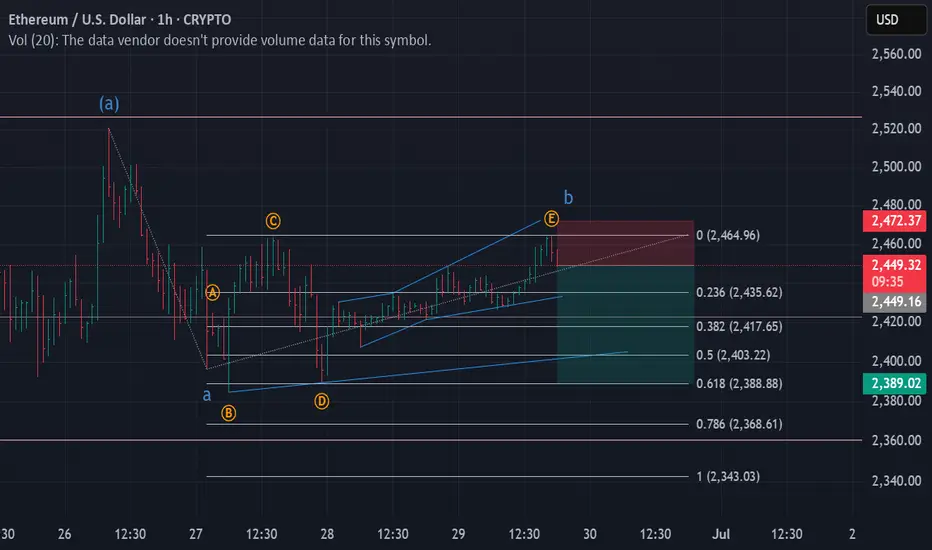
ETHUSD | SHORTEthereum seems to have completed Wave B and currently going to start Wave C of a ZigZag.
Current Price -> 2450
Stop Loss ~> 2475
Target 1 -> 2400
Elliott Wave Analysis – XAUUSD | June 11, 2025
📊 Elliott Wave Structure – H1 Outlook
Currently, the price is moving sideways within a channel.
🔍 Wave Structure Analysis:
Looking closely at the wave patterns inside this price channel, we can clearly see a series of 3-wave structures developing. Previously, we also observed what appears to be an abc corrective pattern (black), which leads me to suspect that we might be forming a triangle structure as the beginning of a wave 1 sequence (12345 in green).
It seems that wave 4 has already completed, and the price is currently in wave 5. Structurally, wave 5 may take the form of a 3-wave move, and the key confirmation we want to see is a break above 3349, signaling that the top of wave 5 is in place.
☄️ Typically, once a wave 1 triangle completes, the market tends to enter a sharp and deep corrective move in the form of a zigzag.
🎯 Potential Target Zones (based on Fibonacci + Volume Profile):
Target Zone 1: 3352 – 3355
Target Zone 2: 3362 – 3365
⚡ Momentum Outlook:
D1 Momentum: Starting to turn bullish, suggesting the current correction is nearing completion and we could see a bullish week ahead.
H4 Momentum: Currently in overbought territory – I expect the price to break above 3349, followed by a momentum reversal on H4, which could provide a great SELL opportunity at the upper targets.
H1 Momentum: Is about to turn bearish, indicating a short-term pullback may occur. If this correction fails to break below 3315, the price may be completing wave 5 as a 3-wave structure. In that case, we should wait for H1 momentum to turn bullish and then bearish again to confirm wave 5 completion.
📌 Trading Plan:
🔻 SELL Zone: 3352 – 3355
⛔ Stop Loss: 3369
🎯 TP1: 3334
🎯 TP2: 3307

Elliott Wave Analysis – XAUUSD Trading Plan – 28th May 2025
🔍 Current Wave Structure
After a sharp drop yesterday, price has mildly recovered and is now consolidating around the 3314 zone. The correction has nearly reached the target of wave C (green). However, the current rebound is weak, marked by small, overlapping H1 candles — suggesting the bullish structure is not yet convincing.
At this point, we’re tracking two main scenarios:
✅ Scenario 1 – Correction Completed
Wave C seems complete, and price might be starting a new bullish trend.
That said, the overlapping candles on H1 could also indicate the formation of a leading diagonal for wave 1.
In this case, wave 2 is likely to be a strong retracement — typically forming as a zigzag or flat correction.
📌 Strategy:
Wait for wave 2 to complete before looking for a better buy opportunity.
🌀 Scenario 2 – Correction Still in Progress
If the price continues to move slowly or goes sideways, we could be in wave b of a double zigzag correction (wave Y).
🎯 Wave c within wave Y may target 3324.
However, if price breaks below 3284 before hitting 3324, it would likely mean wave c has started, with an expected end near 3280–3274.
📈 Momentum Outlook
D1: Momentum remains bearish ⇒ primary trend still points downward.
H4: Momentum is currently rising ⇒ we may see a temporary recovery today.
H1: Approaching oversold ⇒ if reversal signals appear, short-term buy setups may emerge.
🎯 Trade Plan for Today (28/05/2025)
🔹 Buy Scalp
Entry: 3292 – 3289
SL: 3282
TP1: 3313
TP2: 3324
🔹 Buy Swing
Entry: 3280 – 3277
SL: 3270
TP1: 3290
TP2: 3313
TP3: 3324
🕰️ Expected timing: From London session through New York close
🔸 Sell Zone
Entry: 3324 – 3327
SL: 3334
TP1: 3313
TP2: 3290
TP3: 3280
🕰️ Ideal entry: If price hits resistance during US session or late London
📌 All scenarios will be updated as soon as wave 2 completes or if price clearly breaks below 3284.
Be patient — let the market confirm before taking action.
Elliott Wave Analysis – XAUUSD Trading Plan – 27th May 2025
📊 Wave Structure – XAUUSD – H1 Timeframe
Price is likely in a corrective phase — wave iv (orange) — after completing five internal green waves within wave iii.
During this correction, we’ve seen an abc zigzag form, followed by an unclear upward bounce. This gives rise to two key scenarios:
🔸 Scenario 1: Wave iv is complete
The abc pattern is finished, and price appears to be forming an initial triangle structure. We could currently be in wave 2.
👉 A breakout and H1 candle close above 3343 would confirm the start of a new uptrend. In this case, prefer buying on dips.
🔸 Scenario 2: Zigzag correction is still ongoing
Wave X seems complete, and price may now be developing wave Y — either as another abc or triangle.
👉 This scenario gets confirmed if price breaks below the wave c (green) low at 3324.
🎯 Wave Y downside targets (based on Fibonacci + Volume Profile):
• Target 1: 3317
• Target 2: 3290
🔍 Momentum Analysis
D1 Momentum has already confirmed bearish → Downside pressure likely to persist through the week.
H4 Momentum is currently rising → Price could see a short-term rally or sideways action today.
H1 Momentum is nearing oversold → We wait for it to flip to overbought. If price fails to break 3349, there may be room for a scalp sell.
However, if 3349 is broken, wave X could extend further — or it might mark the start of a new bullish leg. We’ll reassess accordingly.
📌 Trade Plan
Buy Zone: 3317 – 3314
Stop Loss: 3307
Take Profit 1: 3334
Take Profit 2: 3373
✅ Only execute if H1 momentum shifts bullish.
❗ If this zone breaks, next buy opportunity lies around 3290.

Elliott Wave Analysis – XAUUSD – Plan for May 27, 2025📊 Price is likely in the middle of a wave iv (orange) correction, following the completion of a 5-wave structure (green) that formed wave iii.
During this correction, an ABC zigzag pattern has already formed. The recent upward move remains unclear, which opens up two possible scenarios:
🔸 Scenario 1 – Wave iv is completed
The ABC structure looks complete. Price appears to be forming a leading diagonal, currently in wave 2.
A confirmed breakout above 3343 with a candle close would validate a new bullish trend → favoring Buy entries in line with the larger trend.
🔸 Scenario 2 – Ongoing zigzag correction (double structure)
Wave X has completed, and price may now be developing wave Y (either an ABC or triangle pattern).
This scenario is confirmed if price breaks below wave c (green) at 3324.
🎯 Wave Y Target Zones (based on Fibonacci + Volume Profile):
• Target 1: 3317
• Target 2: 3290
🔍 Momentum Outlook:
• Daily (D1): Bearish momentum confirmed → downside likely to dominate into the end of the week
• H4: Momentum rising → short-term bounce or consolidation expected today
• H1: Near oversold → watch for bullish reversal.
If price fails to break above 3349, scalp shorts may be considered.
However, a break above 3349 could mean wave X continues as an extended ABC, or a new bullish trend has started — to be updated accordingly.
📌 Trading Plan:
Buy Zone: 3317 – 3314
Stop Loss: 3307
Take Profit 1: 3334
Take Profit 2: 3373
✅ Only enter on H1 bullish momentum reversal
❗ If this zone fails, watch for the next Buy opportunity near 3290

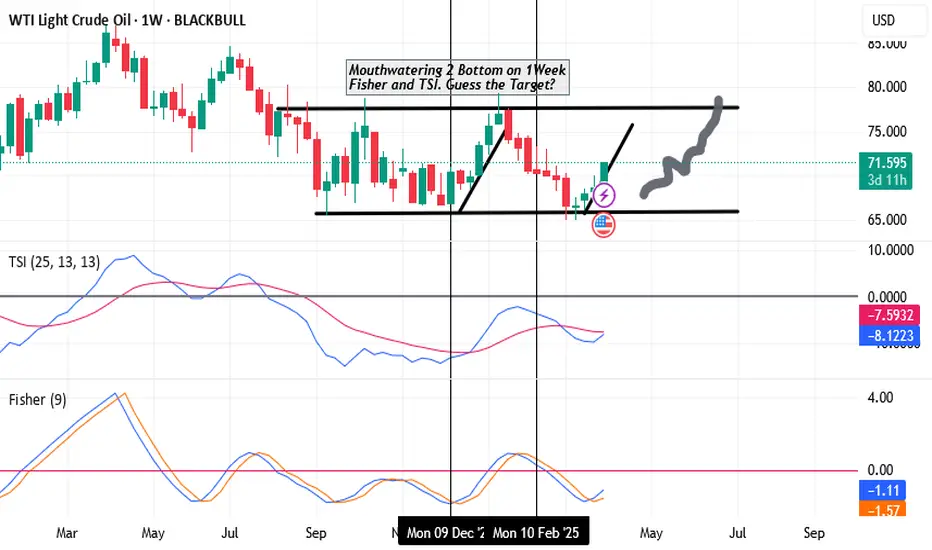
Crude Oil Bullish on 1Week timeframe (2Bottom)It is Mouthwatering 2 Bottom on 1Week Fisher and TSI.
Here, 1Month zigzag pattern at the Bottom makes it indecisive of a Direction, but extreme Bottom in 1Week makes a good point for BUY.
Guess the Target?
Well, it shall be a 1Day Top in Fisher and TSI. News shall be anything. But whatever news, it will turn out to be smartly marching ahead with confidence.
BTW, 1M Fisher has turn positive at Bottom zigzag pattern to catapult 4H 1D higher
BANKNIFTY: Elliott Wave AnalysisBANKNIFTY counting using Elliott Wave theory is done from 13th January.
We can see FLART- ZIGZAG- ZIGZAG CORRECTION marked in the chart.
The top made on 6th February is marked as wave (W) because it has 3 moves in it.
The fall after that was sharp and fast. This is the characteristic of wave (X).
Now, according to my analysis price is standing on wave (B) of wave (Y).
and as per previous observations, wave (Y) always crosses the top of wave (W), so we can expect it to go up to 100% extension.
This not any buying or selling recommendation.
This analysis is based on Elliott Wave theory and Fibonacci.
For educational purpose only.

BTC EW Update 01-febIn reference to my earlier post,
As I mentioned in my analysis it Can be a Leading diagonal structure.
It has turn out almost the same. Under the rules of LD wave 4 is overlapping wave 1 and and wave 3 is not extended and wave 5 is more than 61.8% hence extended and move from wave 5 to downside as 3-3-3 WXY correction has broken the trendline as normally happens with the LD and now we are looking for completion of wave Y and than break out 38.2% of last fall and long for next upside. Invalidation point is break of low of 1.
Than this structure will turn out in Triple Zigzag.
USOIL Elliot wave predictionOIL is under the correction and look like it is double zigzag and posible becoming triple zigzag and the if it break out to upside than it may go to upside in very less time.

Nifty Day Chart for next impulse wave anticipation Nifty 50 wave analysis for new high anticipation
1) We have an impulse wave 4 jun 2024 low point 21281 to 27 sep 2024 high 26277.
2) This impulse wave corrected as ((a)) ((b)) ((c)) correction it is a Flat correction up to 0.618% of previous leg.
i) internal structure is 3-3-5
wave ((a)) has zigzag.
wave ((b)) has expanded or irregular flat.
wave ((c)) has impulse wave (i) (ii) (iii) (iv) (v).
3) The market has provide motive wave low point 23263 to 24354 so traders and investors participate in next impulse wave or failed x wave
we can anticipate new high in the market
Disclaimer
It is my personal research or my view not for buying or selling recommendation only for educational purpose.
Thanks
MKT Learner

Bank Nifty: Projected Correction to 46,000 wi1. Trend Channels and Structure
Ascending Channels: The chart shows multiple upward-sloping trend channels marked by purple lines. These channels highlight the bullish trajectory of Bank Nifty over the past several months. The index is currently trading within a well-defined upward channel but has experienced recent pullbacks, which might suggest a reversion to the lower boundaries of this trend.
Support and Resistance Levels: The primary support levels appear at approximately 46,000 and 48,000 based on the lower trend lines of these channels. Resistance is seen near the upper boundary, around 54,000 to 56,000, where previous peaks were observed.
2. Key Price Levels and Projections
Short-Term Target of 46,000: The current downward trend, as depicted by the zigzag movement within the lower boundary, suggests that Bank Nifty could test the 46,000 level by the end of the year. This aligns with your prediction of reaching this level, possibly due to increased volatility or market corrections.
Bounce from Support: Based on the projected trajectory, Bank Nifty may find strong support around 46,000-48,000. The chart’s structure suggests a likely rebound from this support, which may lead to a subsequent rally towards the upper trend line, possibly testing 52,000 - 54,000 in early 2025.
3. Potential Price Action Pattern
Wave-like Pattern: The drawn zigzag within the channels indicates a wave-like correction pattern, possibly an ABC correction within Elliott Wave Theory. This pattern could complete around the 46,000 - 48,000 support zone, where the index might initiate a new bullish wave.
Bullish Continuation in 2025: If the correction completes as projected, Bank Nifty could enter a bullish continuation phase in 2025, moving back toward the mid-50,000 range. This would align with the broader upward trend channel that has been respected since the beginning of the chart.
4. Technical Indicators and Momentum
Momentum and Volume Analysis: Although the chart does not display volume, the recent downward price action suggests profit-taking or short-term bearish momentum. However, the strong structural support zones imply that once this corrective phase stabilizes, momentum could shift bullish again.
Consolidation Zones: Past consolidation zones around 48,000 to 50,000 may serve as strong bases for the next rally, suggesting this zone will be crucial for future price action. If Bank Nifty holds this level, it can confirm the start of a new bullish leg.
5. Conclusion and Strategy
Short-Term Outlook: Bank Nifty may experience a corrective move down to 46,000 levels, making it a critical zone to watch for support.
Long-Term Potential: After this correction, Bank Nifty could resume its bullish trend, targeting 54,000 and potentially higher levels in early 2025 if the index respects the lower trend line and historical support.
Risk Management: Traders should be cautious of any breach below 46,000, as it might suggest a breakdown from the long-standing trend channel. However, if Bank Nifty holds the 46,000 - 48,000 range, it could present a favorable buying opportunity for a longer-term uptrend.

Indigo Paints - Great Setup Before a Big Reversal?The stock has experienced a significant correction since February 2021, with a decline of nearly 70% from its peak. Notably, I observed an inverted head and shoulders pattern , recognized as a powerful indicator of a potential bottom. This observation led me to conduct a comprehensive technical analysis utilizing Elliott Wave theory.
Upon analyzing the correction from the peak, an ABC pattern in a zigzag formation becomes evident. Wave A manifested as an impulse consisting of five sub-waves, while wave B exhibited a flat correction comprising three minor waves. Wave C, once again, presented as an impulse with five minor sub-waves. The aforementioned waves adhered to the fundamental principles of Fibonacci analysis in Elliot waves. Remarkably, wave C projected at 1.618 times the length of wave A, a common characteristic of a deep zigzag correction.
Following the conclusion of wave C, the subsequent wave has surged sharply , indicative of the characteristics associated with wave 3 in an impulse sequence. Although this movement may have been a false signal, the nature of the retracement is particularly noteworthy. It has remained relatively flat in comparison to the preceding upward movement and coincidentally found support at the 61.8% Fibonacci level, which is typically a standard support for wave 2 , before rebounding with a substantial bullish candle.
For a detailed explanation on Elliot waves basics, please refer to the following link: www.investopedia.com
Integrating the insights from the analysis, it appears that a bottom may have been established, suggesting the potential for a stock rally from this point onward.
In terms of trading strategy, i t is advisable to await a breakout above the 1600 level, accompanied by a weekly close above this threshold . When considering position building, a phased approach is recommended, involving gradual purchases on dips to incrementally increase the position size.
The wave counts and relevant levels are illustrated on the accompanying chart.
DISCLAIMER: It is important to note that the information provided in this analysis is intended solely for educational purposes. It is strongly advised to consult with a financial advisor prior to making any investment decisions. I cannot be held responsible for any financial losses that may occur.

NVDA: Correction PhaseHello everyone,😉
I’ve put a scenario for the stock 'NVDA' together, which is currently drawing attention.
This scenario is based on not only the "Elliott Wave Theory" but also various analytical tools, so please take it into high consideration.
✔️ Wave from $140.76 downward: "Extended Flat"
This is an 'Extended Flat' composed of a 3-3-5 structure. The final C wave was completed as an 'Extended fifth wave impulse.'
✔️ Wave from $90.69 upward: "Zigzag"
This is a 'Zigzag' with a 5-3-5 structure. The A wave and C wave have a 1.618 ratio, which adds a high level of credibility.
✔️ Conclusion: Projected Path
Based on the wave count so far, I’ve drawn the projected path. I anticipate the appearance of a downward impulse wave and used the downward parallel channel and Fibonacci levels to estimate the potential decline range.
First support zone: $100.03
Second support zone: $84.57 (very strong)
Good luck!
This is not a buy or sell recommendation.
It is a personal perspective and should be used for reference only.
All decisions and responsibilities are yours.

Nifty Elliot wave based predictions for 27 JuneNifty has completed 3rd wave of cycle which started from low of 04 June and hence now nifty must moved to a consolidation phase in ABC (zigzag form)n for couple of days.
It is difficult to predict how much of this zigzag will be formed tomorrow but most likely first there will be down side move (12345 wave pattern already started from 23889) and then some retracement and then followed by some more correction (12345 wave pattern),
overall time to not go long till this phase is over,
** Please take any trade at your own risk, this is my analysis and sharing in case if goes right and others can get benefit but I might go wrong too, nothing is certain in stock market :)
