BTCUSD · 15M · SMC UpdateBuy-side liquidity above prior highs has been partially swept.
Rejection from supply shows acceptance failure in premium.
Market is now rotating back toward equilibrium.
LTF Structure
Impulsive move up completed.
Bearish response from supply with follow-through.
Current pullback is corrective, not impulsive.
Bias & Expectation
Favor shorts while price remains below the supply high.
Anticipate continuation lower toward:
Range low / EQ
Prior imbalance
HTF discount zone below
Seasonality

Infosys (W): Bullish - Coiling Pre-BreakoutTimeframe: Weekly | Scale: Logarithmic
The stock is in the final stages of a consolidation pattern, trading just below a multi-year resistance zone. The setup is a classic "absorption" phase , where buyers are soaking up supply before an imminent breakout, fueled by sector tailwinds.
🚀 1. The Fundamental Catalyst (The "Why")
The technical strength is supported by a major shift in sentiment:
> Accenture Q1 Results: The global IT giant recently reported strong numbers and raised guidance, signaling that the demand environment is improving. This typically acts as a leading indicator for Indian IT majors like Infosys.
> Seasonality: December/January is often a period of "pre-budget" and "pre-earnings" positioning, where defensive sectors like IT attract capital.
📈 2. The Chart Structure (The "Lid")
> The Resistance (1635-1655): It has been a rigid ceiling since April 2022. The fact that the stock is now hovering just below it (at ~1,638) rather than rejecting sharply suggests that the sellers are exhausted.
> The Volume: The weekly volume of 34.23 Million (and rising average volume over the last few weeks) confirms institutional accumulation . Smart money is buying before the breakout.
📊 3. Technical Indicators
> EMAs: The Positive Crossover (PCO) on the Weekly chart is a strong signal. The Monthly chart being "yet to form PCO" is actually positive—it means the major long-term buy signal is just about to trigger , offering early entry.
> RSI: Rising in both Monthly and Weekly timeframes indicates momentum is aligning with the price action.
🎯 4. Future Scenarios & Key Levels
The stock is coiling for a big move.
> 🐂 Bullish Breakout (The Trigger):
- Condition: A decisive Weekly Close above ₹1,655 .
- Target 1: ₹1,810 .
- Target 2: ₹2,006 (ATH).
> 🛡️ Support (The Safety Net):
- Immediate Support: ₹1,555 . This level must hold.
- Stop Loss: A close below ₹1,520 would invalidate the "absorption" thesis and suggest the resistance remains too strong.
Conclusion
This is a Grade A "Pre-Breakout" Setup .
> Strategy: The "smart money" is already accumulating. You can either buy 50% now (at ~1638) to capture the breakout early, or wait for a close above 1655 to go full size.
> Watchout: Keep an eye on the USD/INR rates; a stronger dollar will further support this trade.

IOB can rise after PSU stake saleI feel that all PSU banks are well positioned to move up
The ones that have the highest chances of getting sold off are IOB, central Bank as of now
Rumours of their Privatisation have been going around for a while

If you ignore this than it's your choice INDEX:BTCUSD
I am also shocked
every November closed in green in Year on year based than november near to end then it means v shape bounce is ready to in 6 days
please do your own research before taking any trade.
i am not financial advisor
risk is real stay practical
please feel free to ask any questions

Pilani Investment and Industries Ltd – DailyMarket Structure:
Price is currently in a bullish market structure, forming a series of higher highs and higher lows after breaking previous internal structure. The recent pullback appears to be a retracement into a discount zone, aligning with potential demand area.
Point of Interest (POI):
A clear demand zone is visible around ₹5,200–₹5,300, where price previously showed strong bullish reaction. Current price action suggests liquidity sweep below recent equal lows before potential mitigation.
Liquidity & Imbalance:
Liquidity Grab: Possible short-term liquidity sweep below minor lows (~₹5,320 zone).
Imbalance/FVG: Fair value gap present between ₹5,350–₹5,450, likely to be filled during bullish continuation.
Trade Idea:
Entry: Around ₹5,250–₹5,300 (reaction from demand zone).
Stop Loss: Below ₹4,800 (invalidates bullish setup).
Target: ₹6,000–₹6,050 (retest of previous supply zone).
Bias: 🟢 Bullish — Expecting mitigation of demand and continuation toward premium side.
Confirmation: Watch for bullish BOS (Break of Structure) and displacement before entry.

As U.S. stocks head into the fourth quarter, investors are once (AMZN) seasonal advantages and structural market factors. Multiple bullish signals are currently aligning in favor of AMZN.
Santa Claus Rally Support
Historical data shows that from late November through early January, U.S. equities often experience what is known as the “Santa Claus Rally.” For Amazon, this period of explosive consumer demand is a dual catalyst for both revenue and share price.
Peak e-commerce quarter: Black Friday, Thanksgiving, and Christmas shopping consistently deliver Amazon its strongest retail performance of the year.
AWS demand boost: Year-end corporate IT spending and budget finalizations typically reinforce AWS revenue in Q4.
Quadruple Witching Resilience
Every quarter, options and futures contracts simultaneously expire in what’s called “quadruple witching.” While this normally increases volatility, recent history shows that if AMZN holds steady—or even edges higher—on these days, it reflects strong positioning and short covering, a bullish signal for the near term.
Fundamental and Flow Advantages
Beyond seasonality and trading day effects, AMZN has several structural tailwinds:
Prime ecosystem: Rising memberships fuel higher conversion, stronger average order value, and greater purchase frequency.
Advertising segment growth: Amazon’s ad business is expanding rapidly, carrying far higher margins than retail and becoming a profit driver.
Institutional support: Heavy weighting in major funds and indices ensures strong passive inflows during year-end rebalancing.
Short- to Mid-Term Outlook
If the U.S. macro backdrop continues with low inflation and steady consumer activity, AMZN is well-positioned to benefit from these converging forces in Q4:
Technically, the stock has been basing and could follow through with a seasonal uptrend.
From a positioning standpoint, institutions appear to be reloading on mega-cap tech winners.
Fundamentally, retail + cloud + advertising form a robust three-engine growth model.
With the “Santa Claus Rally” and “quadruple witching resilience” in play, AMZN’s fourth quarter stands out as particularly attractive for investors.

Warning: A possible “crash” incoming?! 🔴 Warning: A possible “crash” incoming?! The key factor will be revealed at the end of this post
Bitcoin Market Update – 09/01/2025 👇
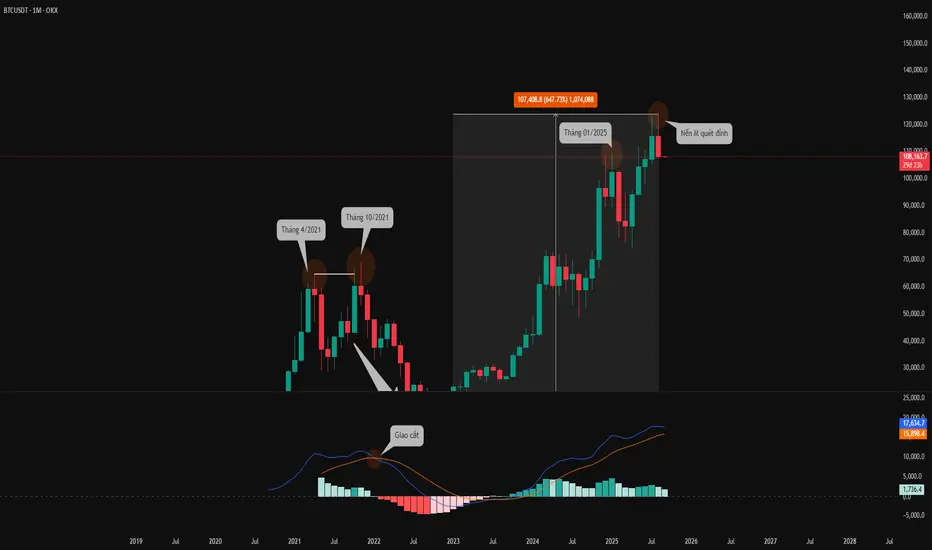
On the monthly timeframe, Bitcoin has surged ~647% from the wave bottom in January 2023 up to now. The long-term trend is still bullish. This current bull wave looks healthy, with strong upswings followed by short-term corrections.
However, here’s the factor I want to warn you about:
1️⃣ The Bitcoin monthly candle closed red this morning, almost engulfing the previous one, and more importantly, it just made a liquidity sweep at the top. History (see orange-marked zones) shows that whenever the monthly candle sweeps the high, a correction usually follows—sometimes small, sometimes very deep.
⚠️ Especially note October 2021: after Bitcoin swept the high, it went on to lose 70% of its value, dragging the whole market into a downtrend.
2️⃣ Looking at the current conditions: if the MACD on the monthly timeframe makes just one bearish cross, a downtrend could begin immediately.
Of course, timing, liquidity flow, and macro cycles all differ. Personally, I remain extremely bullish on the market long term. Corrections are necessary to set up the next massive wave.
No one can predict the future with certainty. But we can prepare defensive strategies for the worst-case scenarios.
🌱 Wishing everyone a green and refreshing new week ✅
Short-term trading strategies will be updated later today.
👉 Stay tuned everyone!
LONG ETH for 5000$ETH showing signs of Inside bar on daily timeframe. LONG here for a 5000$+ target.

BITCOIN PRICE UPDATE - JULY 1, 2025🔴 BITCOIN PRICE UPDATE - JULY 1, 2025
👋 Wrapping up the first half of 2025, BTC has closed the monthly candle around the ~$107,200 zone! Looking closely at Image 1 — BTC’s Monthly Candle Chart — we can see that June ended with a bullish green candle, forming a Pinbar ➡️ This indicates positive signals from the market.
📊 Personal Insights:
➡️ The primary trend of BTC remains bullish. Long positions are still the priority.
❓ However, in the short term, some correction phases may occur. Reasons include:
Price is currently approaching the previous peak area
On the D1 timeframe, there are clear signals: Triple Top + Divergence in Volume ➡️ This shows the overall market sentiment is cautious, waiting for a breakout around this price zone.
📌 At the current price zone of ~$107,000, I see two possible scenarios:
Scenario 1: Price retraces in the short term to collect liquidity, moves sideways within a ~$10,000 range, then gathers momentum for the next upward move
Scenario 2: Price breaks out sharply, creating a new all-time high, pulling the entire market upward
➡️ Personally, I lean more towards Scenario 1!
What do you guys think? Drop your opinions below so we can discuss together 👇👇

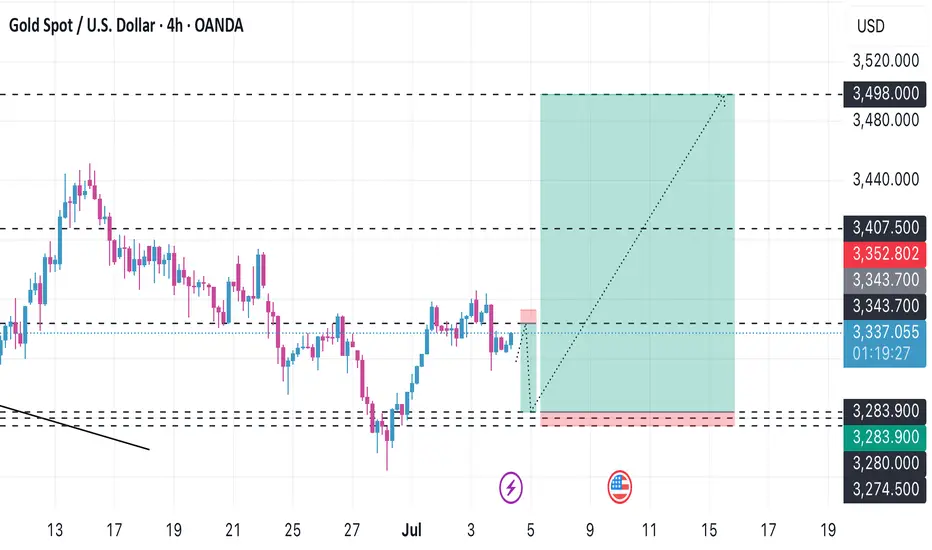
Update gold after the end of the second quarterToday is a normal Friday as usual the non-farm news will come out But the non-farm news came out a day before yesterday and today the bank will be closed for the 2nd quarter summary and I predict there will be a big gap, I will wait to buy in the lower zone and expect it to go back up to the 3,500 zone.
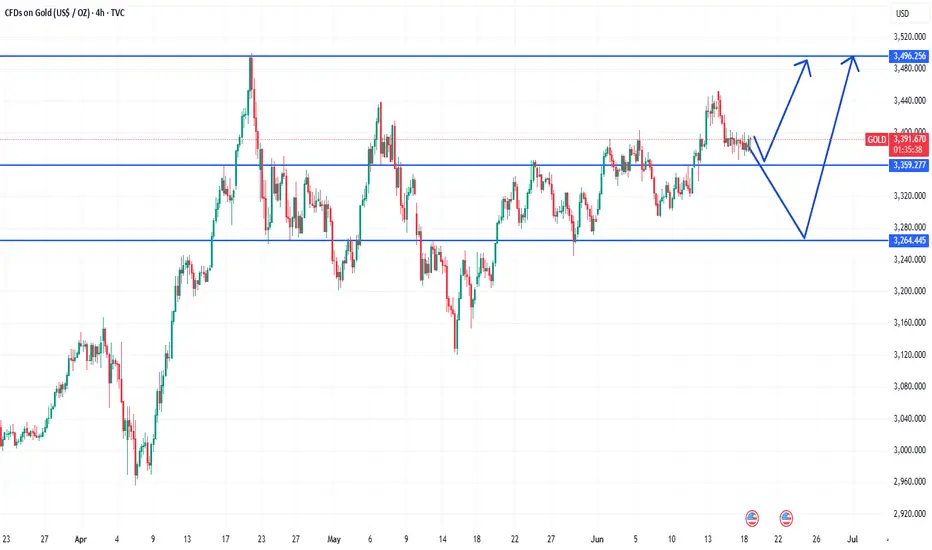
2nd Rejection is due to its all time Highas per technical analysis, the Gold is in strong bullish trend making higher highs on daily timeframes.
strong support at 3360. If broken then another strong support at 3264 is waiting on 4 hours timeframe.
my first attempt will be to buy it on CMP with sl of 3336 and a huge tp at 3480.
If my SL Hits then i will take another buy around 3300 with an SL of 3263 and more huge TP at 3480.
Mark it please.
BTC Market Update: Signs of a 2021 Replay?📉 BTC Market Update: Signs of a 2021 Replay?
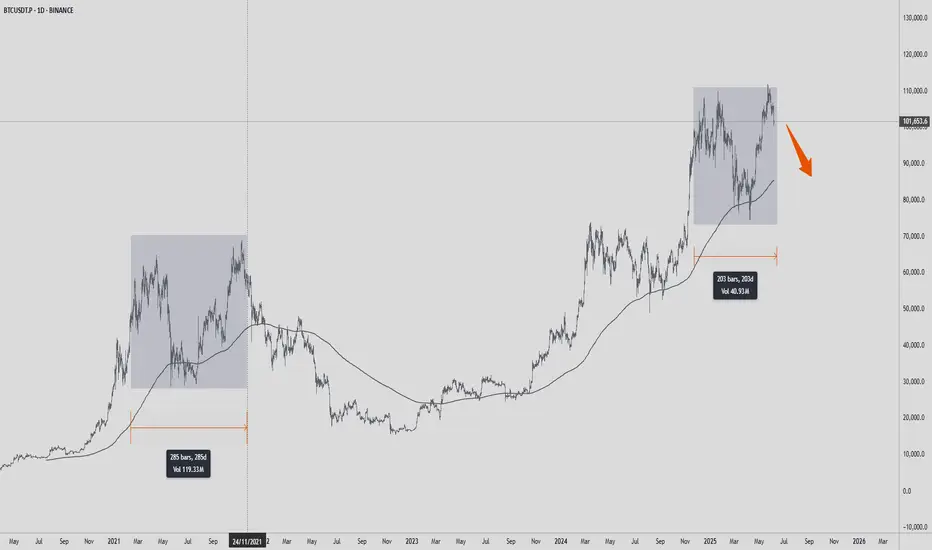
Looking at the chart, BTC is showing a price structure quite similar to late 2021—right after reaching its ATH around 69k before a major downturn.
🔁 If history repeats itself, the upcoming market conditions could turn bearish.
Currently, price has retested the moving average zone and is beginning to show a negative reaction.
⏳ This is a phase where traders should remain cautious—avoid FOMO, stay calm, and wait for clear confirmation signals.
📲 I’ll continue to post updates as soon as stronger signals emerge.
SHORT PLAN SAND 10X🔴SHORT PLAN: SAND 10X
Stop Loss (SL): -70%
This is a swing trade setup, guys.
Price on the H1 timeframe has already tested the upper resistance and there's liquidity present.
Risk: Lower timeframes haven't shown clear buying/selling momentum yet.

SKF technical analysisSKF India Ltd. (NSE: SKFINDIA) is currently trading at ₹4,207.10. The company is a leading manufacturer and supplier of bearings, seals, lubrication systems, and related products, serving various industries including automotive, aerospace, and industrial sectors.
Key Levels
Support Level: ₹2,539.70
Swing Level: ₹4,439.90
Possible Upside Levels: ₹7,323.15, ₹8,351.30, ₹9,661.00
Technical Indicators
RSI: The Relative Strength Index (RSI) is currently at 46.28, indicating that the stock is neither overbought nor oversold. The RSI is a momentum oscillator that measures the speed and change of price movements, typically used to identify overbought or oversold conditions.
Volume: The trading volume is 321.47K, reflecting the number of shares traded during the specified period. Higher volume often indicates stronger investor interest and can confirm price movements.
Sector and Market Context
SKF India Ltd. operates within the industrial sector, which has shown resilience and growth potential in recent years. The overall market trends suggest a positive outlook for the industrial sector, driven by increased infrastructure spending and technological advancements. SKF India Ltd. operates in the industrial sector, benefiting from infrastructure growth and energy-efficient solutions. It has upcoming earnings and board meetings to discuss financial results and dividends. While expanding into EVs, muted demand for industrial machines and rising costs may affect margins. Despite challenges, its focus on technology-driven solutions and efficiency supports long-term growth, with investors advised to monitor financial disclosures and sector trends.
Risk Considerations
Market Volatility: The stock may be subject to market volatility, influenced by macroeconomic factors such as interest rates, inflation, and currency fluctuations.
Sector-Specific Risks: Changes in industry regulations, technological disruptions, and competitive pressures can impact the company's performance.
Company-Specific Risks: Operational challenges, supply chain disruptions, and management decisions may affect the stock's movement.
Analysis Summary
SKF India Ltd. has demonstrated a strong upward trend, with key levels identified for support and potential upside. The RSI and volume indicators suggest a balanced momentum, with no immediate signs of overbought or oversold conditions. Investors should consider the broader sector and market context, along with potential risks, when evaluating the stock. While the analysis provides insights into the stock's performance, it is essential to conduct further research and consider individual investment goals before making decisions.

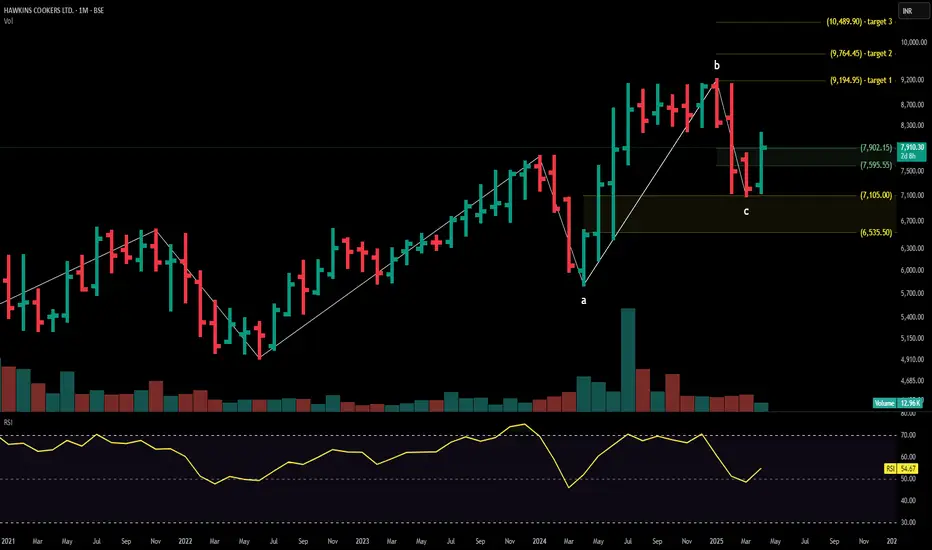
HAWKINS technical analysisStock Overview: Hawkins Cookers Ltd., BSE, current price: ₹7,910.30. Hawkins Cookers Ltd. is a trusted manufacturer of high-quality pressure cookers and cookware, catering to the growing needs of domestic and international markets.
Key Levels:
Support levels: ₹6,535.50, ₹7,105.00
Upside swing zone: ₹7,595.55, ₹7,902.15
Possible upside levels: ₹9,194.95, ₹9,764.45, ₹10,489.90
Technical Indicators:
RSI (Relative Strength Index): The current RSI is at 54.67, indicating a neutral momentum.
Volume: The trading volume is 12.96K, reflecting stable investor activity.
Sector and Market Context: Hawkins Cookers Ltd. operates in the consumer goods sector, particularly in the kitchen appliances niche. This sector has demonstrated resilience, buoyed by increasing urbanization, rising consumer income, and demand for quality appliances. The stock's performance aligns with the sector's growth trajectory, which is positively influenced by innovation and expanding distribution networks. However, the broader market trends remain cautious due to macroeconomic uncertainties and inflationary pressures, with selective recovery across various industries.
Risk Considerations:
Competition: The presence of other strong players in the kitchen appliances industry may impact market share.
Supply Chain Factors: Delays or rising costs in raw materials and logistics could affect production efficiency and margins.
Regulatory Environment: Changes in policies or taxation could create operational challenges for the company.
Analysis Summary: Hawkins Cookers Ltd. demonstrates a steady outlook. The consumer goods sector’s overall growth prospects align favorably with the company’s performance, although potential risks like market volatility, competition, and supply chain disruptions should not be overlooked. Investors may find Hawkins Cookers Ltd. a reliable candidate for monitoring, with room for steady performance subject to market dynamics and sectoral developments.
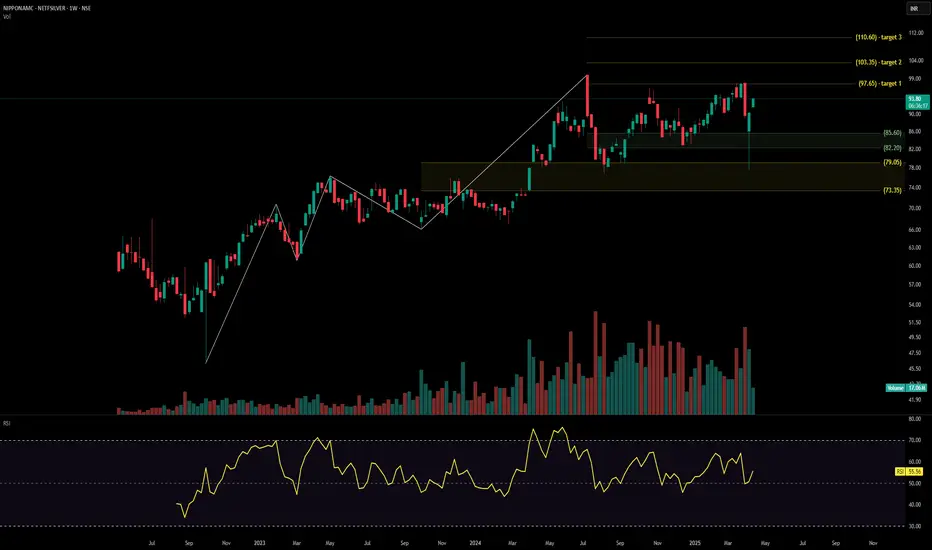
SILVERBEES ETF technical analysis Stock Overview: NIPPONAMC - NETFSILVER, listed on the Indian exchange, is currently priced at ₹93.80. This stock represents the Nippon India Silver ETF, which tracks the performance of silver, offering investors a commodity-linked investment avenue.
Key Levels:
Support Levels: ₹85.60, ₹82.20, ₹79.05, and ₹73.35.
Upside Swing Zone: ₹97.65 and ₹103.35.
Possible Upside Levels: ₹110.60.
Technical Indicators:
RSI (Relative Strength Index): Currently at 55.56, indicating that the stock is in a neutral momentum zone, neither overbought nor oversold. This suggests a balanced trading sentiment, with potential to move either way depending on market cues.
Volume: The stock shows a trading volume of 17.06 million, reflective of moderate investor activity. Consistent or spiking volumes could provide clues for trend continuation or reversal.
Sector and Market Context: The ETF's performance is closely tied to silver prices, which are influenced by global demand-supply dynamics, currency fluctuations, and macroeconomic factors. Within the broader commodity sector, silver has shown resilience amidst fluctuating market conditions, benefiting from its dual demand as both an industrial and precious metal. In the Indian market context, commodity-linked instruments like silver ETFs are gaining traction as investors diversify their portfolios.
Risk Considerations: Potential risks include high volatility in silver prices driven by geopolitical tensions, global economic uncertainty, and changes in industrial demand. Additionally, fluctuations in the Indian Rupee against major global currencies could affect returns. Adverse regulatory changes or taxation policies impacting commodity ETFs may also play a role.
Analysis Summary: NIPPONAMC - NETFSILVER offers an intriguing opportunity for investors seeking exposure to silver. The technical indicators suggest neutrality, allowing room for further analysis based on market and sector trends. Investors should remain vigilant about external factors like economic data, currency movements, and geopolitical developments that could influence silver prices and, consequently, the ETF’s performance.
TATA CONSUMERSStock Overview: TATA Consumer Product Ltd, NSE, current price: ₹1,001.90. TATA Consumer Product Ltd operates in the consumer products sector, focusing on food and beverages.
Key Levels:
Support level: ₹878.30 (yellow zone)
Swing zone: ₹970.40 - ₹1,024.50 (green zone)
Technical Indicators:
RSI (Relative Strength Index): Currently at 49.61, indicating neutral momentum.
Volume: 9.34M, reflecting moderate trading activity.
Moving Averages (MA): The stock price is above the 200-day MA but below the 50-day MA, signaling mixed trends.
Sector and Market Context: TATA Consumer Product Ltd benefits from its strong brand presence and diverse product portfolio, which allows it to capture a significant market share. Additionally, recent consumer trends, such as a growing preference for healthier food and beverage options, align with the company’s strategy and could further boost its performance in the sector. Market trends show cautious optimism, with investors favoring stable stocks amidst volatility.
Risk Considerations: Potential risks include inflation, shifts in consumer behavior, and global economic events. Company-specific risks such as supply chain disruptions or management changes could also impact performance.
Analysis Summary: TATA Consumer Product Ltd exhibits key support and resistance levels, with target prices suggesting growth potential. Neutral RSI and moderate volume indicate balanced momentum. While moving averages present mixed signals, the stock remains a stable contender within its sector. Investors should weigh market conditions and company-specific risks carefully before making decisions.

Andhra Paper has capacity expansion and new growth driversInvestment Update: A Promising Outlook for Medium-Term Gains
I made a strategic investment in this stock approximately one year ago, with the objective of achieving medium-term gains. As we approach the one-year milestone, I am pleased to reassess the company's performance and reiterate my optimism about its future prospects.
Based on recent developments and growth indicators, I forecast that the stock is poised to reach new targets of ₹150 by May 2025 . This upward trajectory is largely driven by the company's expansion efforts and improved operational efficiency.
Notably, the company has successfully increased its production capacity, paving the way for enhanced output and revenue growth. Specifically, paper production numbers have demonstrated significant improvement, underscoring the company's commitment to scaling its operations.
Furthermore, the establishment of a new tissue paper production unit represents a strategic diversification of the company's product portfolio. This move not only expands the company's revenue streams but also positions it to capitalize on the growing demand for tissue paper products.
In conclusion, the company's progress over the past year has reinforced my confidence in its potential for medium-term growth. With its enhanced capacity, improved production numbers, and strategic diversification, I firmly believe that this stock is well-positioned to deliver substantial returns on investment.

Range breakout in Kotak Bank?KOTAKBANK closed above 2000 levels for the first time in 3.5 years. It has been trading in the range of 1650-2000 levels for the past 4.5 years. If the momentum sustains it can reach its ATH levels 2250, before reaching pattern target of 2350ish levels.

Can heatwaves drive up IEX?IEX has been trying to reverse from its latest swing low levels. On the weekly chart, it looks like it's going to finish up the cup and handle pattern. Heatwave warnings from IMD, the hottest march already in India, can trigger an upmove in the coming months.

2 years breakout candidate SRFPrice is in 2 years consolidation and possible breakout candidate, above 2773 we can see further bullishness to continue.
SRF Ltd., incorporated in the year 1970, is a Large Cap company (having a market cap of Rs 69,687.99 Crore) operating in Diversified sector.
SRF Ltd. key Products/Revenue Segments include Chemicals (Industrial), Other Operating Revenue, Traded Goods, Export Incentives for the year ending 31-Mar-2023.

Sugar CycleConsidering that MSP shall be given as elections in Maharashtra and UP are upcoming and the cutting season is yet to begin.
I feel that overall the sales and the volumes and the profitability this year shall be highest ever and the permission to sell ethanol shall also change the nature of stocks!

7 years breakout candidate KIRI INDUSTRIESKIRI is a preferred resource centre for many of the most extensive product lines in textile dyes.
Sophisticated quality control practices and procedures, modern manufacturing facilities and erp driven enterprise management has enabled KIRI to offer Internationally recognized quality products and services.
KIRI is an accredited and certified Key Business Partner with world’s top Dyestuff majors across Asia-Pacific, the EU and Americas.
A closing above 675 will confirm breakout. This breakout will be on Yearly + Monthly + Weekly + Daily + Hourly timeframe, all at once
