Energy Sector Breakouts: A Comprehensive Analysis1. Definition of Breakouts
Breakout Explained:
A breakout occurs when the price of an energy sector stock or index moves above a defined resistance level or below a defined support level with increased volume.
Types of Breakouts:
Bullish Breakout: Price moves above resistance, signaling potential upward momentum.
Bearish Breakout: Price falls below support, signaling potential downward momentum.
Key Elements:
Resistance and support levels
Trading volume confirmation
Price consolidation preceding the breakout
2. Importance of Energy Sector Breakouts
Market Indicator:
Breakouts indicate a shift in supply-demand dynamics, reflecting investor sentiment in the energy markets.
Profit Potential:
Traders can capitalize on strong momentum after breakouts, particularly in volatile energy stocks.
Risk Management:
Identifying breakouts early allows for setting stop-loss levels and avoiding false moves.
Sector Leadership:
Certain energy stocks often lead sector breakouts, influencing indices like the Nifty Energy Index or S&P Energy Sector ETF (XLE).
3. Technical Analysis of Energy Sector Breakouts
Chart Patterns:
Triangles: Ascending triangles often precede bullish breakouts; descending triangles signal bearish potential.
Head and Shoulders: Breakout below the neckline signals a potential decline.
Flags and Pennants: Continuation patterns often indicate that the breakout will follow the existing trend.
Support and Resistance Levels:
Resistance: Previous highs where selling pressure is strong.
Support: Previous lows where buying pressure appears.
Breakout occurs when price decisively crosses these levels.
Volume Analysis:
High trading volume during a breakout confirms legitimacy.
Low volume breakouts often result in false signals, leading to reversals.
Indicators:
Moving Averages: Crossovers (e.g., 50-day MA crossing above 200-day MA) can reinforce breakout signals.
Relative Strength Index (RSI): Values above 70 can indicate overbought conditions; below 30 indicates oversold, helpful to gauge breakout sustainability.
MACD (Moving Average Convergence Divergence): Bullish or bearish crossovers can complement breakout analysis.
4. Fundamental Drivers of Energy Sector Breakouts
Oil and Gas Prices:
Fluctuations in crude oil and natural gas prices heavily influence energy stocks. Rising prices often trigger bullish breakouts.
Energy Demand and Supply:
Seasonal demand changes (e.g., winter heating, summer cooling) can affect utilities and energy producers.
Geopolitical tensions or supply disruptions (OPEC decisions, sanctions) can spark breakouts.
Policy and Regulation:
Renewable energy incentives, carbon pricing, and subsidies can drive sector valuations and breakout trends.
Deregulation or privatization in power and utilities can lead to bullish momentum.
Corporate Earnings:
Strong quarterly results, production reports, or new project announcements often catalyze breakouts.
5. Market Sentiment and Energy Sector Breakouts
Investor Confidence:
Optimism about economic growth, industrial activity, and energy demand can lead to bullish breakouts.
Fear and Panic Selling:
Bearish breakouts are often driven by negative news, profit warnings, or declining energy prices.
Global Events:
Wars, conflicts, or global policy decisions (like climate agreements) can influence breakout trends.
6. Breakout Strategies for Traders
Entry Points:
Enter near the breakout above resistance or below support after volume confirmation.
Avoid premature entries during consolidation phases.
Stop-Loss Placement:
Place stop-loss just below the breakout point for bullish trades or above for bearish trades.
Helps minimize losses in case of false breakouts.
Target Setting:
Measure the height of the prior consolidation range and project it from the breakout point to estimate potential targets.
Risk Management:
Trade smaller positions in volatile energy stocks.
Combine technical breakout signals with macro and fundamental analysis.
7. Examples of Energy Sector Breakouts
Oil & Gas Companies:
Bullish breakout after crude oil prices surge due to geopolitical tensions.
Bearish breakout during oversupply or production increases.
Renewable Energy:
Stocks break out on government subsidy announcements or major solar/wind project approvals.
Utilities:
Breakouts often occur around regulatory changes, tariff revisions, or quarterly performance updates.
8. Common Challenges in Energy Sector Breakouts
False Breakouts:
Price briefly moves past resistance/support but returns, trapping traders.
Avoid by confirming with volume and technical indicators.
Volatility:
Energy markets are prone to high volatility due to global oil prices, weather events, and geopolitical risks.
News Sensitivity:
Sudden policy changes, sanctions, or natural disasters can invalidate technical setups.
9. Sector-Specific Considerations
Oil & Gas:
Highly correlated with crude oil futures.
Watch OPEC meetings, inventory reports, and geopolitical news.
Renewable Energy:
Sensitive to government policies, subsidies, and technological advancements.
Breakouts often occur with announcements of new projects or partnerships.
Power & Utilities:
Influenced by regulatory frameworks, tariffs, and infrastructure investments.
Breakouts may be slower but more sustainable due to stable demand.
10. Tools and Resources for Identifying Breakouts
Technical Platforms:
TradingView, MetaTrader, and NSE/BSE charting platforms.
Market News Feeds:
Bloomberg, Reuters, and industry-specific news portals.
Government & Policy Reports:
Energy Ministry releases, OPEC reports, renewable energy agencies.
Algorithmic Alerts:
Use automated tools to get breakout alerts based on predefined technical conditions.
11. Conclusion
Energy sector breakouts offer significant trading and investment opportunities, but they require careful analysis.
A successful approach combines technical patterns, volume confirmation, fundamental drivers, and market sentiment.
Traders must be vigilant about false breakouts, high volatility, and sector-specific nuances.
Long-term investors can benefit by linking breakouts with macroeconomic trends and structural shifts in energy demand.
The energy sector remains dynamic, and breakouts often precede strong trends, making them an essential tool for market participants.
✅ Key Takeaways:
Breakouts signal shifts in momentum; confirmation by volume is critical.
Technical patterns, support/resistance, and indicators provide actionable insights.
Fundamental factors (oil prices, demand, policy) often drive sector breakouts.
False breakouts are common; risk management and stop-losses are essential.
Energy sector breakouts are highly sensitive to global events and sentiment.
Sector

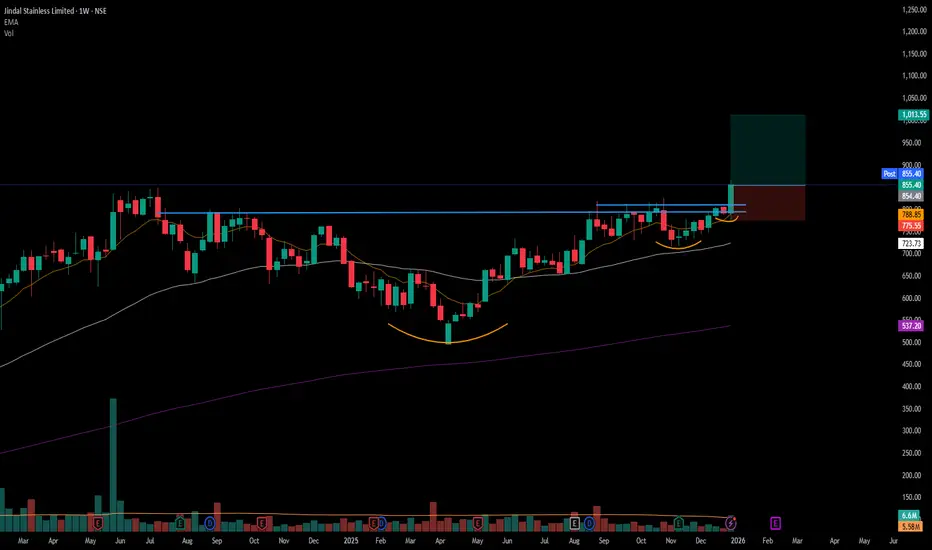
#JSL - VCP BO in WTFScript: JSL
⚡Key highlights: 💡
📈 VCP BO in WTF
📈 Volume spike seen during Breakout
📈 MACD Bounce
📈 RS Line making 52WH
📈 Sector is strong
If you have any doubts about the setup, drop a comment and I’ll reply.
✅Boost and follow to never miss a new idea! ✅
⚠️ Important: Always Exit the trade before any Event.
⚠️ Important: Always maintain your Risk:Reward Ratio as 1:2, with this RR, you only need a 33% win rate to Breakeven.
⚠️Disclaimer: I am not SEBI Registered Advisor. My posts are purely for training and educational purposes.
Eat🍜 Sleep😴 TradingView📈 Repeat 🔁
Potential Long Sector Turnaround - Nifty FMCG
Nifty FMCG has given a healthy correction of ~16% and is trading at a crucial make or break level.
Its following a broadening channel pattern and has reached the bottom level of the megaphone channel, which gives a favorable risk/reward ratio to initiate a position.
It has formed a head & shoulder pattern also, but its trading near the base of a major support level so the probability of this pattern turn around is low, this can potential lead to a trap which might be a favorable condition to initiate a long position, but as its a assumption position to be initiated with a strict SL if H&S pattern gets activated.
Long Position can be initiated in FMCG ETF once we gets a positive close or early entry can be initiated maintaining a strict SL.
Note: This is just for analysis purpose, please do your own research before punching any orders.
🔍 For more technical analysis and trade setups, make sure to follow me on TradingView

The Outperformer's Guide: Top Stocks from Each SectorThis analysis highlights key sectors and stocks to watch.
1. Nifty IT NSE:CNXIT
● The Nifty IT sector has demonstrated resilience during the recent negative market sentiments.
● Notably, it has formed a Descending Broadening Wedge pattern and expected to breakout soon.
➖ Stock to Watch - Coforge NSE:COFORGE
● The stock is currently trading just below its all-time high with a strong uptrend.
● Investors can consider accumulating shares on any dips.
2. Nifty Finance NSE:CNXFINANCE
● The Nifty Finance sector has recently breached its trendline support and is now approaching its next key support level, ranging from 22,500 to 22,700.
➖ Stock to Watch - Axis Bank NSE:AXISBANK
● The stock is currently trading at its support level, offering a potential short to mid-term trading opportunity.
3. Nifty PSU Bank NSE:CNXPSUBANK
● The Nifty PSU Bank sector has consolidated within a range and is nearing its support zone.
➖ Stocks to Watch - State Bank of India NSE:SBIN
● The stock is approaching its trendline support level.
● A buying opportunity may arise if the price reaches the 770 level.
4. Nifty Pharma NSE:CNXPHARMA
● After experiencing a downturn, the Nifty Pharma sector is now approaching its trendline support level.
➖ Stocks to Watch - Divis Laboratories NSE:DIVISLAB
● The price is overall in an uptrend.
● Following a record peak, the stock is now nearing its trendline support level.
● The best buy zone is between 5,500 and 5,600.
5. Nifty Media NSE:CNXMEDIA
● The Nifty Media sector is expected to witness a potential pullback towards the 1,720-1,760 level.
➖ Stocks to Watch - Network18 Media NSE:NETWORK18
● The stock is trading just above its trendline support zone, presenting a short to mid-term trading opportunity.
6. Nifty Realty NSE:CNXREALTY
● The Nifty Realty index is currently trading above its support zone.
➖ Stocks to Watch - Oberoi Realty NSE:OBEROIRLTY
● The stock is trading at the support zone and expected to rise soon.
7. Nifty FMCG NSE:CNXFMCG
● After a downfall, index is approaching its trendline support level
➖ Stocks to Watch - Varun Beverages NSE:VBL
● VBL is trading above its support zone, offering a short to mid-term trading opportunity.
8. Nifty Metal NSE:CNXMETAL
● The Nifty Metal sector is trading above its support zone,
➖ Stocks to Watch - Ratnamani Metals & Tubes NSE:RATNAMANI
● The stock price has formed an Ascending Triangle pattern and is currently trading above the support level.
9. Nifty Oil & Gas NSE:NIFTY_OIL_AND_GAS
● The Nifty Oil & Gas sector is also trading above its support zone.
➖ Stocks to Watch - Aegis Logistics NSE:AEGISLOG
● The stock price is close to breaking through its trendline resistance.
● If it can maintain its position above this level, a rally may be imminent.
10. Nifty Auto NSE:CNXAUTO
● Lastly, the Nifty Auto sector is trading above its support zone.
➖ Stocks to Watch - Eicher Motors NSE:EICHERMOT
● Eicher Motors is consolidating within a rectangle pattern, indicating a potential breakout.

OLECTRAOLECTRA - If you look at the history of the stock, there was a downfall from 2022 to March 2023, then the stock gave a breakout and a good move came, a similar pattern has formed
Hello traders,
As always, simple and neat charts so everyone can understand and not make it too complicated.
rest details mentioned in the chart.
will be posting more such ideas like this. Until that, like share and follow :)
check my other ideas to get to know about all the successful trades based on price action.
Thanks,
Ajay.
keep learning and keep earning.

RSYSTEMSRSYSTEMS - Stock is breakout and that too with good volume
Hello traders,
As always, simple and neat charts so everyone can understand and not make it too complicated.
rest details mentioned in the chart.
will be posting more such ideas like this. Until that, like share and follow :)
check my other ideas to get to know about all the successful trades based on price action.
Thanks,
Ajay.
keep learning and keep earning.

JKPAPER JKPAPER - reversal stock and breakout with good volume
Hello traders,
As always, simple and neat charts so everyone can understand and not make it too complicated.
rest details mentioned in the chart.
will be posting more such ideas like this. Until that, like share and follow :)
check my other ideas to get to know about all the successful trades based on price action.
Thanks,
Ajay.
keep learning and keep earning.

DALBHARATDALBHARAT - The stock is consolidating and trying to break the range. There is no possibility of much decline. As soon as it breaks the range, good momentum can be seen.
Hello traders,
As always, simple and neat charts so everyone can understand and not make it too complicated.
rest details mentioned in the chart.
will be posting more such ideas like this. Until that, like share and follow :)
check my other ideas to get to know about all the successful trades based on price action.
Thanks,
Ajay.
keep learning and keep earning.

SAKHTISUGSAKHTISUG - market fall but stock stand positive
Hello traders,
As always, simple and neat charts so everyone can understand and not make it too complicated.
rest details mentioned in the chart.
will be posting more such ideas like this. Until that, like share and follow :)
check my other ideas to get to know about all the successful trades based on price action.
Thanks,
Ajay.
keep learning and keep earning.

ABCAPITALABCAPITAL - need to break range move upside
Hello traders,
As always, simple and neat charts so everyone can understand and not make it too complicated.
rest details mentioned in the chart.
will be posting more such ideas like this. Until that, like share and follow :)
check my other ideas to get to know about all the successful trades based on price action.
Thanks,
Ajay.
keep learning and keep earning.

FCLFCL - Again back to same level 423 after take little dip.... expecting to move smoothly if market support......
Hello traders,
As always, simple and neat charts so everyone can understand and not make it too complicated.
rest details mentioned in the chart.
will be posting more such ideas like this. Until that, like share and follow :)
check my other ideas to get to know about all the successful trades based on price action.
Thanks,
Ajay.
keep learning and keep earning.

REMSONSINDREMSONSIND - The stock has broken out by forming a pole and flag pattern
Hello traders,
As always, simple and neat charts so everyone can understand and not make it too complicated.
rest details mentioned in the chart.
will be posting more such ideas like this. Until that, like share and follow :)
check my other ideas to get to know about all the successful trades based on price action.
Thanks,
Ajay.
keep learning and keep earning.

Hcl tech next outperforming stocks in IT sectorKey points : - 1. Crossed 60 on monthly chart
2. Taking support on weekly rsi
3. Outperform sector
4. Sectors storngest stock
5. Buy above 1700 is great buy
6. But after a sep fed cut buy will we be more strong
And ready to buy

PPLPHARMAIMPORTANT POINTS
1. RSI - 60 CROSSED ON MONTHLY CHART
2. CUP BREAKOUT OVER ONE YEAR
3. SECTOR BREAKOUT
4. Trading at 35.2% below our estimate of its fair value
FUNDAMENTALS
Below Fair Value
Significantly Below Fair Value
Price-To-Sales vs Peers
Price-To-Sales vs Industry
Price-To-Sales vs Fair Ratio

SUN TV NETWORKSector leader
Sun TV Network was established in 1985 as Sumangali Publications Private Limited and was later renamed as Sun TV Network Limited. Sun TV, the flagship channel of the company, was started in 1993. STNL is primarily involved in television broadcasting.
Media Index is beginning to look good.

EXIDEINDEXIDEIND:- Stock has given breakout after 6 years, volumes are also good
Hello traders,
As always, simple and neat charts so everyone can understand and not make it too complicated.
rest details mentioned in the chart.
will be posting more such ideas like this. Until that, like share and follow :)
check my other ideas to get to know about all the successful trades based on price action.
Thanks,
Ajay.
keep learning and keep earning.

JKTYREJKTYRE:- Cup and handle pattern has been formed, breakout has also been given, volumes are also visible well.
Hello traders,
As always, simple and neat charts so everyone can understand and not make it too complicated.
rest details mentioned in the chart.
will be posting more such ideas like this. Until that, like share and follow :)
check my other ideas to get to know about all the successful trades based on price action.
Thanks,
Ajay.
keep learning and keep earning.

NFLNFL:- The stock has given a breakout after 11 years. Keep an eye on the stock.
Hello traders,
As always, simple and neat charts so everyone can understand and not make it too complicated.
rest details mentioned in the chart.
will be posting more such ideas like this. Until that, like share and follow :)
check my other ideas to get to know about all the successful trades based on price action.
Thanks,
Ajay.
keep learning and keep earning.

EDELWEISSEDELWEISS:- If the stock gives a breakout and sustains above 45.90 level, we may see a movement to the upside
Hello traders,
As always, simple and neat charts so everyone can understand and not make it too complicated.
rest details mentioned in the chart.
will be posting more such ideas like this. Until that, like share and follow :)
check my other ideas to get to know about all the successful trades based on price action.
Thanks,
Ajay.
keep learning and keep earning.

FCLFCL :- Cup and handle pattern is made in stock, breakout has been given
Hello traders,
As always, simple and neat charts so everyone can understand and not make it too complicated.
rest details mentioned in the chart.
will be posting more such ideas like this. Until that, like share and follow :)
check my other ideas to get to know about all the successful trades based on price action.
Thanks,
Ajay.
keep learning and keep earning.

METROPOLISMETROPOLIS :- After a huge fall, the stock has consolidated and has also formed a reversal pattern called Cup and Handle Pattern.
Hello traders,
As always, simple and neat charts so everyone can understand and not make it too complicated.
rest details mentioned in the chart.
will be posting more such ideas like this. Until that, like share and follow :)
check my other ideas to get to know about all the successful trades based on price action.
Thanks,
Ajay.
keep learning and keep earning.

GRASIMGRASIM:- After this, a breakout is about to happen, the stock has been consolidating near the resistance for the last 3 months. If we get a breakout, we may see upside movement.
Hello traders,
As always, simple and neat charts so everyone can understand and not make it too complicated.
rest details mentioned in the chart.
will be posting more such ideas like this. Until that, like share and follow :)
check my other ideas to get to know about all the successful trades based on price action.
Thanks,
Ajay.
keep learning and keep earning.

IFCIIFCI:- Reverse pattern has been created on the monthly chart, you can also call it cup and handle pattern.
Hello traders,
As always, simple and neat charts so everyone can understand and not make it too complicated.
rest details mentioned in the chart.
will be posting more such ideas like this. Until that, like share and follow :)
check my other ideas to get to know about all the successful trades based on price action.
Thanks,
Ajay.
keep learning and keep earning.
