Bitcoin's Next Move: $110K Breakout or $94K Dip? SMC Decides#Bitcoin Daily Chart Analysis – Smart Money Update
As of today, BTC is trading around $105,800 and is showing signs of consolidation after reaching a key resistance zone near $110K.
Let’s break down what’s happening on the chart 👇
Current Market Structure
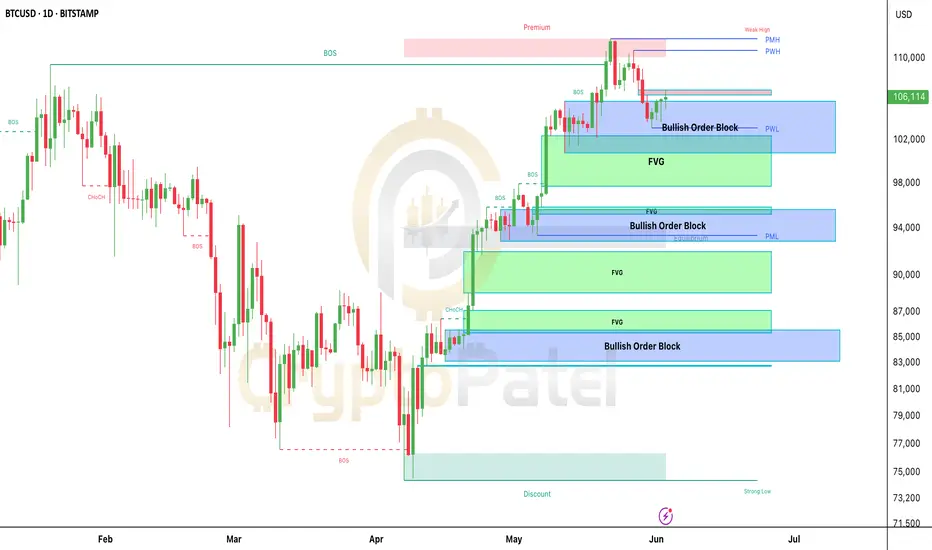
▶️ BTC has been in a clear uptrend, with multiple Breaks of Structure (BOS) confirming bullish momentum throughout April and May.
▶️ However, price recently entered a premium zone (above $110K), where it faced strong resistance.
▶️ This created a weak high, and we saw a Change of Character (CHoCH) that suggests buyers are slowing down.
Key Levels to Watch
$102K–$106K Zone (Current Area)
▶️ Price is sitting inside a Bullish Order Block + Fair Value Gap (FVG).
▶️ This is a strong support zone.
▶️ If this area holds, we could see a move back up toward $110K or even higher.
$93K–$96K Zone
▶️ Another clean Bullish OB + FVG combo.
▶️ If BTC breaks down from the current zone, this is the next major area where Smart Money might step in to buy.
$83K–$87K Zone
▶️ Deep discount zone, far below equilibrium.
▶️ If price reaches here, it’s a high-probability reversal area.
What Smart Money Might Do
▶️ If BTC holds above $102K–$105K, bulls could regain control and retest the highs near $110K.
▶️ If we break below this zone, expect a pullback toward $94K–$95K or even $87K, where more demand is waiting.
Fair Value Gaps (FVGs)
▶️ Several FVGs are visible, especially between $98K–$103K and $93K–$96K.
▶️ These gaps are areas of imbalance where price is likely to return and fill before the next move.
Summary
▶️ BTC is currently in a decision zone.
▶️ Holding above $102K = bullish continuation likely.
▶️ Breakdown = retracement into deeper bullish zones.
⚠️ As always, wait for confirmation on lower timeframes before entering any trade. Let the market show its hand.
Stay patient. Smart Money doesn’t chase—It waits.
NFA & DYOR
SEI
$SEI to $2? Trump-backed + Institutional Buys = Next Altcoin NYSE:SEI to $2? Trump-backed + Institutional Buys = Next Altcoin Rocket!
#SEI already pumped +100% from our entry! Hope you enjoyed the ride.
But I’m still massively bullish on this setup.
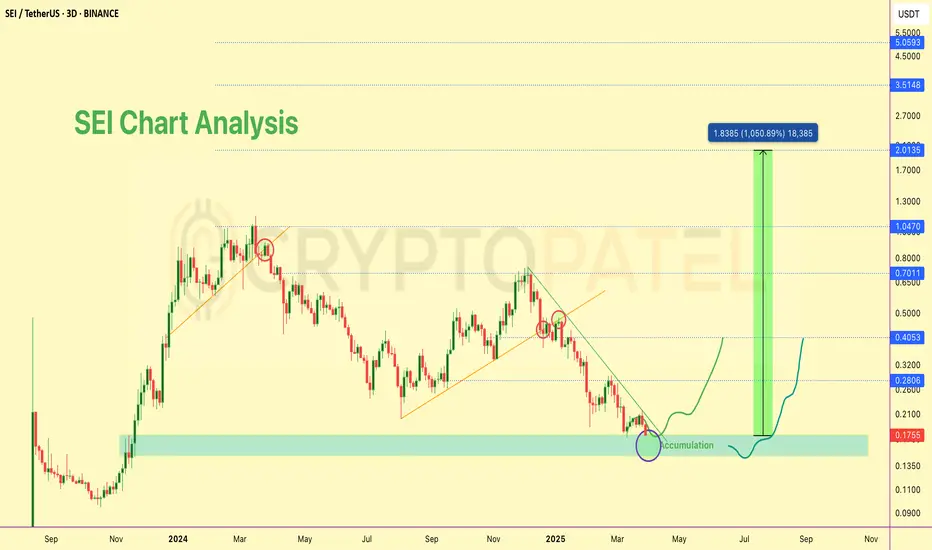
▶️ Price is consolidating near strong support at $0.20–$0.14
▶️ This is a golden accumulation zone for the next leg up!
▶️ Backed by Trump’s Liberty Financial & multiple institutional buys
▶️ My targets for this bull run: $1 → $2 → $3 → $4
Still early. Still bullish. Still time.
Note: Not Financial Advice so Do your Own Research before investing.
#Altcoins

Next 10x Gem?: SEI Bulls Eye $2+ After Key ChoCh at $0.22$SEI/USDT – Long-Term Technical Outlook
Price has likely established a local bottom near the $0.13–$0.15 demand zone, signaling potential for a macro accumulation phase.
🔸 Primary Accumulation Zone: $0.15–$0.13
🔸 Break of Structure Support: Below $0.13 opens downside to $0.10–$0.09 (secondary accumulation zone)
🔸 Bullish Market Structure Confirmation: HTF ChoCh above $0.22
🔸 Long-Term Expansion Targets: $2 and $5 (based on FVG extensions and historical impulse projections)
A successful retest and bounce from current levels would reinforce bullish continuation. Close monitoring of the $0.22 level is key for trend reversal confirmation.

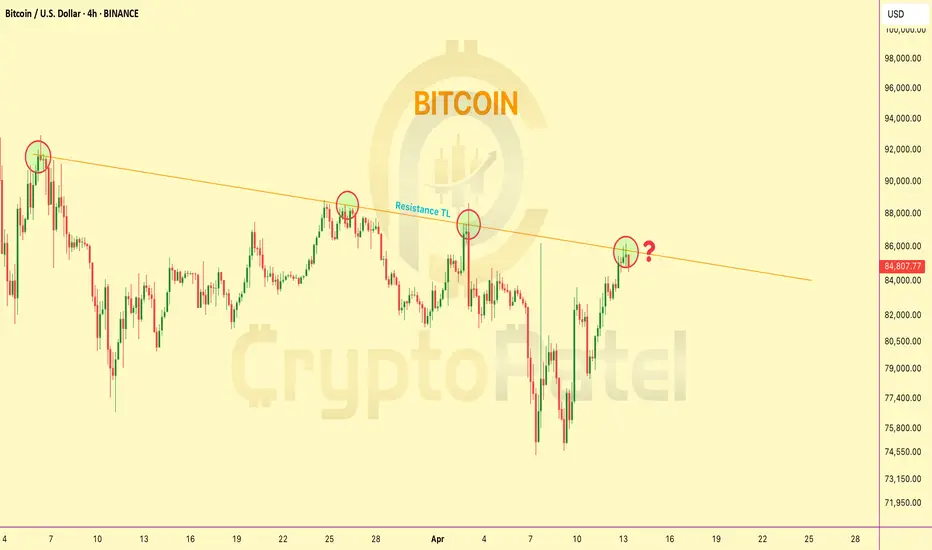
Bitcoin trading at Resistance level so What Next?🚨 Bitcoin 4H Chart Update
CRYPTOCAP:BTC is now trading right at the trendline resistance on the 4H chart
So what’s next?
1️⃣ Breakout and blast toward $100K?
2️⃣ Or another rejection down below $70K?
The decision point is HERE.
This breakout could change the game.
👇 Drop your thoughts –
$SEI/USDT- Long-Term Technical Setup and $5 Potential in BullRun📊 $SEI/USDT – Long-Term Technical Setup
NYSE:SEI is holding strong at the $0.18 support zone, showing early signs of accumulation. This level has historically acted as a demand area, making it a key zone to watch.
🔹 Structure: Forming higher lows – bullish trend intact
🔹 Volume: Accumulation pressure building
🔹 Sentiment: Backed by large-scale buyers (e.g., Trump’s World Liberty)
📈 Long-Term Targets:
➡️ $0.45 → $1.00 → $2 / $3 / $5 (macro targets similar to CRYPTOCAP:SUI )
🛑 Invalidation: Close below $0.15
⚠️ Not financial advice. DYOR.
#SEI #CryptoTA #Altcoins #DYOR #TechnicalAnalysis
SEI TO MAKE 2X IN COMING DAYSThe CRYPTOCAP:ETH chart shows prices hovering around a key support zone of 1,750 - 1,830 within a descending channel. The red Ichimoku Cloud above acts as a strong resistance barrier, indicating potential challenges in breaking upwards.
If support holds, aim for a bounce towards the cloud resistance near 2,400. A successful breakout from the cloud could target 2,800 and beyond. However, if support fails, watch for a dip to 1,600 levels.

SEI/USDT 20x Potential from Accumulation ZoneNYSE:SEI Accumulation Zone – High Potential Trade
🔹 -76% from recent high, making it a prime accumulation zone.
🔹 My Accumulation Zone: $0.20 – $0.15
🔹 Upside Potential: Chart indicates an easy move to $0.50—if it breaks, expect a major rally!
🔹 Long-Term Targets: $1/$3/$5/$10
🔹 Catalyst Alert: Even #TRUMP is accumulating #SEI adding strong bullish momentum!
Strategy: Accumulate on dips, take profits strategically, and hold a portion for long-term gains.
#Altcoins #NFA

This $SEI setup could be the best entry of the bull run!This NYSE:SEI setup could be the best entry of the bull run! Don’t miss out!
The market dumped hard, but opportunity knocks.
#SEI pumped 118% from our entry before dumping! Now, I’m accumulating in the Daily Demand Zone.
▫️ Potential: 5x-10x
▫️ SL: Below $0.20 (Daily Demand Zone)
If $0.20 holds, this could be the best entry of the bull run! 🏆
#Altcoins

Is SEIUSDT Poised for a Breakout or a Trap?Yello Paradisers! Is SEIUSDT about to make a major move, or are we looking at a potential trap? 📉
💎We’ve spotted a descending channel on SEIUSDT, typically a bullish pattern—but let’s not get ahead of ourselves. To confirm this setup and stack the odds in our favor, we need to see a breakout and a candle close above the resistance zone. Without this, it's all just speculation.
💎If the price pulls back, we might witness a potential bounce and the formation of a double bottom pattern—another bullish indicator. However, be cautious. This scenario is risky, especially for beginners, and it’s best to stay on the sidelines unless you’re an experienced trader.
💎On the flip side, if SEIUSDT breaks down and closes below the demand zone, it will invalidate this entire idea.
Remember, discipline and patience are your best allies in trading. Don’t jump the gun—wait for confirmation before making your move. Stay sharp and focused, Paradisers!
MyCryptoParadise
iFeel the success🌴

SEI/USDT Bullish Long Term Target $10 ?SET:SEI Chart Analysis ( Long Term $10 Potential )
#SEI has broken out of a Bull Flag in HTF and is looking bullish!
🔹 Daily Demand Zone: $0.250
🔹 Short-term Target: $1
🔹 Long-term Targets: $5-$10
Watch for the next big move!

SEI/USDT Ready to $2 in Near Term Target ?NYSE:SEI looking bullish based on HTF chart analysis
Perfect retest zone at $0.40, which makes for a good entry. I’m expecting $2 in the near future. If it drops, $0.30 will be a great accumulation zone.
Near-term targets: $0.57 / $0.96 / $1.50 / $2 / $5

SEI SHORT SET-UP SEI has been getting rejection again and again from upper trendline, market being bearish makes it again for short setup. Entry price, Stoploss & Target are given in chart.

SEI/USDT: Bullish Shark Pattern Signals Potential RallySEI/USDT has formed a bullish shark pattern and is showing a bullish divergence bounce, indicating strength.
There is now a chance to retest the $0.30 level, after which a rally is expected.
The targets are $0.58 and $1.16.
#SEI #USDT #CryptoTrading #BullishSharkPattern #BullishDivergence #CryptoAnalysis #TradingTargets #CryptoRally #TechnicalAnalysis

SEI is setting the stage for a potential bear trap! 🐻🚫💎 Paradisers, #SEI might trap bears who entered during the recent breakdown.
💎If #SEIUSDT breaks out from the recent cup and handle pattern, we can anticipate a bullish move. This scenario would likely trigger bear stop losses, potentially driving a bullish trend.
💎However, if the price breaks down below the minor support level, it would be considered a continuation of the short-term bearish trend, and we might expect further bearish movements. For now, though, I am not interested in focusing on bearish moves, so it would be prudent to stay alert but not actively engage in bearish trades.
