Weekly Analysis with buy/Sell scenarios in Nifty👋👋👋 Friends, What's your view on Nifty???
Nifty was in big pressure during previous weeks because of global events and higher tariffs from US. But last week was good recover week because of big events of IndoEU trade deal and more importantly confirmation on IndoUS FTA. These events pushed positivity in the market and price shown upside move of ~1500 points and finally closed above 25600 (@25693)
On Tuesday Price gaped up ~1200 points and fell sharply losing ~ 600 points from high of the day. Price went on range bound for remaining three days, however price closed in slightly positive mode on Friday.
FIIs/DIIs both were net buyer at the end of week. FIIs - 2,645.53 and DIIs - 2,892.14.
Considering all these factors Nifty should move up side. Our first target level should be 26000 and then all-time high.
Critical points ……………….
1. Price closed positively after sharp fall from the high of Tuesday.
2. Currently price at critical level and most probably it will go upside.
3. Critical Support level is 25500.
4. We should see some really good bullish price formation if price willing to go upside.
5. We should patiently wait for the formation of entry model at least at 1H/15m)
6. If Global sentiments are positive and price gets support from volume at key level, we may see some really good buy scenarios.
Note – if you liked this analysis, please boost the idea so that other can also get benefit of it.
Also follow me for notification for incoming ideas.
Also Feel free to comment if you have any input to share.
Disclaimer: This analysis is for educational purposes only and does not constitute investment advice. Please do your own research (DYOR) and check with your financial advisor before making any trading decisions.
Sensexanalysis

SENSEX : EXPIRY TRADING LEVELS AND PLAN FOR 05-FEB-2026📘 SENSEX Trading Plan – 5 Feb 2026
(Timeframe: 15-Min | Instrument: SENSEX | Educational Purpose Only)
🔑 Key Intraday Levels (From Chart)
🟢 84,954 – Last Intraday Resistance
🟢 84,510 – Opening Resistance (Gap-Up Case)
🟠 83,800 – 84,038 – Opening Resistance Zone (No-Trade Zone)
🟢 83,513 – Opening Support
🟢 83,318 – Last Intraday Support
🟢 83,048 – 82,977 – Buyer’s Demand Zone
🧠 Market Structure & Price Psychology
SENSEX is showing sideways consolidation after recovery, indicating balance between buyers & sellers.
Price is currently stuck inside a decision supply zone, where breakout or rejection will define direction.
👉 Large gap openings (300+) will likely trigger volatility expansion, so confirmation is critical.
🚀 Scenario 1: GAP UP Opening (300+ Points)
(Opening near / above 84,300 – 84,500)
🧠 Psychology
A big gap up signals overnight bullish sentiment + short covering, but price will face supply at higher resistance.
🟢 Bullish Plan
🔵 Sustaining above 84,510 (15-min close)
🔵 Upside opens towards 84,954
🔵 Momentum continuation possible above resistance breakout
🔴 Rejection Plan
🔴 Failure to hold 84,510
🔴 Pullback towards 84,038 – 83,800 zone
📌 Why this works
Gap-up rallies sustain only when buyers accept higher prices — otherwise profit booking kicks in.
➖ Scenario 2: FLAT Opening
(Opening between 83,700 – 84,000)
🧠 Psychology
Flat opening inside resistance zone indicates indecision & liquidity hunt.
🟠 No-Trade Zone
🔸 83,800 – 84,038
🔸 Expect whipsaws & fake moves
🟢 Upside Plan
🔵 Break & hold above 84,038
🔵 Move towards 84,510 → 84,954
🔴 Downside Plan
🔴 Breakdown below 83,513
🔴 Weakness towards 83,318
📌 Why this works
Ranges expand after consolidation — patience gives better entries.
🔻 Scenario 3: GAP DOWN Opening (300+ Points)
(Opening near / below 83,318)
🧠 Psychology
Gap down reflects panic selling or global weakness, but strong demand zones attract institutional buying.
🟢 Bounce Setup
🔵 If 83,318 holds
🔵 Pullback possible towards 83,800 – 84,038
🔴 Breakdown Setup
🔴 Break below 83,048 – 82,977
🔴 Downside momentum may accelerate sharply
📌 Why this works
Demand zones either create sharp reversals or fast breakdown continuation.
🛡️ Risk Management Tips (Options Traders)
🟢 Trade only after first 15-min candle confirmation
🟢 Prefer defined-risk spreads in gap openings
🟢 Avoid trading inside No-Trade Zones ❌
🟢 Risk only 1–2% capital per trade
🟢 Book partial profits at resistance/support
🟢 Don’t chase gap moves emotionally 📌
🧾 Summary & Conclusion
📌 SENSEX is in consolidation near resistance
📌 84,510 & 83,513 are key intraday decision levels
📌 Break above 84,954 confirms bullish continuation
📌 Trade reaction at zones, not predictions 📈
⚠️ Disclaimer
This analysis is strictly for educational purposes only.
I am not a SEBI registered analyst.
Please consult your financial advisor before taking any trades.
Market investments are subject to risk.

NIFTY 25000 PE GOOD TO BUY“Expecting Nifty to fall.”
SAFE TO ENTER ONLY ABOEV THIS ZONE
“Nifty is expected to move down.”
“Bearish view on Nifty.”
NLong

Nifty weekly analysis - Detailed Last week Nifty had strong downfall of ~3% because of various factors including global events and selling of FIIs. Week closed with a strong bearish candle with heavy volume showing further downside pressure targeting near draw on liquidity of ~24600. This level has highest volume, which will act as magnet for price.
Order flow is also downside creating lower highs.
Currently price is inside weekly price imbalance zone and at a psychological number of 25000. So, we can expect a pause at this level for few days. So next week may go in range bound mode to bearish.
Over all sentiments are bearish until there is a big positive change appears in global politics.
Critical points ……………….
• Support zone: 24,580–25,050
• Resistance zone: 25,550–25,600
• Bias: Range-bound to mildly bearish for the coming week.
1. If breakout support with volume we may see 24600 levels soon.
Note – if you liked this analysis, please boost the idea so that other can also get benefit of it.
Also follow me for notification for incoming ideas.
Also Feel free to comment if you have any input to share.
Disclaimer: This analysis is for educational purposes only and does not constitute investment advice. Please do your own research (DYOR) and check with your financial advisor before making any trading decisions.

SENSEX : Trading plan for expiry 08-Jan-2026SENSEX Trading Plan for 8-Jan-2026
(Timeframe: 15-min | Gap criteria: 300+ points)
🔑 Key Levels to Track (from chart)
Major Upside Resistance: 85,632
Upper Resistance / Supply Zone: 85,174 – 85,295 (No-Trade Zone)
Immediate Pivot / CMP Zone: ~84,968
Opening Support: 84,772
Last Intraday Support Zone: 84,492 – 84,560
Lower Support Extension: 84,294
🧠 Market context: SENSEX is coming after a sharp corrective move and is currently trying to stabilize near lower supports. The 85,174–85,295 zone is a strong supply area, while 84,492–84,560 remains a crucial buyer’s defense.
🟢 1. GAP-UP OPENING (300+ Points)
If SENSEX opens well above 85,295, it signals strong short-covering but near a heavy resistance zone.
🎓 Educational Insight
Large gap-ups into resistance often see profit booking. Sustainable upside requires acceptance above resistance, not just an opening spike.
Plan of Action
Avoid aggressive longs in first 15 minutes ⏳
Sustain above 85,295 → upside toward 85,632
Failure to hold above 85,295 → expect pullback toward 85,174 → 84,968
Intraday longs only on retest + holding confirmation
Options idea: Bull Call Spread instead of naked calls to manage risk
🟡 2. FLAT OPENING
If SENSEX opens near 84,900 – 85,100, expect range-bound and volatile price action.
🎓 Educational Insight
Flat opens near prior breakdown zones usually lead to false breakouts. Direction emerges only after range expansion with volume.
Plan of Action
Above 85,174 with hold → move toward 85,295
Rejection from 85,174–85,295 → sideways to negative bias
Break below 84,772 → downside toward 84,560
Trade only near edges, avoid middle of range 🚫
Options idea: Iron Fly / Short Strangle (hedged) if index compresses
🔴 3. GAP-DOWN OPENING (300+ Points)
If SENSEX opens below 84,772, bearish sentiment dominates early.
🎓 Educational Insight
Gap-downs into demand zones can trigger panic selling, but also dead-cat bounces. Price behavior at support is more important than the gap itself.
Plan of Action
First demand zone: 84,560 – 84,492
Strong rejection from this zone → intraday bounce possible
Clean break below 84,492 → extension toward 84,294
Avoid fresh shorts exactly at support; wait for breakdown
Options idea: Bear Put Spread or Put Ratio Spread
🛡️ Risk Management Tips (Options Trading)
Risk only 1–2% capital per trade 💰
Prefer spreads near resistance/support to control theta
Avoid trading multiple scenarios simultaneously
Book partial profits fast in volatile markets ⚡
No revenge trades after SL hit 🚫
🧾 Summary & Conclusion
Above 85,295: Bullish continuation toward 85,632
85,174–85,295: Strong No-Trade / Supply Zone
Below 84,772: Weakness toward 84,560 → 84,294
Focus on price acceptance at levels, not gap size 🎯
⚠️ Disclaimer
I am not a SEBI-registered analyst. This analysis is for educational purposes only. Markets involve risk—please consult a certified financial advisor before trading.

Weekly Analysis NiftyWeekly Analysis - Weekly & daily closed all time high. Delivery changed to bullish on higher time frame.
Next delivery level on HTF is 26500.
We may witness consolidation in some session and pullback till BISI then further up move if global supports..
Please do follow me if you liked the idea💡...
Disclaimer ⚠️: This analysis is for educational purposes only and does not constitute investment advice. Please do your own research (DYOR) and check with your financial advisor before making any trading decisions ⚠️⚠️.

BTR Indicator Option Trade | 24 Dec 2025 |+17 Points in BSE PUT Today 24 Dec 2025, the BTR Indicator did not generate any signal in BSE LTD (Cash Market).
Does that mean it was a No Trading Day?
❌ NO. The market never stops.
When the cash market stays silent, professional traders shift focus to OPTIONS.
In this video, I demonstrate:
✔ How to apply BTR Indicator correctly
✔ Why no signal = no trade in cash market
✔ How to identify PUT option opportunity after a bearish bias
✔ BTR-generated BUY entry at 65–66 in BSE PUT
✔ Clean EXIT at 82
✔ +17 points profit using only BTR Indicator
📌 Same Indicator
📌 Same Rules
📌 Different Instrument
⏱️ Timeframe Note
• Recommended for Options using BTR: 5-Minute Chart
• Used in video: 15-Minute (for clarity & learning)
🔑 Key Lesson
Discipline creates consistency.
No force trades. No noise. Only high-probability setups.
📍 Where to Find BTR Indicator
👉 Visit my TradingView Profile
👉 Go to Scripts / Indicators
👉 Add BTR Indicator to your chart
💬 Comment “SCALP” if you want a separate BTR Scalping Guide Video
📊 Follow for more clean intraday & option trades
Follow BTR. Trade Smart. Stay Profitable. 📈🔥
BShort

SENSEX : Trading levels and Plan for 24-Dec-2025SENSEX Trading Plan for 24-Dec-2025
(Chart reference: 15-min | Gap criteria considered: 300+ points)
Key Levels to Track (from chart)
Major Upside Resistance: 86,241.83
Last Intraday Resistance: 85,996.00
Upper Range Resistance: 85,690.62
Opening Support / Resistance (Pivot): 85,453.00 – 85,499.60
Last Intraday Support: 85,131.00
Lower Support: 84,918.00
🟢 1. GAP-UP OPENING (300+ Points)
If SENSEX opens well above 85,690, price enters a strong supply zone immediately.
🎓 Educational Explanation:
A 300+ point gap-up generally reflects strong global or overnight cues. However, when price opens near higher-timeframe resistance, smart money often books profits. Sustainable upside usually comes only after acceptance above resistance or a healthy retest, not from straight vertical moves.
Plan of Action:
If price sustains above 85,690 for 15–20 minutes, look for pullback-based long entries.
First upside hurdle is 85,996; watch for volume expansion and candle acceptance.
Acceptance above 85,996 opens the path toward 86,241.83.
Rejection or exhaustion candles near 85,996–86,241 can trigger a pullback toward 85,690.
Option buyers should avoid chasing CE at the open; confirmation is crucial for better R:R.
🟡 2. FLAT OPENING
A flat open near 85,450–85,550 places SENSEX inside the opening pivot range.
🎓 Educational Explanation:
Flat openings signal equilibrium between buyers and sellers. Direction usually emerges after a clear break of the opening range. Trading inside this zone without confirmation often leads to whipsaws and premium decay for option buyers.
Plan of Action:
Sustaining above 85,499.60 keeps bullish bias intact, targeting 85,690 → 85,996.
Failure to hold 85,453 increases downside risk toward 85,131.
Bullish rejection near 85,131 can offer low-risk bounce trades back to 85,453–85,499.
Breakdown and acceptance below 85,131 shifts momentum toward 84,918.
🔴 3. GAP-DOWN OPENING (300+ Points)
If SENSEX opens below 85,131, early sentiment turns clearly weak.
🎓 Educational Explanation:
Large gap-downs are often driven by panic or negative overnight news. Strong demand zones, however, tend to attract short-covering and positional buying. Selling blindly at support increases the risk of sharp reversals.
Plan of Action:
First support to watch is 85,131 — observe price behaviour and candle structure.
Breakdown below 85,131 opens downside toward 84,918.
Strong bullish reversal signals near 84,918 may lead to a sharp intraday bounce.
Any pullback toward 85,453 after breakdown can be used as a selling-on-rise opportunity.
⚙️ Risk Management Tips for Options Traders 🛡️
Avoid trading the first 10–15 minutes on 300+ point gap days.
Never buy options at resistance or sell at support without confirmation.
Use time-based stop-loss (15–20 minutes) if premium does not move.
Risk only 1–2% of total capital per trade.
Prefer ATM options or defined-risk spreads to manage theta decay.
Book partial profits near marked resistance/support levels.
🧾 Summary & Conclusion
Above 85,690: Bulls stay active; targets 85,996 → 86,241.
Between 85,131–85,690: Market remains balanced; patience is key.
Below 85,131: Sellers gain control unless buyers defend 84,918.
Trade price behaviour at levels, not emotions or predictions.
Consistency comes from discipline, confirmation, and risk control.
⚠️ Disclaimer
I am not a SEBI-registered analyst. This trading plan is for educational purposes only and should not be considered financial or investment advice. Please consult your financial advisor before taking any market positions.

BSE LTD Intraday 22 Dec 2025— +80 Points Bull Setup (BTR)HURRY! Another high-probability intraday trade completed successfully in BSE LTD.
No complexity. No overthinking. Only one rule — Follow BTR Indicator.
🔍 Trade Snapshot
• Stock: BSE LTD
• Date: 22/12/2025
• Timeframe: Intraday
• Indicator Used: BTR Indicator ONLY
🟢 Trade Execution
✔ BTR Indicator generated a clear BUY signal
✔ Entry provided exactly at 2700
✔ Strong bullish momentum followed immediately
🟢 BUY ENTRY: 2700
🎯 Exit Discipline
📌 Follow the system — not emotions
📌 Exit planned and executed as per BTR logic
🔴 INTRADAY EXIT: 2780
📈 TOTAL PROFIT: +80 POINTS
🧠 Strategy Rule (Very Important)
❌ No extra indicators
❌ No noise
❌ No prediction
✅ Only BTR Indicator
✅ Follow the signal
✅ Book profit when system says EXIT
🧠 Strategy Rule (Very Important)
❌ No extra indicators
❌ No noise
❌ No prediction
✅ Only BTR Indicator
✅ Follow the signal
✅ Book profit when system says EXIT
📊 Follow for more high-accuracy intraday setups
💬 Comment if you want to trade using BTR Indicator

BSE Ltd –19 Dec 2025-Intraday Bearish Setup | 15 Points CapturedMarket Structure Insight
After an initial upside move, price failed to sustain above the key Fibonacci retracement zone (0.5–0.618). This area acted as a strong supply zone, clearly visible on the chart.
🔔 BTR Indicator Signal
BTR generated a clear Bearish Signal inside the supply zone
Multiple rejection candles confirmed seller dominance
Momentum shifted from bullish retracement to bearish continuation
🧭 Trade Plan
Short Entry: Near Fib 0.618 rejection zone, BTR Generate Short Signal at 2700
Stop Loss: Above supply zone high
Target: Demand zone / previous low
Exit: Near 2685 as price entered demand zone
✅ Result: +15 Points Intraday Gain
📌 Why This Setup Worked
✔ Fibonacci retracement confluence
✔ BTR bearish confirmation
✔ Lower high formation
✔ Strong demand zone for clean exit
✔ Disciplined risk management

SENSEX : Trading levels and Plan 18-Dec-2025📘 SENSEX Trading Plan for 18-Dec-2025
(Timeframe reference: 15-min | Gap criteria: 300+ points)
Key Levels to Track (from chart):
Opening Resistance: 84,745
Last Intraday Resistance: 84,949
Upper Supply / Extended Target: 85,133
Opening Support: 84,399
Last Intraday Support: 84,003
Lower Support (Extreme): 83,832
🟢 1. GAP-UP OPENING (300+ Points)
If SENSEX opens well above 84,745, price directly enters the resistance/supply region.
🎓 Educational Explanation:
Large gap-ups usually indicate strong overnight sentiment, but they also invite profit booking near resistance. Institutions often test whether new buyers are willing to defend higher prices. Hence, a break–retest–continue structure is healthier than chasing the opening candle.
Plan of Action:
If price sustains above 84,745 for 10–15 minutes, wait for a pullback before considering longs.
First upside hurdle is 84,949; watch price behaviour and volume here.
Acceptance above 84,949 opens the path toward 85,133 (extended supply zone).
Strong rejection or exhaustion near 85,133 can lead to a pullback toward 84,949 → 84,745.
Option buyers should prefer ATM/ITM Calls only after confirmation; avoid chasing spikes at resistance.
🟡 2. FLAT OPENING
A flat open near 84,550–84,650 keeps SENSEX inside a balance area between support and resistance.
🎓 Educational Explanation:
Flat openings indicate indecision. Direction emerges only after one side shows commitment. The first 30 minutes define intraday structure; trading before that often leads to whipsaws.
Plan of Action:
Sustaining above 84,745 turns sentiment positive, targeting 84,949.
Failure to cross 84,745 keeps price range-bound with a downside risk toward 84,399.
Breakdown below 84,399 shifts control to sellers, opening the move toward 84,003.
Bullish reversal patterns near 84,399 can offer low-risk bounce trades toward 84,745.
🔴 3. GAP-DOWN OPENING (300+ Points)
If SENSEX opens below 84,399, early sentiment turns cautious.
🎓 Educational Explanation:
Large gap-downs are often emotion-driven. Smart money waits for price reaction at strong demand zones instead of selling into panic. Many intraday reversals begin from such zones after sellers exhaust.
Plan of Action:
First demand area to watch is 84,003; look for rejection candles or bullish divergence.
A bounce from 84,003 can retrace toward 84,399.
Sustained breakdown below 84,003 exposes 83,832, the extreme support.
Any pullback toward 84,399 after a breakdown becomes a selling-on-rise opportunity.
⚙️ Risk Management Tips for Options Traders 🛡️
Avoid trading in the first 5–10 minutes during 300+ point gap days.
Never buy options at resistance or sell at support—wait for confirmation.
Use time-based stop loss (15–20 minutes) if premium doesn’t move as expected.
Risk only 1–2% of capital per trade; position sizing matters more than accuracy.
Prefer ATM options or spreads during high IV to reduce decay risk.
Book partial profits near key resistance/support zones.
🧾 Summary & Conclusion
Above 84,745: Bulls remain active; targets 84,949 → 85,133.
Between 84,399–84,745: Market stays balanced; patience is key.
Below 84,399: Sellers gain control unless strong demand appears at 84,003.
Focus on structure, confirmation, and disciplined risk management, not prediction.
The best trades come from waiting for price to reach predefined levels.
⚠️ Disclaimer
I am not a SEBI-registered analyst. This trading plan is for educational purposes only and should not be considered as financial or investment advice. Please consult your financial advisor before taking any market positions.

Weekly analysis of Nifty...Here is weekly analysis of Nifty...
Please do follow me if you liked the idea💡...
Disclaimer ⚠️: This analysis is for educational purposes only and does not constitute investment advice. Please do your own research (DYOR) and check with your financial advisor before making any trading decisions ⚠️⚠️.

SENSEX : Trading levels and Plan for 11-Dec-2025📊 SENSEX TRADING PLAN — 11 DEC 2025
Sensex closed around 84,376, sitting just above the Opening Support Zone (84,337–84,400) and below the Opening Resistance (84,631).
Price is at a decision point — a breakout on either side will shape the day’s momentum.
Key Levels from Chart:
• Opening Support Zone: 84,337 – 84,400
• Last Intraday Support: 84,107
• Buyer’s Support Zone: 83,486 – 83,526
• Opening Resistance: 84,631
• Last Intraday Resistance: 84,792
• Major Resistance: 85,209
The opening structure will be crucial in determining the direction.
🚀 1. GAP-UP OPENING (300+ points)
A gap-up above 84,650–84,700 places price close to the Opening Resistance (84,631) or above it, creating immediate bullish pressure.
1. If price opens above 84,631 and retests it
• Avoid chasing the first bullish candle.
• Wait for a retest of 84,631 — confirmation via wick rejection, CHoCH or bullish engulfing.
• If retest holds → Long trade becomes valid.
• Targets: 84,792 → 85,000 → 85,209.
• Book partial profits near 84,792 due to past rejection.
2. If price opens directly inside 84,792 (Last Intraday Resistance)
• Avoid fresh long entries — this is a supply zone.
• Look for rejection patterns.
• Short trades activate only if price falls back below 84,631, indicating a failed breakout.
• Downside targets: 84,500 → 84,400.
3. If breakout sustains above 85,209
• Trend-extension day likely.
• Upside targets: 85,350 → 85,420.
• Trail SL aggressively as volatility rises.
📌 Educational Tip:
A gap-up into resistance is risky — institutions often fade the move. Retest-based entries reduce false signal risk.
⚖ 2. FLAT OPENING (around 84,350–84,450)
Price opens inside or near the Opening Support Zone. This creates both opportunity and risk depending on the breakout direction.
1. If price reclaims 84,631 and sustains
• Indicates early strength.
• Long trades activate after breakout + retest of 84,631.
• Targets: 84,792 → 85,000.
2. If price rejects 84,631
• Lower-high structure signals weakness.
• Short trades valid toward 84,400 → 84,337.
• Break below 84,337 further confirms downside momentum.
3. If price remains inside 84,337–84,400
• Expect choppy action. Avoid taking trades in this range.
• Only trade after price exits this zone with confirmation.
📌 Educational Tip:
Flat opens allow the market to reveal true direction. Wait for early swings to complete before entering.
📉 3. GAP-DOWN OPENING (300+ points)
A gap-down below 84,150–84,200 puts Sensex near last support levels.
1. If price opens near 84,107 (Last Intraday Support)
• Strong buyer responses often occur here.
• Avoid shorting into support.
• Watch for reversal signals (hammer, bullish engulfing).
• If confirmed → Long toward 84,337 → 84,400.
2. If price opens directly inside Buyer’s Support Zone (83,486–83,526)
• This is a powerful demand zone.
• Ideal for high-probability reversal trades.
• Look for bullish structure → Long toward 84,000 → 84,337.
3. If price opens below 83,486 with momentum
• Trend flips bearish.
• Wait for a retest of 83,486 — if rejected → Short continuation toward 83,300–83,250.
• Strict SL is essential due to volatility.
📌 Educational Tip:
Gap-downs into strong support often produce sharp reversals as smart money absorbs panic selling.
🛡 RISK MANAGEMENT TIPS FOR OPTIONS TRADERS
1. Avoid first 5 minutes of trading, especially on gap days.
2. Never buy far OTM options after big gaps — IV crush destroys premium.
3. Use price-action-based SL, not premium SL.
4. Risk only 1–2% of capital per trade.
5. High IV → Use option selling (credit spreads).
Low IV → Option buying becomes more effective.
6. Book partial profits at important levels:
84,631 / 84,792 / 85,209.
7. Avoid revenge trading — capital safety > profits.
📌 SUMMARY & CONCLUSION
• Bullish bias only above 84,631, with clean targets at 84,792 → 85,000 → 85,209.
• Choppy Zone: 84,337–84,400 (avoid trading inside this).
• High-probability reversal zones:
– 84,107
– 83,486–83,526
• Breakout + retest is the most reliable trade structure.
• Strict risk management is essential due to expanding volatility.
⚠ DISCLAIMER
I am not a SEBI-registered analyst.
This trading plan is for educational purposes only, not investment advice.
Market conditions can change quickly — always use your own judgment and proper risk controls.

SENSEX : Trading levels and Plan for 10-Dec-2025📊 SENSEX TRADING PLAN — 10 DEC 2025
Sensex closed near 84,687, positioned inside the No Trade Zone / Opening Support Zone (84,503–84,664).
A clean directional bias will develop only if price exits this zone either upward or downward.
Key Levels from the Chart:
• Opening Resistance (Gap-up case): 84,874
• Last Intraday Resistance Zone: 85,133 – 85,187
• Major Resistance / Target: 85,499
• Opening Support / No Trade Zone: 84,503 – 84,664
• Major Downside Support: 84,111
Tomorrow’s opening will determine momentum and direction.
🚀 1. GAP-UP OPENING (300+ points)
A gap-up above 84,950–85,000 signals strong bullish sentiment with price approaching the resistance cluster.
1. If price opens above 84,874 and retests the level
• Do NOT chase the first green candle.
• Wait for price to retest 84,874 — if it holds (wick rejection / CHoCH), long entry becomes high probability.
• Targets: 85,133 → 85,187 → 85,499.
• Partial profit booking at 85,133–85,187 is recommended due to historical resistance.
2. If price opens directly inside 85,133–85,187 (Last Intraday Resistance Zone)
• Avoid taking fresh longs here — strong selling pressure is expected.
• Look for bearish rejection candles; short trades become valid only when price falls back below 84,874.
• Downside targets: 84,750 → 84,650.
3. If price breaks and sustains above 85,187
• Expect a momentum breakout day.
• Next immediate target: 85,499 (psychological & structural resistance).
• Trail stop-loss aggressively as volatility increases.
📌 Educational Note:
Gap-ups must be validated by retests; institutions often test breakout levels before continuing the trend.
⚖ 2. FLAT OPENING (around 84,650–84,700)
A flat open places price inside the No Trade Zone, requiring patience and clarity.
1. If price reclaims and sustains above 84,874
• Bullish structure begins.
• Long setups activate after breakout + retest of 84,874.
• Targets: 85,133 → 85,187 → 85,499.
2. If price rejects 84,874
• Rejection signals sellers defending resistance.
• Short setups valid back into the range toward 84,664 → 84,503.
3. If price consolidates inside 84,503–84,664 (No Trade Zone)
• Avoid forced trades — whipsaws are common.
• Only trade when price breaks OUTSIDE this zone and confirms direction.
📌 Educational Note:
No-Trade Zones protect traders from low-probability setups. Structure must break before momentum can develop.
📉 3. GAP-DOWN OPENING (300+ points)
A gap-down near 84,250–84,300 places price below the entire support zone.
1. If price opens inside 84,503–84,664 (still within zone)
• This behaves as a liquidity trap; do NOT short immediately.
• Look for bullish reversal patterns → If confirmed → Long toward 84,750 → 84,874.
2. If price opens near 84,111 (Major Support)
• This is the strongest demand zone in your chart.
• Watch for reversal signs (hammer, bullish engulfing, CHoCH).
• Upon confirmation → Long toward 84,503 → 84,664.
• Ideal reward:risk reversal zone.
3. If price breaks below 84,111 with strength
• Avoid catching a falling knife.
• Wait for retest of 84,111.
• If retest rejects → Short continuation toward 83,950–83,900.
• Trend becomes decisively bearish.
📌 Educational Note:
Gap-downs often create panic selling, but institutional buyers frequently accumulate at major support zones. Confirmation saves capital.
🛡 RISK MANAGEMENT TIPS FOR OPTIONS TRADERS
1. Avoid trading the first 5 minutes—premium swings can trap traders.
2. Never buy far OTM options after big gap openings—IV crush = rapid losses.
3. Always use price-action-based stop-loss, not premium-based.
4. Risk only 1–2% of capital per trade.
5. High IV → favour option selling (credit spreads).
Low IV → option buying becomes effective.
6. Book partial profits at major levels:
84,874 / 85,133 / 85,187 / 85,499
7. Avoid revenge trading — protect capital first.
📌 SUMMARY & CONCLUSION
• Bullish momentum only above 84,874, with upside toward 85,133 → 85,187 → 85,499.
• No Trade Zone: 84,503–84,664 — avoid trading inside.
• Strong reversal zones:
– 84,503–84,664
– 84,111
• Gap-up and gap-down scenarios require retest confirmation for high-probability entries.
• Discipline and risk management matter more than direction.
⚠ DISCLAIMER
I am not a SEBI-registered analyst.
This trading plan is for educational purposes only and should not be considered investment advice.
Market conditions may change rapidly—always apply your own judgment and strict risk management.

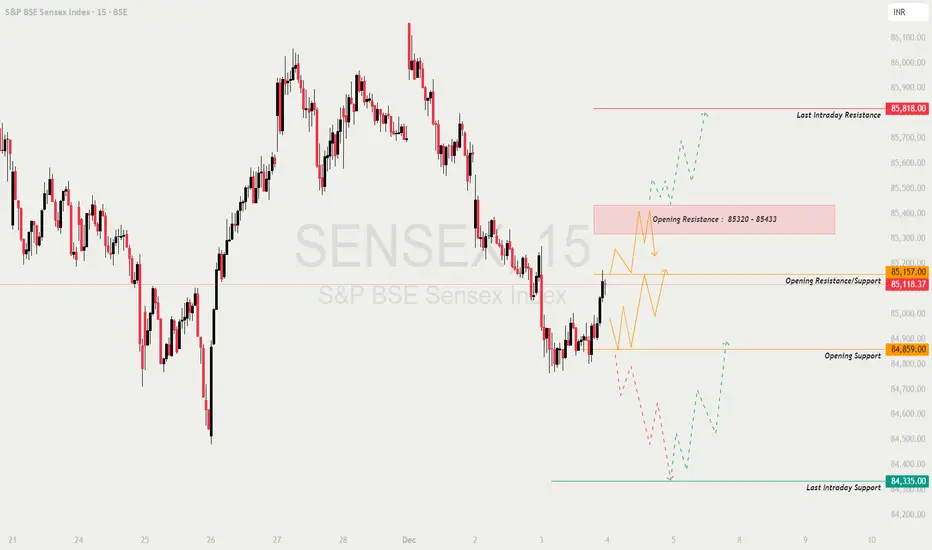
SENSEX : Trading levels and Plan for 04-Dec-2025📊 SENSEX TRADING PLAN — 04 DEC 2025
Price closed near 85,118, sitting just below key zones:
• Opening Resistance/Support: 85,157
• Opening Support: 84,859
• Opening Resistance Zone: 85,320–85,433
• Last Intraday Resistance: 85,818
• Last Intraday Support: 84,335
The market recently bounced from lows but still sits within a corrective structure. Tomorrow’s opening direction will decide whether SENSEX attempts to retest upper resistance zones or slides back toward the 84,335 support region.
🚀 1. GAP-UP OPENING (300+ points)
A gap-up above 85,433 or directly inside the Opening Resistance Zone (85,320–85,433) demands patience and confirmation-based trading.
1. If price opens inside 85,320–85,433
• Avoid chasing longs immediately.
• This zone historically attracts sellers.
• Wait to see if price rejects with wicks or bearish CHoCH.
• Short entries become valid only if price falls back below 85,157.
• Downsides: 84,859 → 84,600.
2. If price opens above 85,433
• Look for a retest of 85,320–85,433 before entering long.
• If retest holds → Upside targets toward 85,600 → 85,818.
• This is the highest-probability long of the day.
3. Breakout above 85,818 (Last Intraday Resistance)
• Needs a strong bullish candle close.
• If sustained → Momentum expansion toward 86,000+ possible.
• Book partial profits near earlier swing highs to reduce risk.
📌 Educational Note:
A gap-up often creates FOMO. But professional traders wait for retests because they reduce risk and confirm buyer strength.
⚖ 2. FLAT OPENING (±80 pts around 85,118)
A flat open allows structure-based trading on both sides, offering cleaner setups.
1. If price sustains above 85,157
• Buyers show early strength.
• Upside targets: 85,320 → 85,433 → 85,600.
• Watch for a breakout continuation setup.
2. Rejection from 85,157
• With bearish candle patterns → Short opportunity.
• Initial targets: 84,859 → 84,600.
3. If price trades between 84,859–85,157
• Expect range-bound behavior.
• Trade only extremes with confirmation:
– Buy near 84,859,
– Sell near 85,157.
📌 Educational Note:
Flat openings reveal direction through early structure shifts. The key is waiting for higher-lows (bullish) or lower-highs (bearish).
📉 3. GAP-DOWN OPENING (300+ points)
Gap-down openings near or inside the Last Intraday Support (84,335) require patience and caution.
1. If price opens inside 84,335 Support Zone
• Do NOT short blindly—this is a reaction zone.
• Look for reversal signs: hammer, bullish engulfing, CHoCH.
• If reversal confirmed → Long toward 84,859 → 85,157.
2. If price breaks below 84,335 on opening
• Avoid chasing breakdowns.
• Wait for a retest of 84,335.
• If rejection appears → Short entry toward 84,150 → 84,000.
3. Strong recovery after Gap-Down (V-Shape)
• If price quickly reclaims 84,335, buyers are active.
• Above 84,859 → Trend shifts bullish intraday.
• Upside targets: 85,157 → 85,320.
📌 Educational Note:
Gap-downs often act as liquidity sweeps—smart money absorbs selling pressure before pushing price upward.
🛡 RISK MANAGEMENT TIPS FOR OPTIONS TRADERS
1. Avoid first 5–10 minutes of trading after big gap openings.
Market needs time to stabilize.
2. Never buy OTM options after a big gap.
Premium decay will eat your trade.
3. Use price action–based stops instead of premium-based SL.
4. Position sizing rule:
Risk ONLY 1–2% of your capital per trade.
5. High IV → Prefer option selling.
Low IV → Option buying becomes efficient.
6. Book profits near key levels (e.g., 84,859, 85,157, 85,320, 85,433).
7. Avoid revenge trading or entering against strong trends without confirmation.
📌 SUMMARY & CONCLUSION
• Bullish bias above 85,320–85,433, with potential toward 85,818.
• Range-bound behaviour likely between 84,859–85,157.
• High-probability reversals expected from 84,335 on gap-down.
• Wait for retests and confirmations before entering trades.
• Follow structure strictly—levels decide the direction.
⚠ DISCLAIMER
I am not a SEBI-registered analyst.
All information above is for educational purposes only and not investment advice.
Markets are dynamic—always apply your own judgment and risk management.
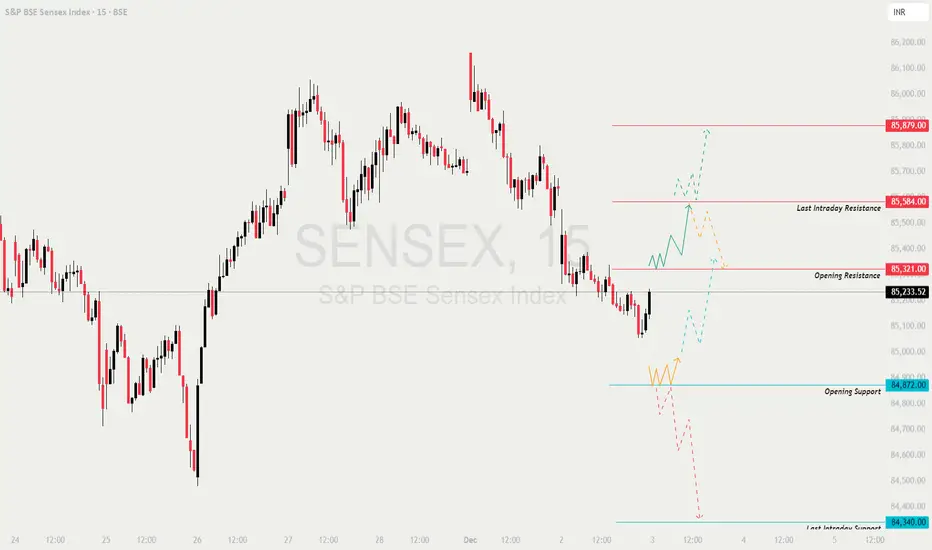
SENSEX : Trading levels and Plan for 03-Dec-2025📊 SENSEX TRADING PLAN — 03 DEC 2025
Sensex closed near 85,233, right below the Opening Resistance (85,321).
The structure shows a base at 84,872 and intraday resistance at 85,584, with clear upside and downside liquidity zones.
The opening trend will depend on how the index behaves around 85,321 and 84,872.
🔍 KEY MARKET LEVELS
🟥 Opening Resistance: 85,321
🟥 Last Intraday Resistance: 85,584
🟥 Major Bull Target: 85,879
🟩 Opening Support: 84,872
🟩 Last Intraday Support: 84,340
🟩 Major Bear Target: 84,150 – 84,050
🟢 SCENARIO 1 — GAP-UP OPENING (300+ POINTS)
Expected opening: 85,500–85,600 region (inside or near last intraday resistance)
If the market opens above 85,500, it will directly test the 85,584 resistance (supply zone).
For long continuation:
✔️ Break above 85,584
✔️ Retest candle with a strong lower wick
🎯 Targets → 85,720 → 85,879
If candles show rejection at 85,584 (upper wicks, volume drop):
Expect profit-booking toward:
➡️ 85,450 → 85,321
Aggressive short traders may fade the rejection from 85,584, but only with confirmation such as lower highs on 3–5 min charts.
📘 Educational Insight:
Gap-ups into major resistance are high-risk for longs.
Always wait for either a clean breakout or a clear rejection before acting.
🟧 SCENARIO 2 — FLAT OPENING (Around 85,200–85,300)
Price will open exactly near the Opening Resistance (85,321) — a decision zone.
Upside trigger for long trades:
✔️ Break + sustain above 85,321
🎯 Targets → 85,420 → 85,500 → 85,584
Downside trigger for shorts:
✔️ Break below 85,150
🎯 Targets → 84,990 → 84,872
Avoid taking positions inside a tight range around 85,200–85,321 until a clear directional candle closes.
Most reliable setups:
— Retest of 85,321 for longs
— Retest of 85,150 breakdown for shorts
💡 Educational Note:
Flat openings require patience.
Trend becomes clear after the first 3–4 candles—avoid impulse trades.
🔻 SCENARIO 3 — GAP-DOWN OPENING (300+ POINTS)
Expected opening: 84,800–84,900 zone (near Opening Support)
If price holds 84,872, expect a reversal bounce toward:
➡️ 85,050 → 85,150 → 85,321
For safe long reversal entries:
✔️ Support respected for 3–4 candles
✔️ Higher low structure
✔️ Bullish reversal wick at support
If breakdown occurs below 84,872 with strength:
Sellers will target → 84,600 → 84,480 → 84,340
Major breakdown trigger:
✔️ Sustained trade below 84,340
🎯 Targets → 84,150 → 84,050
📘 Educational Note:
Gap-downs into strong support often generate false breakdowns.
Let the retest after the first breakdown decide the direction.
💼 RISK MANAGEMENT TIPS FOR OPTIONS TRADERS 📘⚠️
Trade only after the first 5–10 minutes to avoid trap candles.
Use ITM options for momentum trades to reduce theta decay.
Keep stop-loss based on chart levels, not random premium numbers.
Do not average losing trades — exit and re-enter on new structure.
Trail SL after each target hit (especially in strong trends).
Avoid naked selling near event days or high VIX.
Stop trading after 2 consecutive losses.
💡 Pro Tip:
When market enters a “No Trade Zone”, shift focus from trading to observing liquidity behaviour.
📌 SUMMARY
Bullish Above:
✔️ 85,321 → 85,420 → 85,500 → 85,584 → 85,879
Bearish Below:
✔️ 85,150 → 84,990 → 84,872 → 84,600 → 84,340 → 84,150
Critical Zones:
🟥 Major Resistance → 85,584
🟩 Major Support → 84,872, 84,340
Trend Deciders:
🔑 Above 85,321 → Bullish day
🔑 Below 84,872 → Intraday weakness
🔑 Below 84,340 → Trend breakdown
🧾 CONCLUSION
Sensex is at a crucial turning point.
The market tone for 03-Dec will be set by how price behaves around:
✔️ 85,321 on the upside
✔️ 84,872 on the downside
Follow levels, not emotions.
Avoid trades in indecisive ranges and strike only on confirmed breakouts or clean retests.
⚠️ DISCLAIMER
I am not a SEBI-registered analyst.
This analysis is for educational and study purposes only.
Consult a certified financial advisor before investing or trading.
SENSEX : Trading levels and Plan for 27-Nov-2025📊 SENSEX TRADING PLAN — 27 NOV 2025
Sensex closed near 85,598, sitting just below the No-Trade Zone (85,464–85,597) and heading toward a crucial resistance cluster at 85,999–86,143.
Market structure shows bullish momentum, but overhead supply requires caution around the opening.
Key Levels for the Day
🟨 No Trade Zone: 85,464 – 85,597
🟥 Last Intraday Resistance: 85,999 – 86,143
🟩 Last Intraday Support: 85,165 – 85,272
🟩 Major Downside Level: 84,775
🟢 SCENARIO 1 — GAP-UP OPENING (300+ Points)
If Sensex opens around 85,900–86,050, it enters directly into the large resistance zone.
If price SUSTAINS ABOVE 86,143 for 10–15 minutes →
⭐ Upside continuation targets: 86,260 → 86,340 → 86,430
If price rejects the resistance zone (85,999–86,143) →
Expect pullback to: 85,750 → 85,597
Do NOT chase longs immediately at open — gap-up into resistance often traps buyers.
Best long setup = Breakout → Retest → Confirmation above 86,143.
📘 Educational Note:
Every time price opens near multi-day resistance, early volatility is normal. Smart traders wait for confirmation instead of reacting emotionally.
🟧 SCENARIO 2 — FLAT OPENING (Near 85,450–85,600)
A flat opening inside the No-Trade Zone makes this a patience-based market at the start.
A breakout above 85,597 →
Targets: 85,750 → 85,999 → 86,143
A breakdown below 85,464 →
Targets: 85,350 → 85,272 (support test)
Avoid taking trades inside the 85,464–85,597 zone — it is explicitly a no-trade area due to whipsaws.
Best trades:
✔️ Breakout retest above 85,597
✔️ Support bounce near 85,272
✔️ Breakdown below 85,165 (trend continuation)
💡 Educational Tip:
Flat openings are the BEST for identifying trend direction.
Let the first 15-min candle close before committing to a trade.
🔻 SCENARIO 3 — GAP-DOWN OPENING (300+ Points)
A gap-down near 85,100–85,200 brings price directly to Last Intraday Support (85,165–85,272).
If 85,165–85,272 holds strongly →
Reversal targets → 85,350 → 85,464 → 85,597
If price breaks below 85,165 →
Expect downside continuation toward → 85,020 → 84,775
A strong bullish wick on support may produce one of the best long trades of the session.
If momentum candles form below 85,165, avoid long entries — trending down day likely.
📘 Educational Note:
Gap-downs near major support often produce V-shaped bounces — wait for confirmation via higher lows before entering.
💼 RISK MANAGEMENT TIPS FOR OPTIONS TRADERS 💡
Avoid trading the first 5–10 minutes on large gap openings.
Prefer ATM or slightly ITM options for directional clarity.
Keep SL fixed based on structure — never widen SL emotionally.
Avoid averaging losing trades (discipline > hope).
When VIX is low → option buying works better.
When VIX is high → hedged selling or credit spreads are safer.
Partial profit booking is essential near major zones like 85,999 & 86,143.
⚠️ Golden Rule:
Long-term profitability = Protect capital first, chase profits later.
📌 SUMMARY
Bullish Above → 85,597
Targets → 85,750 → 85,999 → 86,143 → 86,260
Bearish Below → 85,272
Targets → 85,165 → 85,020 → 84,775
No-Trade Zones:
— 85,464–85,597 (Flat opening whipsaw zone)
— 85,999–86,143 (High-risk supply zone unless breakout confirmed)
🧾 CONCLUSION
Sensex is approaching a heavy resistance cluster.
The most reliable trades will come from:
✔️ Breakout + Retest above 85,597
✔️ Reversal opportunities near 85,165–85,272
✔️ Strong continuation above 86,143
✔️ Breakdown setups below 85,165
Avoid noise — trade only when structure is clear.
⚠️ DISCLAIMER
I am not a SEBI-registered analyst.
This analysis is purely for educational purposes.
Please consult your financial advisor before trading or investing.

SENSEX : Trading levels and Plan for 20-Nov-2025Request you please hit LIKE or BOOST button - Like Target 25
📊 SENSEX TRADING PLAN — 20 NOV 2025
(Timeframe: 15-min | Reference: Key price reaction zones & intraday structure)
SENSEX closed around 85,176, sitting directly inside the No-Trade Zone (85,026 – 85,232) which indicates indecision and potential volatility at tomorrow’s open. Price is just below a strong resistance cluster at 85,577 – 85,612, and a major upside extension level at 85,999.
Key Zones to Track:
🟧 No-Trade Zone: 85,026 – 85,232
🔴 Last Intraday Resistance: 85,577 – 85,612
🔴 Major Resistance / Profit Booking Zone: 85,999
🟩 Opening Support: 85,026
🟩 Last Intraday Support: 84,882
🟩 Major Support: 84,678
Below is the complete action plan for all opening scenarios 👇
🟢 SCENARIO 1 — GAP UP OPENING (300+ points)
If SENSEX opens at 85,450+, price will approach or enter the Last Intraday Resistance Zone (85,577 – 85,612).
If price sustains above 85,612 for 10–20 mins with strong candles →
🎯 Upside targets = 85,750 → 85,880 → 85,999
If price rejects from 85,577–85,612 →
Expect a correction down to:
➡️ 85,400 → 85,232
Avoid immediate buying on a gap-up directly under resistance since high probability of profit booking.
Safer entry = Breakout → Retest → Continuation above 85,612.
📘 Educational Tip:
Gap-ups into supply zones often trigger selling. Confirmation candles are essential before entering long positions.
🟧 SCENARIO 2 — FLAT OPENING (Around 85,100–85,200)
A flat open places price inside the No-Trade Zone (85,026 – 85,232) — avoid impulsive entries.
If price sustains above 85,232, bullish bias activates.
🎯 Targets → 85,350 → 85,450 → 85,577
If price breaks below 85,026, bearish leg likely.
📉 Targets → 84,882 → 84,678
Best trades:
— Breakout from 85,232
— Breakdown from 85,026
Avoid trading in the middle of the No-Trade Zone.
💡 Educational Note:
Flat openings inside equilibrium zones often generate false moves. Wait for a clear breakout before positioning.
🔻 SCENARIO 3 — GAP DOWN OPENING (300+ points)
If SENSEX opens around 84,700–84,800, price lands near the Last Intraday Support (84,882) and may test deeper support at 84,678.
Bullish reversal is possible if 84,678–84,882 holds with wick rejections →
🎯 Upside targets → 85,026 → 85,232 → 85,350
If price fails 84,678 →
Strong bearish continuation
📉 Targets → 84,520 → 84,400
This zone provides high RR reversal trades — but only with confirmation.
Avoid trying to catch falling knives without structure.
📘 Educational Tip:
Gap-downs entering demand zones typically give the day’s biggest reversal moves — but always after confirmation, not anticipation.
💼 RISK MANAGEMENT TIPS FOR OPTION TRADERS 💡
Trade only after first 5–10 min to avoid opening volatility.
Use ITM options for directional intraday trades.
Keep SL strictly at 20–30% of premium for option buying.
Do NOT average losing trades.
In higher VIX, prefer spreads (Credit/Debit spreads).
Take partial profit at 30–40% and trail SL.
Avoid trading inside No-Trade Zones — unnecessary chop kills premium.
⚠️ Golden Rule:
Capital protection > catching a move. One good trade a day is enough for consistent profitability.
📌 SUMMARY
Bullish Above → 85,232
Targets → 85,350 → 85,450 → 85,577 → 85,612 → 85,999
Bearish Below → 85,026
Targets → 84,882 → 84,678 → 84,520
High-Risk Zone:** 85,026–85,232 (No-Trade Zone)**
Major Reversal Zone:** 85,577–85,612
🧾 CONCLUSION
SENSEX sits at an equilibrium zone before a major directional move.
The most reliable trades will come from:
✔️ Breakout above 85,232
✔️ Rejection from 85,577–85,612
✔️ Reversal from 84,678–84,882 support
Let the market give direction — avoid forcing trades inside the No-Trade Zone.
⚠️ DISCLAIMER
I am not a SEBI-registered analyst.
This analysis is for educational purposes only and not investment advice. Please consult a certified financial advisor before taking any trading decisions.

SENSEX : Trading levels and plan for 18-Nov-2025📊 SENSEX TRADING PLAN — 18 NOV 2025
(Timeframe Reference: 15-Min Chart)
Chart Summary:
Sensex closed near 84,920 , maintaining its upward bias after recent strength, but now approaching multiple resistance levels that could trigger either continuation or profit booking.
Key resistance zones are seen around 85,081 (Opening Resistance – Gap-Up Case) and 85,437 (Last Intraday Resistance) . On the downside, key supports lie near 84,730 (Opening Resistance / Support) , 84,231 (Opening Support) , and 83,800 (Last Intraday Support) .
Overall bias remains moderately bullish above 84,730 , but traders should stay cautious near upper resistances as momentum could fade. The session may begin with volatility due to proximity to crucial resistance zones.
Key Zones to Watch:
🟩 Supports: 84,730 / 84,231 / 83,800
🟥 Resistances: 85,081 / 85,437
⚖️ Bias: Bullish above 84,730 | Bearish below 84,231
🟢 Scenario 1: GAP-UP Opening (300+ Points)
If Sensex opens around or above 85,200 – 85,250 , it will start near the Last Intraday Resistance (85,437) zone. Gap-ups at such elevated levels often trigger early volatility or profit booking before trend continuation.
If Sensex sustains above 85,081 – 85,150 for 15–20 minutes with strong bullish candles and increasing volume, it may continue higher toward 85,437 – 85,500+ .
If it faces rejection near 85,437 , expect a pullback toward 84,950 – 84,800 .
Avoid aggressive buying on opening candles; instead, wait for a retest of 85,081 as support before re-entering.
For intraday traders, use quick trailing stops and partial booking near resistance levels to protect profits.
💡 Educational Note:
Gap-ups at resistance levels often trigger two-way action. The key is to watch whether price accepts or rejects that resistance. Sustained trading above the level shows real strength, while early rejection signals smart money profit booking.
🟧 Scenario 2: FLAT Opening (Around 84,900 – 84,950 Zone)
A flat open near the previous close keeps Sensex within the neutral transition zone . The first 15–20 minutes will be critical to determine trend direction.
If price sustains above 84,950 – 85,000 , expect bullish continuation toward 85,081 – 85,437 .
If Sensex breaks below 84,730 , a short-term retracement toward 84,400 – 84,231 may follow.
Avoid trading inside the tight range of 84,730 – 84,950 initially; let market direction develop first.
Volume-backed breakouts with clean candle structure are more reliable than early volatile spikes.
🧠 Educational Tip:
Flat openings often trap impatient traders who enter without confirmation. Wait for structure formation — the first few 15-min candles act as the “tone-setter” for the entire session. Trade only when price shows commitment beyond key zones.
🔴 Scenario 3: GAP-DOWN Opening (300+ Points)
If Sensex opens near 84,600 – 84,500 , it will directly test the Opening Support (84,231) . This area could either trigger a bounce or lead to deeper correction depending on reaction strength.
If Sensex shows buying momentum or reversal candles (hammer, bullish engulfing) near 84,231 , expect a rebound toward 84,600 – 84,730 .
If the index fails to hold 84,231 , expect a slide toward 83,950 – 83,800 .
Avoid panic shorting immediately after open; let the price test and confirm breakdown before entering trades.
If volume tapers off near the low while price holds stable, it may indicate seller exhaustion — a possible setup for intraday recovery.
📘 Educational Insight:
Gap-downs near strong supports often create “false panic.” Smart traders focus on price reaction, not emotion. When supports hold firm on declining volume, it’s often a sign of strength disguised as weakness.
💼 RISK MANAGEMENT TIPS FOR OPTIONS TRADERS:
Avoid trading during the first 15 minutes — wait for confirmation after volatility settles.
Do not risk more than 1–2% of total capital per trade .
For directional trades, prefer ATM or slightly ITM options — they respond faster and reduce time decay.
Avoid deep OTM options unless market momentum is clearly one-sided.
Always set stop-loss — no strategy survives without it.
Trail profits as soon as your trade moves 30–40 points in your favor.
If volatility spikes sharply (due to global cues or events), consider staying flat or scalping small moves.
⚠️ Golden Rule:
Capital preservation > Aggressive positioning. Your goal is to trade multiple sessions safely — not to win every trade but to avoid large losses.
📈 SUMMARY:
🟩 Supports: 84,730 / 84,231 / 83,800
🟥 Resistances: 85,081 / 85,437
⚖️ Bias: Bullish above 84,730 | Bearish below 84,231
🎯 Levels to Watch:
- Above 85,081 → Targets: 85,300 / 85,437
- Below 84,231 → Targets: 84,000 / 83,800
📚 CONCLUSION:
Sensex stands at a crucial resistance zone with clear short-term momentum but possible intraday volatility. Sustaining above 85,081 can push the index toward 85,437 , while failure to hold 84,730 may trigger intraday corrections toward 84,231 .
For 18th November, the focus should be on structure, not emotion — trade the confirmed breakout or breakdown rather than guessing the direction. Stay flexible and adaptive to market reactions.
📊 Trading isn’t about predicting — it’s about preparing and responding intelligently to what unfolds.
⚠️ DISCLAIMER:
I am not a SEBI-registered analyst . The analysis shared here is purely for educational and informational purposes . Please do your own research or consult a certified financial advisor before making any trading or investment decisions.

SENSEX : Trading levels and plan for 17-Nov-2025📊 SENSEX TRADING PLAN — 17 NOV 2025
(Timeframe Reference: 15-Min Chart)
Chart Summary:
Sensex closed around 84,654 , showing a recovery from the recent lows but still within a mixed-to-cautious phase. The price currently hovers near 84,730 (Opening Resistance / Support Zone) , suggesting a tight equilibrium between buyers and sellers.
Immediate resistance is placed at 85,081 (Gap-Up Opening Resistance) , followed by 85,437 (Last Intraday Resistance) . On the downside, supports lie near 84,231 (Opening Support) and 83,800 (Last Intraday Support) .
The overall bias remains neutral to bullish as long as the index holds above 84,231 . A breakout above 84,730 could push the index toward higher zones, whereas a failure to hold 84,231 may invite a deeper retracement.
Key Zones to Watch:
🟩 Support Levels: 84,231 / 83,800
🟥 Resistance Levels: 84,730 / 85,081 / 85,437
⚖️ Bias Zone: Between 84,231 – 84,730 (Consolidation area, watch for breakout confirmation)
---
🟢 Scenario 1: GAP-UP Opening (300+ Points)
If Sensex opens around or above 85,000 – 85,100 , it will directly enter the Gap-Up Resistance Zone (85,081) . This could attract early profit-booking as the price approaches the upper resistance levels.
If Sensex sustains above 85,081 for 15–20 minutes with strong bullish candles, targets open toward 85,300 – 85,437 .
If price rejects 85,081 with visible upper wicks or doji candles, a pullback toward 84,730 – 84,600 could occur.
Avoid immediate long entries on the gap-up — wait for price to retest 85,000 – 85,050 for confirmation of support.
A strong sustained move above 85,100 may indicate fresh buying momentum for the day.
💡 Educational Note:
When a market gaps up near resistance, emotions drive early buying. But true confirmation comes only when the breakout is sustained with rising volume. Patience after the open often reveals whether bulls truly have control.
---
🟧 Scenario 2: FLAT Opening (Around 84,600 – 84,700 Zone)
A flat opening near 84,730 would place Sensex right inside the equilibrium zone. Such opens usually result in initial range-bound movement before breakout direction appears.
Avoid trading within 84,600 – 84,730 in the first 15–20 minutes; allow market structure to form.
If price sustains above 84,730 , upside targets open toward 85,081 – 85,437 .
If the price breaks below 84,600 , weakness may pull it toward 84,231 .
Look for volume-backed breakouts — confirmation candles (close outside the range) are critical before entries.
🧠 Educational Tip:
Flat openings test patience. Avoid predicting direction inside consolidation zones — instead, let price action show its hand. Real traders act on confirmation, not anticipation.
---
🔴 Scenario 3: GAP-DOWN Opening (300+ Points)
If Sensex opens near 84,200 – 84,300 , it will test the Opening Support (84,231) . A further slip below this could extend weakness toward 83,800 (Last Intraday Support) .
If price stabilizes and forms bullish candles (hammer or engulfing) near 84,200 – 84,250 , a pullback toward 84,600 – 84,730 can be expected.
If breakdown below 84,231 occurs with volume, next support to watch is 83,800 .
Avoid panic shorting after a gap-down; instead, wait for a retest near 84,400 – 84,450 for safe entries with better risk-reward.
Declining volume on red candles near supports often signals seller exhaustion — use this as an early reversal clue.
📘 Educational Insight:
Gap-downs often trigger emotional selling, but seasoned traders focus on price structure. Watch how the market reacts near key supports — rebounds from strong zones often give high-probability intraday setups.
---
💼 RISK MANAGEMENT TIPS FOR OPTIONS TRADERS:
Do not trade immediately after market open — the first 15 minutes are for observation, not execution.
Keep trade risk limited to 1–2% of total trading capital .
Use ATM or slightly ITM options for directional trades — they provide better delta and lower time decay impact.
Avoid trading deep OTM options unless momentum is clear — these lose value quickly.
Always place a stop-loss ; never hold losing positions hoping for reversal.
Trail your stop once the trade moves 30–40 points in your favor — protect your profits.
If the day turns range-bound or choppy, step aside. The best traders are also the best at not trading.
⚠️ Golden Reminder:
Capital preservation is your first job. Surviving to trade tomorrow is more important than winning every trade today.
---
📈 SUMMARY:
🟧 Neutral Zone: 84,600 – 84,730
🟥 Resistance Zones: 85,081 / 85,437
🟩 Support Zones: 84,231 / 83,800
⚖️ Bias: Bullish above 84,730 | Bearish below 84,231
---
📚 CONCLUSION:
Sensex sits at a crucial juncture, consolidating between 84,231 – 84,730 . A breakout above 84,730 could fuel a rally toward 85,437 , while a breakdown below 84,231 may drag the index to 83,800 .
For 17 Nov, focus on confirmation over anticipation. Let volume and price action lead your decisions. The key is to remain objective — not bullish or bearish, but responsive.
📊 Remember: You don’t need to trade every move; you need to trade the right one with discipline.
---
⚠️ DISCLAIMER:
I am not a SEBI-registered analyst . The analysis shared here is purely for educational and informational purposes . Please conduct your own research or consult a certified financial advisor before making any trading or investment decisions.

Tomorrow Gap UP or Huge Gap DOWN market - UP (30%) or DOWN (70%)Sir/Mam,
Tomorrow mostly market will be gap up to manipulate the seller's or Huge Gap down to manipulate buyers. Whichever side opens it will react opposite way of Direction. For e.g. if it opens by 26000 or above - then buy 26150 CE and 26000 PE, book profit for the one side momentum same for gap down, if its open at 25750 buy 25850 CE and 25700 PE, book profit for the one side momentum.
If the market opens flat, then wait till expiry day, because premium will decay from both sides.
Hope you enjoyed today.
Let's blast for tomorrow.

SENSEX : Trading levels and Plan for 13-Nov-2025📊 SENSEX TRADING PLAN — 13 NOV 2025
(Timeframe Reference: 15-Min Chart)
Chart Summary:
Sensex closed near 84,432 , forming a small consolidation candle just below the Opening Resistance (84,724) . The index remains within a defined No-Trade Zone (84,308 – 84,523) , indicating indecision before the next directional move. The short-term trend remains constructive, but bulls need a sustained breakout above 84,724 to regain momentum, while bears will attempt to push the index below 84,308 for downside continuation.
Key Zones to Watch:
🟩 Support Levels: 84,308 / 83,966
🟥 Resistance Levels: 84,724 / 84,874 / 85,266
⚖️ Bias Zone: 84,308 – 84,523 (No-Trade Zone)
🟢 Scenario 1: GAP-UP Opening (300+ Points)
If Sensex opens above 84,700 – 84,800 , it will start near or above the Opening Resistance . Bulls must hold this level to confirm a continuation of upward momentum.
If price sustains above 84,874 with strong bullish candles and volume expansion, upside targets open toward 85,100 – 85,266 .
However, if Sensex opens higher but fails to sustain above 84,724 – 84,874 , it may lead to profit booking and a pullback toward 84,523 – 84,308 .
Traders should wait for confirmation — avoid chasing a gap-up. Look for a breakout retest around 84,724 for safer entries.
If rejection candles appear near 85,100 – 85,266 , consider partial profit booking or trailing stops.
💡 Educational Note:
Gap-ups around resistance zones often attract excitement from retail traders but smart money waits for confirmation. Always look for candle structure and volume support. Strong breakouts hold above key levels, while fakeouts quickly revert into range-bound movement.
🟧 Scenario 2: FLAT Opening (Within 84,308 – 84,523 Zone)
A flat opening within this zone indicates indecision. The market could spend some time consolidating before deciding on direction.
Avoid trading within the No-Trade Zone (84,308 – 84,523) as volatility and fake moves are common here.
If the index breaks and sustains above 84,523 , expect bullish momentum toward 84,724 – 84,874 .
If price breaks below 84,308 , weakness could extend toward 83,966 .
Always wait for volume confirmation — sideways breakouts without participation are unreliable.
🧠 Educational Tip:
Flat openings test a trader’s discipline. The first 30 minutes usually decide the session’s direction. Instead of predicting, react to what the market shows. Staying patient during early whipsaws helps capture clean trends later in the session.
🔴 Scenario 3: GAP-DOWN Opening (300+ Points)
If Sensex opens below 84,150 – 84,000 , bearish sentiment will dominate early trade. Watch the Last Intraday Support (83,966) closely — this zone is vital for bulls to defend.
If reversal patterns like hammer or bullish engulfing appear near 83,966 , short-covering rallies toward 84,308 – 84,523 are likely.
If price fails to hold above 83,966 , weakness may extend toward 83,700 – 83,500 .
Avoid shorting immediately at the open during a deep gap-down; wait for a pullback toward resistance for better entries.
Volume near supports will reveal strength — falling volume suggests exhaustion and potential reversal setups.
📘 Educational Insight:
Gap-downs often bring panic-driven reactions. Smart traders wait for price to stabilize before acting. Watch the candle structure — strong rejection wicks at support zones often signal short-term reversals and high-probability entries.
💼 RISK MANAGEMENT TIPS FOR OPTIONS TRADERS:
Avoid trading in the first 15–20 minutes after open — IV (Implied Volatility) spikes during this time and can distort option prices.
Risk a maximum of 1–2% of total capital on any single trade.
Prefer ITM or ATM options for directional confidence; avoid far OTM options in range-bound conditions.
Trail stop-loss after every 30–40 points in your favor to lock profits.
Avoid holding naked positions near resistance or support zones before confirmation.
Always maintain a risk-reward ratio of at least 1:2 — quality over quantity wins in the long run.
📈 SUMMARY:
🟧 No-Trade Zone: 84,308 – 84,523
🟥 Resistance Zones: 84,724 / 84,874 / 85,266
🟩 Support Zones: 84,308 / 83,966
⚖️ Bias: Bullish above 84,523 | Weakness below 84,308
📚 CONCLUSION:
Sensex is trading near a decisive zone — the 84,308 – 84,523 range will dictate tomorrow’s trend. A breakout above 84,523 can trigger a move toward 84,874 – 85,266 , while a drop below 84,308 may invite selling pressure toward 83,966 .
Patience and confirmation are key — avoid trading inside the no-trade zone and wait for directional clarity. React to price, not emotion.
📊 In trading, patience and preparation are your strongest edges — execution follows clarity, not anticipation.
⚠️ DISCLAIMER:
I am not a SEBI-registered analyst . The analysis shared above is purely for educational purposes . Please do your own research or consult a certified financial advisor before making any trading or investment decisions.

Market Gap UP 100% - Nifty 50, Nifty Bank and SensexSir/Mam,
Tomorrow market will be gap up and after that it will fill their gap of each (check subject header's Indices) so I suggest buy same strike price CE and PE and sell it on profit. Better safe idea of earning. Tomorrow market is very interesting for those who already taken PE and CE today.
Take care all of you for today.
Hope for the best for tomorrow.
