Intraday AnalysisOption Chain Analysis: Decoding Open Interest (OI) to find where the "Big Players" are positioned.
FII/DII Data: Understanding institutional activity and its impact on market direction.
Intraday Strategies: Scalping and swing setups using Price Action and key EMAs.
Global Market Cues: How GIFT Nifty and US Markets might influence our opening.
Short-trading
Global Financial MarketsGlobal financial markets are systems where people, companies, and governments buy and sell financial assets across the world. They help move money from those who have extra funds to those who need funds.
Main Types of Global Financial Markets:
Stock Markets – Buying and selling shares of companies (e.g., NYSE, NSE).
Bond Markets – Governments and companies borrow money by issuing bonds.
Foreign Exchange (Forex) Markets – Trading currencies like USD, EUR, INR.
Commodity Markets – Trading gold, o
Trading Road Mapoptions trading and institutional trading are important parts of modern financial markets. Options trading offers flexibility and opportunities for profit, while institutional trading provides liquidity and stability to the market. However, beginners should learn market concepts carefully before entering options trading because losses can occur quickly without proper knowledge and risk management. Education, practice, and disciplined investing are essential for long-term success in trading.
BTCUSD: A Critical Test at ResistanceBitcoin is approaching an important resistance zone, an area where buyers have struggled before and sellers have repeatedly stepped in to defend. This level could become the next major decision point. If price returns to this area, the reaction will show whether buyers still have enough strength to continue the recovery or if sellers are preparing another rejection.
A failure to break through this zone, followed by signs of weakness such as long upper wicks, bearish candles, or fading momentum,
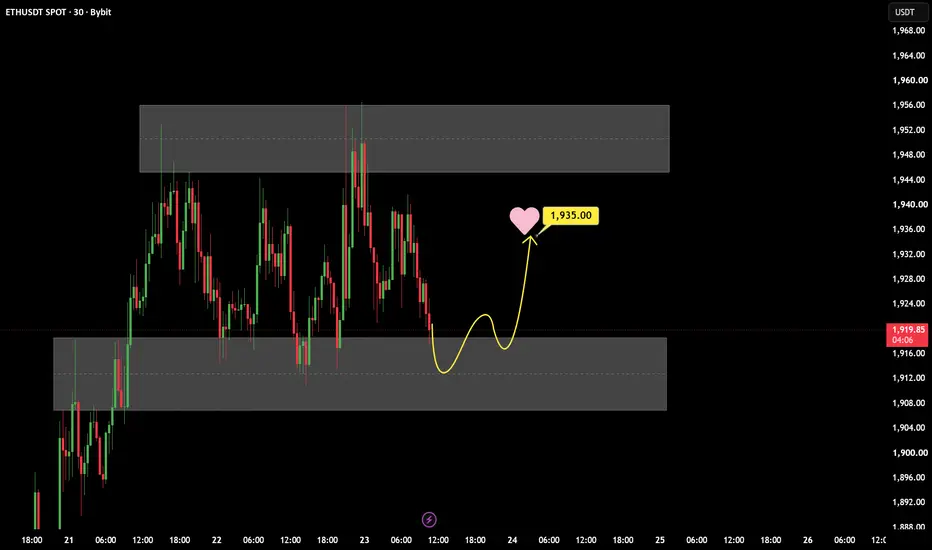
ETHUSDT Near Major Demand – Is a Rebound Coming?ETHUSDT is approaching a well-defined support zone, an area that has repeatedly attracted buyers and produced strong bullish reactions over the past few sessions. This demand zone has consistently prevented deeper declines, making it a critical level to monitor.
If buyers defend this area once again and price begins to print bullish confirmation—such as strong rejection wicks or a bullish reversal candle—the current pullback could turn into another recovery. In that case, ETHUSDT may advance to
BTCUSD: This Pullback Is Testing Buyer CommitmentBTCUSD is no longer in the easy part of the move. After the recent rally, price has returned to the area where buyers previously built the foundation for the advance.
That makes this zone important for one reason: it will show whether demand is still present or whether the bullish move has started to lose support.
A strong reaction from here could bring BTCUSD back toward 66,300. But if price begins accepting levels below the zone, the setup changes and a deeper correction becomes more likely.
BTCUSD: The Breakout Has Happened—Now Comes the Real TestBTCUSD has already cleared the resistance zone, but the move does not need to continue in a straight line. After such a strong push, a pullback toward the broken level would be a normal part of the process.
The key question is whether buyers can turn former resistance into support. If price reacts positively from the highlighted zone, the breakout would look much stronger and the path toward 67,500 would remain open.
For now, the bullish structure is still intact. The next reaction around the
bitcoin major support , major resistanceremember last time price went to $19600 now it roaming at the price of $28k
we passed this signal to hold long from $20k now, again the situation is becoming tricky , you know what to do in these conditions
hold firmly for the support zone once the week candle ends
follow for more
here to help you not to disappoint.
!thanks
Nifty: Bounce back... what next?Nifty,
If you have been following me, I was shouting from the top of my voice to sell when Nifty was above 18000.
Yesterday I had mentioned 2 things
- to watch out for weekly closing - Above 17430-17450 zone, next resistance is around 17604-17620 odd levels
- focus on Risk Management. We were close to lower end of the Red channel
That's what we are seeing right now, Nifty opened at 17451 and made a low of 17427.70 respecting the said zone to perfection and thereafter the Index has rallied n
Divis Lab possibility of going bearish for short term.As you can see Divis Lab is on the way to downside, in minor Wave E forming a Triangle pattern.
As per EWT minutte wave (c) can travel till fibo ratio 1 or 1.2 which are also my target.
But a trader must be cautious if it breaks the invalid level of 3710, if this level breaks above all study/ Analysis will be invalid.
Short Opportunity on EUR/CHFOANDA:EURCHF
We can see a good bearish trend on this pair and I have personally been shorting this pair whenever the price comes to a supply zone. We could get another opportunity to short if the price moves to the green zone as shown above.
A good 1:2.5 RR can be expected if the entry criterias match up!
DLF HEAD & SHOULDER 30MDLF is showing a head & shoulder pattern in 30min timeframe. It could be a good intraday trade in it breaks the neckline of the pattern. You can place your SL above the nearest swing high. Always keep your risk managed. Cut your losses quickly and ride your profits. Happy Trading!
MyAlgo: xRWave-Blaster: Intraday call: 22Jun- BAJAJ_AUTO- ShortBased on my "xRWave-Blaster" predictive trading methodologies, its going to be a RED candle on 22-Jun-2018 for BAJAJ_AUTO
Sell Below(5Min candle close): 2822.9 for targets -
T1: 2801.7
T2: 2789
T3: 2775.8
SL: 2845.5
Note: These calls are based on my own analysis. It may or may not work well for you.So please carefully consider whether it is suitable for you and please do your own research before attempting any. The profit/loss made by you due to this call, is solely your own responsibility.