NearUSDT looks weak.Wait for breakdown.
Follow strict risk management because there can be manipulations
SL above the zone.
Shortsetup


Titan looks good for intraday short tradeTitan has been trading in a range for the past few trading sessions.
RSI and MACD are indicating weakness.
Keep it simple. Two levels are marked. the trade will be activated once it breaks the nearest 30m candles low marked on the chart.
It's always good to wait for confirmation. If it goes as expected and the price breaks the lower line, wait for it to retrace close to the line and fall again.


USDINR 25 Mar Expiry viewHi Folks !
USDINR is now seen in a crucial level near 76
* It has retraced only 38% from recent dip
* Retest done at previous breakdown level which was also a support level earlier
* Price also can be seen moving in a downtrend channel and now is at the upper level, having room to move downwards till the lower level
* Chart pattern : If we look at this retracement as flag, we can also say that it is a flag Breakdown and may also give flag target which is 75
* Indicators : RSI & Stochastic also supporting the Bearish View analyzed with points observed and mentioned above
Contra View : If this takes a support at immediate support level 75.5 and makes a double bottom ( reversal sign )
then wait for Break out of 76 to get a target of 76.657
No trading zone - 76 to 75.5
Strategy recommendation : Bear Call Spread
Plan your Trade ! Trade your Plan !


#StockMarket #StockIdeas #StocktoWatch #StockToSell #ShortsetupCOAL India
Stock at a recent high on the weekly chart will correct before further upside moves.
So Short Call if 177 level breaks with SL of 182-185 levels
Can be look for Intraday with 5min Chart for SL levels
----
Note:
Above levels are for education purposes only
Do your own analysis before taking any trade

BTCUSD: SELL at 37590Sell at 37590 with Stop-loss of 37890 and Target of 34340
For educational purposes only.

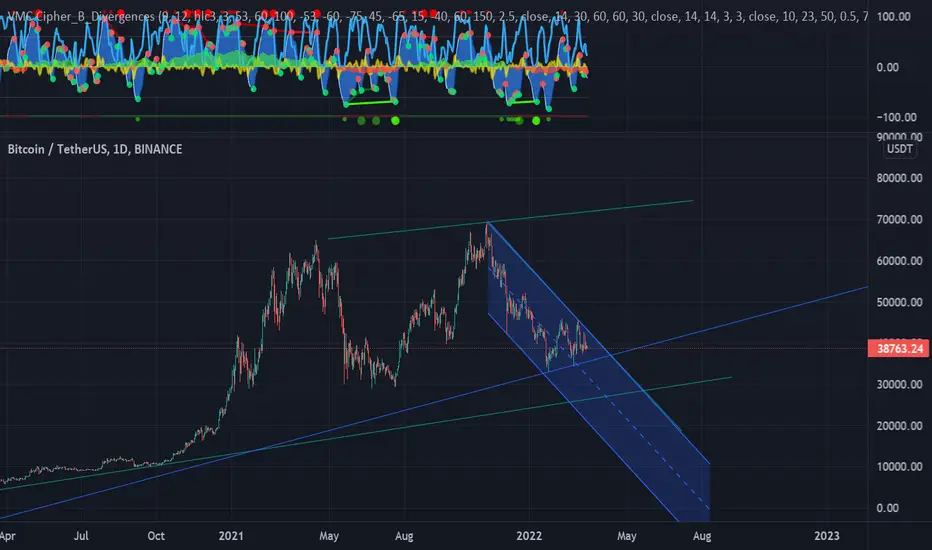
Let's assume the worst but be open-mindedI believe we are headed towards a big dip as institutional investment is focus on commodities right now. Fundamentally and technically this might indicate a dreadful shortfall. I am open minded about pumps because they can come from anywhere but for that I have drawn the tops of this bear cycle. Please research before you make any decision. Thanks
GBPAUD DROPGBPAUD is currently at a very good supply zone. It should drop to next demand area what do you guys think about this.

EURJPY DropEURJPY currently a very good sell zone let's wait & see hoe market react in this analysis .

Bajaj finserv in a range Bajaj finserv looks fantastic short, this stock is within a range and created a distribution phase and running towards panic phase .we can sell bajaj finserv put options ,or can make spreads .

#StockMarket #StockIdeas #StocktoWatch #StockToBuy #ShortsetupCHOLAMANDALAM INV
SELL / Short below 590 levels for targets of 550 / 520 /500
SL would be 650 on a Daily Closing basis.
Note:-
In case of Gap Up or Gap Down; avoid above setup.
Above levels for education purposes only.
Do your own analysis before taking any trade.

Banknifty levels for short if war escalates furtherNSE:BANKNIFTY accoding fib extention if break 34000 lvel we ll see 33500 to 32900 level in coming week..if we further break 32400 level we ll head towards 30700 which is ultimate stop for march end to mid april . we area now below 200 SMA which negative sign...view is negated above monthly R1 level. its for educational purpose n plse consult your FA.

Nifty - Wedge Pattern formation in 1H The last 30 min trading on Nifty50 was incredible, many retail traders went long thinking that bottom is in or price or trend has changed, but this looks like a retest of the ascending wedge pattern on 1H, also the Elliott Wave count shows that the down trend is still pending. During this volatility we can not anticipate what will happen today but following simple price action, and if we just look at it, it looks like the price should fall sharply from tomorrow and next 5 to 7 days will be red.
Will update this post will follow up on Falcon Waves as well.
Target 16200 for the wedge pattern fall, followed by some consolidation, and then price may continue to fall.

NIFTY... MORE SELLING AWAITED?The weekly candle of Nifty closed below 16300 and appears weak now. Elliot correction waves can take Nifty to 14800.
Can go short if Nifty closes below 16200 in the daily chart.

GBPUSD 15 min BearishGBPUSD 15 min breaking the channel , after a correction .
Trade at your own Risk.

ONGC... TIME TO SELL?Elliot trades. The impulse waves had started from April 2021, had reached almost the end of wave 5.
I would wait to invest at this time.
140 to 150 should be a good price to invest in ONGC.
Wave 5 again follows the Elliot 5 wave pattern. I'm expecting the share price to correct to at least 160 this February.

PVR... CORRECTION Elliot wave pattern. Correction waves can take PVR share price to 1515 levels. Expecting about 100 points correction in the next 1 to 2 weeks.

NIFTY Outlook - BearishThe NIFTY has completed the descending triangle pattern (bearish continuation) and it has broken the key support at 16.8K. It is also trading below its 200 Day EMA. By measuring the descending triangle's volatility and projecting it from the breakout level. A target of 15.4K has been set.
The chart pattern would be negated if there's a closing above 17.5K.

Hindalco Trade Opportunity for Next Week (21-Feb onwards)15 Min Time Frame :
1. Hindalco may give some correction from here
2. Look for trade setup in Intraday
Disclaimer :
> This analysis is for educational purpose only.
> Keep an eye on global market as well, trade as per market condition.

#Intraday Short Setup #Stockmarket #Stocktowatch #SYNGENESYNGENE INTERNATION
Recent Breakdown seen on Daily and weekly chart.
550 is good psychological level to short, can enter into trade 30% at CMP also.
Safe level is to Short below 535 ( Intraday setup)
For stop-loss in Intraday use 5 minute chart and see nearest resistance.
for target use 5 min chart and fibonacci / pivots level
Always try to book partially and trail.
Stock may test upto 510-500 levels.
NOTE: For Gap-down or breakdown
If gapdown is more than 1% from breakdown level than avoid completely.
if less than 1% or gives breakdown before 9:20 than wait for
first 5 minute candle and entry below 5 minute candle
and revised SL above candle high.

BTCUSDT is Forming Head And Shoulder BTCUSDT is Forming Head And Shoulder PAttern levels are mention above good short trade With GoodRISK Reward RATIO
