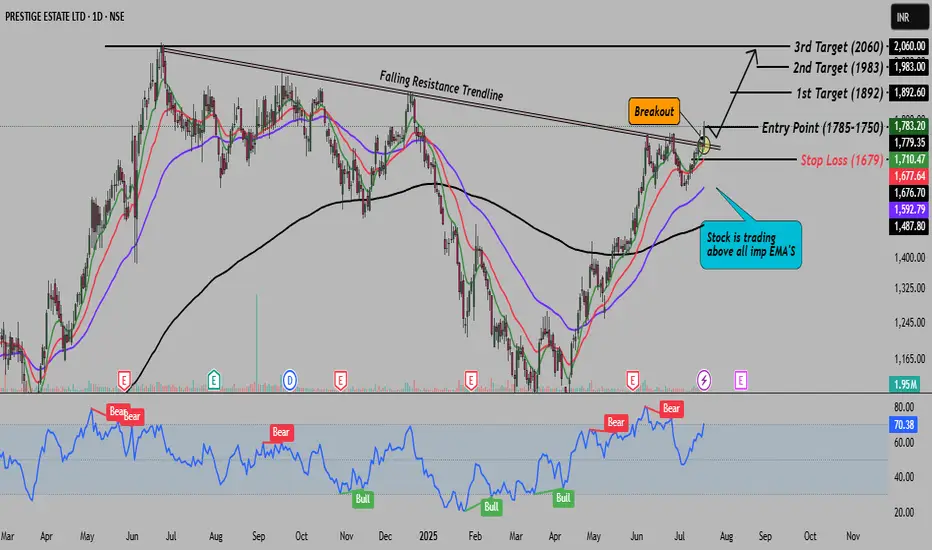
Prestige on breakout, this is ready to fly in blue sky!Hey Traders! Today, I’m sharing a stock that has broken out from a falling resistance trendline. This breakout sets the stage for a potential move towards its all-time high zone. It looks promising for both short-term and long-term trades. In my opinion, this could be a solid trade for the next few days.
Here’s what you need to know:
The stock has broken above a key falling resistance trendline.
This sets up a potential move towards the all-time high zone.
For better risk-reward, I suggest trading with smaller quantities.
Don’t forget to use the stop loss marked on the chart for risk management.
Please trade wisely and according to your own risk tolerance.
Disclaimer: This analysis is for educational purposes only. Always consult a financial advisor before making any investment decisions.
Shorttermtrade
NAVA LTDNAVA - Nava Limited exhibits strong technical indicators with a bullish bias,
If the stock price manages to break through the 500 level, it could potentially reach targets of around 533 and then 565.

ERIS Lifesciences for 25% gainsDate: 3 Dec’24
Symbol: ERIS
Timeframe: Weekly
ERIS Lifesciences currently seems to be in Wave V of 3 which is heading towards 1960-70 (25% from current price of 1470) as seen in the chart. Wave 4 could then correct back to 1300 levels.
The company, in the recently announced September quarter results has posted best ever revenues and operating profits.
This is not a prediction but a possible wave count. This is also not a recommendation to trade or invest. Please do your own analysis.
HINGLISH VERSION
ERIS Lifesciences vartamaan mein Wave 3 ki V mein dikh rahee hai jo 1960-70 (vartamaan keemat 1470 se 25%) kee taraf badh rahee hai jaisa ki chart mein dekh sakte hain. Wave 4 phir 1300 ke star tak neeche aa sakta hai.
Company ne haal hee mein ghoshit September quarter results mein ab tak ka sabse achchha revenue aur operating profit darj kiya hai.
Yah koi prediction nahin balki sambhaavit Wave count hai. Yah trade lene ya invest karne ki bhi salaah nahi hai. Kripya apana vishleshan khud karein.

Epigral Ltd for 30%+ gains; Strong Q2 resultsDate: 10 Nov’24
Symbol: EPIGRAL
Timeframe: Daily
Epigral (formerly known as Meghmani Finechem) seems to be in Wave V of 3 which is heading towards 2800 (33% from current price of 2100) as seen in the chart. There is a possibility of Wave V extending to 3000 which we can assess once it closes above 2500. Let’s keep a stop loss at 1840 on closing basis. Q2FY25 results on Saturday were good so the run up should continue.
This is not a trade recommendation. Please do your own analysis. And I have the right to be wrong.
Epigral (jise pehle Meghmani Finechem ke naam se jaana jaata tha) 3 ke Wave V mein hai aisa lagta hai jo 2800 (2100 kee vartamaan keemat se 33%) ki taraf badh raha hai jaisa ki chart mein dekha gaya hai. Wave V ke 3000 tak badhane ki sambhaavana hai jiska aakalan hum 2500 se upar band hone par kar sakte hain. 1840 ke neeche closing basis stop loss rakhein. Shanivaar ko Q2FY25 ke nateeje achhe rahe to teji jaari rehni chahiye.
Yah koi trade lene ki salah nahin hai. Kripya apana vishleshan khud karein. Aur mujhe galat hone ka adhikaar hai.

Short term trading opportunity in GP ECO for > 20% upsideHi,
NSE:GPECO has given a Bullish Flag Breakout on Daily charts with very good volume.
MACD is also on the bullish side on Weekly time frames. RSI is also on the bullish side on daily, weekly and monthly time frames.
In the current market scenario, I am expecting that the bullish momentum will continue.
Complete price projection like entry, stop loss and targets mentioned on the charts for educational purpose.
Don't Forget to Follow me to get all the updates.
Please share your feedback or any queries on the study.
Disclaimer: Please consult your financial advisor before making any investment decision.

Tata Power for 20% gainsDate: 27 Sept’24
Stock: Tata Power
Timeframe: Daily chart
Tata Power seems to be in Wave V of 5 which is heading towards 580 levels (20% from current price of 485) as seen in the chart. It is then likely to go into a longer consolidation (a larger timeframe Wave 4) which I will analyse in due course. Likely to achieve this target by end of this year? (Yes, I would like to think so).
This is not a trade recommendation. Please do your own due diligence.

Granules India for 35%+ gainsDate: 3 Oct’24
Stock: Granules
Timeframe: Daily chart
Granules India seems to have begun its up move in Wave V of 5 which could end around 810-820 (>35% from current price of 595) as seen in the chart. High volumes and strong reversal of RSI supports this stance.
This is not a trade recommendation. Please do your own analysis.
Aisa lagata hai ki Granules India ne 5 ke Wave V mein apni badhat shuroo kar dee hai, jo 810-820 (595 kee vartamaan keemat se 35%) ke aasapaas samaapt ho sakatee hai, jaisa ki chart mein dekh sakte hain. Achhi volume aur RSI ka majaboot ulataav is rukh ka samarthan karta hai.
Yeh koi vyaapaar ki rai nahin hai. Kripya apna vishleshan khud karein.

medium term trading opportunity in Shardha InfraprojectsHi,
NSE:SHRADHA has given a Bullish Flag Breakout on Weekly charts with very good volume.
MACD is also on the bullish side on Weekly time frames. RSI is also on the bullish side on daily, weekly and monthly time frames.
In the current market scenario, I am expecting that the bullish momentum will continue.
Complete price projection like entry, stop loss and targets mentioned on the charts for educational purpose.
Don't Forget to Follow me to get all the updates.
Please share your feedback or any queries on the study.
Disclaimer: Please consult your financial advisor before making any investment decision.

Short term trading opportunity in Bajaj Finserv for > 15% upsideHi,
NSE:BAJAJFINSV has given a Bullish Flag Breakout on Weekly charts with very good volume.
MACD is also on the bullish side on Weekly time frames. RSI is also on the bullish side on daily, weekly and monthly time frames.
In the current market scenario, I am expecting that the bullish momentum will continue.
Complete price projection like entry, stop loss and targets mentioned on the charts for educational purpose.
Don't Forget to Follow me to get all the updates .
Please share your feedback or any queries on the study.
Disclaimer: Please consult your financial advisor before making any investment decision.

Medium term trading opportunity in ABFRL for > 25% upsideHi,
NSE:ABFRL has given a Bullish Flag Breakout on Weekly charts with very good volume.
MACD is also on the bullish side on Weekly time frames. RSI is also on the bullish side on daily, weekly and monthly time frames.
In the current market scenario, I am expecting that the bullish momentum will continue.
Complete price projection like entry, stop loss and targets mentioned on the charts for educational purpose.
Don't Forget to Follow me to get all the updates.
Please share your feedback or any queries on the study.
Disclaimer: Please consult your financial advisor before making any investment decision.

Short term trading opportunity in Hariom Pipe for > 15% upsideHi,
NSE:HARIOMPIPE has given a Bullish Flag Breakout on Daily charts with very good volume.
MACD is also on the bullish side on Weekly time frames. RSI is also on the bullish side on daily, weekly and monthly time frames.
In the current market scenario, I am expecting that the bullish momentum will continue.
Complete price projection like entry, stop loss and targets mentioned on the charts for educational purpose.
Don't Forget to Follow me to get all the updates.
Please share your feedback or any queries on the study.
Disclaimer: Please consult your financial advisor before making any investment decision.

GR Infraprojects for 30% riseThe stock has likely completed wave iv of larger Wave 1 (that began in March’23) on 29th Aug’24, as seen in the chart. It now should resume its alight as wave v that can take its price to a minimum of 2000+ levels (>30% from current levels of 1530).
Both RSI and volumes seem to be in alignment of this view. After the move and completion of Wave 1, the price may correct back to around 1500 levels.
This is not a trade recommendation. Please do your own due diligence.

Buy Aurobindo Pharma Short Term Trading Advice by Goodluck Capital
Buy Aurobindo Pharma
Buy Range- 1240 - 1260
Target- 1330 - 1350
StopLoss- below 1175
Potential Return- 6-8%
Approx trade duration 9 - 10 days

FAZE3Q | BUY1) FAZE3Q shows strong uptrend potential with good technical and fundamental looks strong
2) Textile sector was underperforming for the past few years, we can expect a demand from this point, this makes the sector looks attractive
3) FII's have started entering into the stock which looks promising
Entry: Can consider current price
Disclaimer: For informational purposes only. Do your research or consult a financial advisor.

DRREDDY is ready for fireIn today's trading session, the price has given a breakout of a falling trendline and flag and pole pattern. The price is trading above 14 EMA. MACD is turning positive.
Keep a close watch.
Disclaimer- I am not a SEBI registered technical analyst and adviser. Kindly trade on your risk.

Buy Colpage Palmolive Short Term Trading Advice by Goodluck Capital
Buy Colpage Palmolive
Buy Range- 3040 - 3070
Target- 3200 - 3250
StopLoss- below 2950
Potential Return- 5-6%
Approx trade duration 14 - 15 days

Buy ITC Short Term Trading Advice by Goodluck Capital
Buy ITC
Buy Range- 457 - 462
Target- 485 - 490
StopLoss- below 450
Potential Return- 6-7%
Approx trade duration 14 - 15 days

Short term trading opportunity in Quess Corp.Hi,
An bullish on-neck Breakout pattern emerged on the Daily chart of NSE:QUESS
MACD on daily, and monthly time frame is on the bullish side and also expecting the bullish setup to continue.
In the current market scenario, I am expecting that the bullish momentum will continue.
Complete price projection like entry, stop loss and targets mentioned on the charts for educational purpose.
Don't Forget to Follow me to get all the updates.
Please share your feedback or any queries on the study.
Disclaimer: Please consult your financial advisor before making any investment decision.

Buy V-Guard Short Term Trading Advice by Goodluck Capital
Buy V-Guard
Buy Range- 404 - 410
Target- 430 - 435
StopLoss- below 390
Potential Return- 6-7%
Approx trade duration 14 - 15 days

AMBER - Unconventional Flat Swing TradeAMBER is trading near ATH zone. Stock has a long term reversal structure in weekly TF. Currently it is at a striking distance to ATH. Above 4615 we may initiate the strongest leg in the coming weeks and months. 4565 will be trigger point after that I will add this from 4520 zone with 4200 as sl.
Both Monthly and weekly candles suggest a good momentum as in both TFs previous red candle's high have been taken out. Stock is suitable for short term, mid term and even long term. 9000-10000 will be its long term target. But since I am a momentum trader I will eat this in legs of 1.618 and 2.618 and 3.618 plotted targets.
==========
I am Not SEBI Registered
This is my personal analysis for my personal trading. Kindly consult your financial advisor before taking any actions based on this.

Buy Cummins India Short Term Trading Advice by Goodluck Capital
Buy Cummins India
Buy Range- 3930 - 4000
Target- 4250 - 4300
StopLoss- below 3720
Potential Return- 7-8%
Approx trade duration 12 - 14 days

"Skyrocketing Success: The Rise of Shreecement"?Wait for the daily candle to close and retest.
A beautiful head and shoulder pattern with and increase in volume.
Plan of action -
Entry after retest - 26890-27000
Target 1- 28100
Target 2- 29000.
Disclaimer - education purpose.

Buy JBM Auto Short Term Trading Advice by Goodluck Capital
Buy JBM Auto
Buy Range- 2020 - 2080
Target- 2250 - 2300
StopLoss- below 1900
Potential Return- 10-12%
Approx trade duration 14 - 15 days
