#Silver | #XAGUSD 4H UpdateCMP: $50.44
🔴 Price testing key resistance zones
🚧 $50.47 - $50.94
⚠️ Strong supply area — consider booking profits or tightening stops on longs.
👀 Only a clean 4H close above $50.94 can open the way for further upside.
#Silver TVC:SILVER #XAUUSD #PriceAction #Commodities #Trading #Forex #ChartPattern
📌 #Disclaimer: This analysis is shared for educational purposes only. It is not a buy/sell recommendation. Please do your own research before making any trading decisions.
Silver

Silver Triangle BreakoutSilver is attempting breakout forming a ascending triangle pattern on 1h and 4h timeframe. It is also trading above 200ema.

(Silver / USD, 4H timeframe)...(Silver / USD, 4H timeframe):
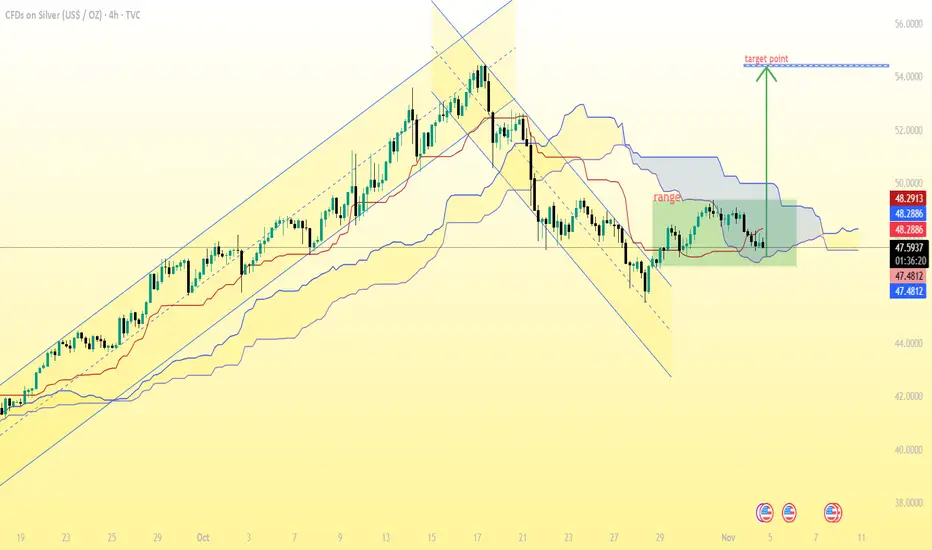
✅ Analysis Summary:
The price has broken out of a falling channel and is now moving inside a range, just below the Ichimoku cloud.
The projected move (marked on my chart) shows a bullish breakout from the range.
The measured move target from the breakout zone points upward to the $52.15–$52.50 area.
📈 Target Levels:
Immediate resistance: $48.30 – $48.70
Breakout confirmation: Above $49.00
Main bullish target: $52.10 – $52.50
Extended target (if strong momentum): $53.80 – $54.00
📉 Support levels:
$47.50 (near cloud base)
$47.00 (range bottom)
➡ Conclusion:
If Silver sustains above $49.00, the next target is $52.15 – $52.50 as shown in my chart.
If it fails to hold above $47.50, the bullish setup becomes invalid.
L
#Silver | Falling Wedge + Inverse H&S = Bullish Cocktail#XAGUSD | 4H Chart
Head & Shoulders completed its breakdown target ✅
Price found support at the demand zone, formed a falling wedge breakout, and built an Inverse H&S.
Now consolidating right below the neckline, watching Immediate Resistance @48.464 👀
Above this, potential retest of key resistance zone 49.459 – 50.475/50.897 (previous H&S breakdown area).
Bias: Bullish above 48.464; confirmation on 4H close 🔥
#Silver #XAGUSD #HeadnShoulders #FallingWedge #InverseHeadnShoulders #PriceAction
📌 Disclaimer: This analysis is shared for educational purposes only. It is not a buy/sell recommendation. Please do your own research before making any trading decisions.

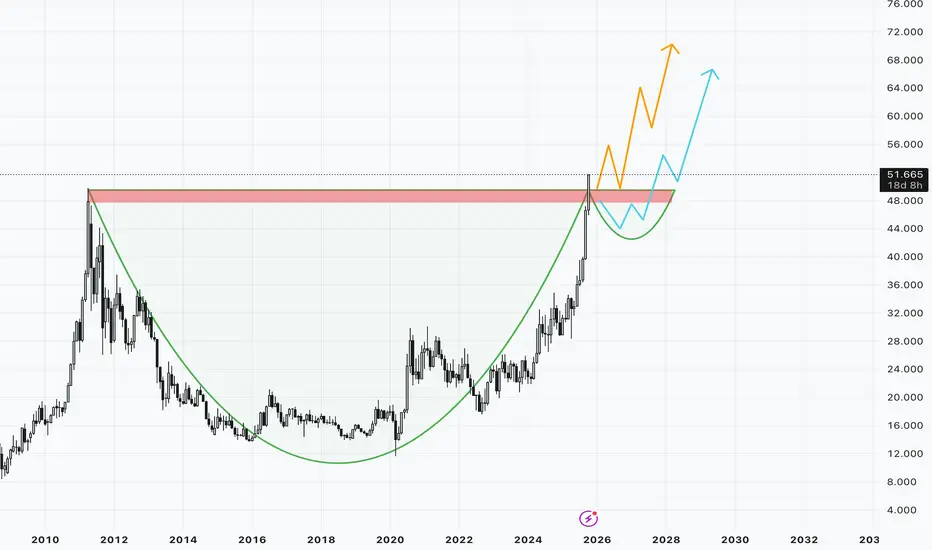
Silver breakout above ATH. What to expect next?Chart Analysis:
Silver gave a breakout above its all time high and major psychological level of 50$. All the technicals are very strong in the short run.
Looking at the monthly chart it looks like C recovery and breakout above major resistance without the H formation making the C&H pattern incomplete.
13 trading days still left for the monthly close and for the breakout to become valid if closes above 50$.
What next? :
Curently looks like a clean breakout on charts. Wait for the monthly close above 50$ which will then make the breakout valid. If the breakout is valid we will wait for a retest near the zone for fresh longs. If it doesn't close the the C&H pattern can come into play. Expecting some cooldown in the prices in the coming weeks but closing is most imp. Wait and watch is current scenario.
Key Levels :
Major Support : 50$/46$ Clbs
Minor Support zones : 48.5-48.6$/47.5-47.6$
Long Run View :
Buy on dips is the best strategy to play out in Silver making entries on crucial levels. Expecting Silver to outperform Gold in the long run.
Disclaimer :
I am not SEBI registered. This analysis is for educational purposes only and not investment advice. Please do your own research before trading or investing.
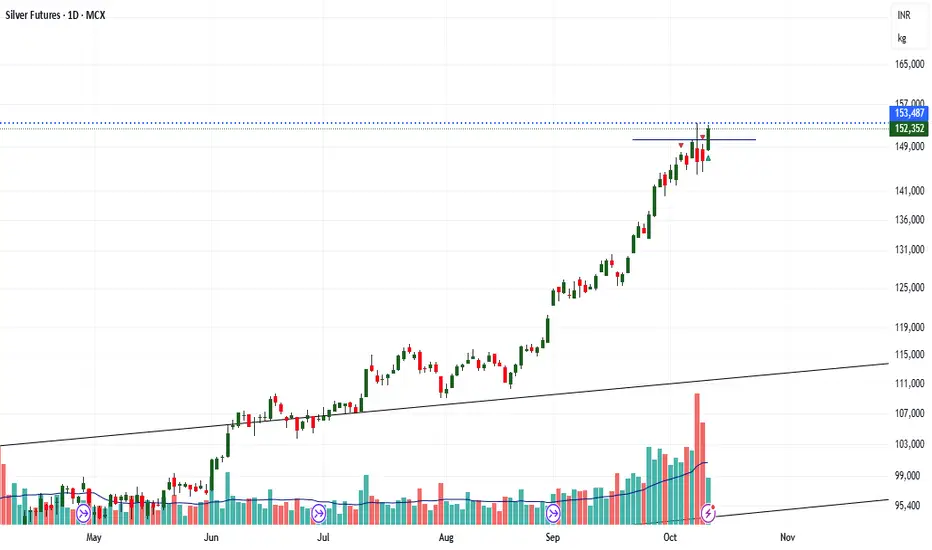
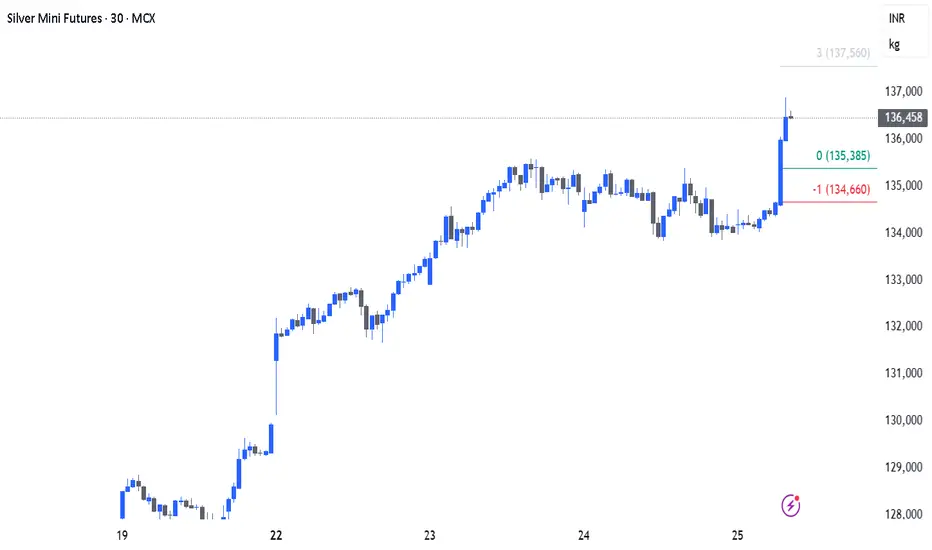
Silver Futures (MCX) 4-hour chart Silver Futures (MCX) 4-hour chart, and my marked a resistance zone and a downward breakout below the Ichimoku cloud and key support.
Here’s what I can interpret:
Price broke below the Ichimoku cloud, confirming a bearish trend.
There’s a clear resistance area around ₹151,000–₹153,000.
The breakdown happened below the ₹145,000–₹146,000 level.
My marked a target zone below, with a downward arrow.
✅ Likely Target Projection
Using standard technical projection (height of range = target distance):
Resistance zone top: ~₹153,000
Breakdown zone: ~₹145,000
Height: ₹8,000
If we subtract that from the breakdown area:
Target = 145,000 – 8,000 = ₹137,000
🎯 Estimated Short-term Target:
₹137,000 – ₹138,000
This aligns with my chart’s “target point” mark.
If you want to be more precise, you could:
Watch for support around ₹140,000, which might give a bounce.
If that breaks, next major support zone = ₹136,000–₹137,000.

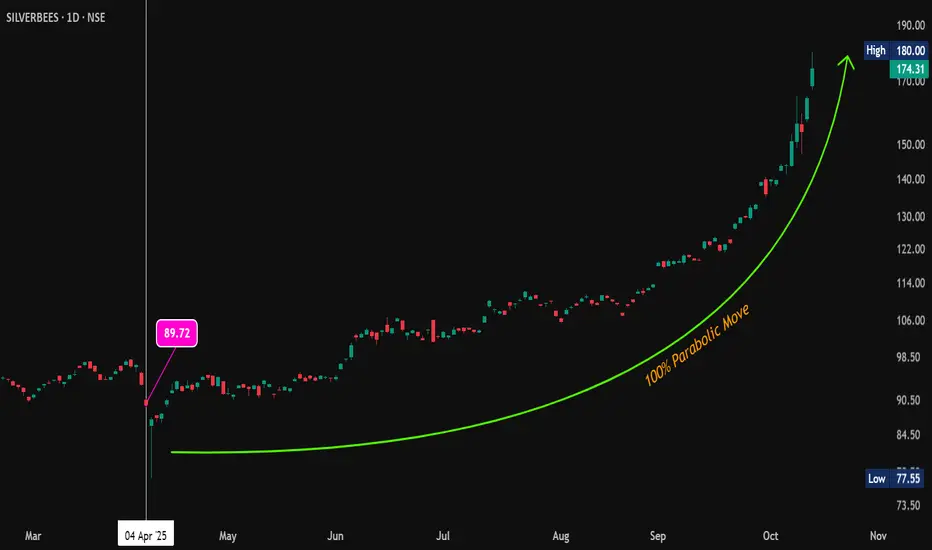
#SilverBees Doubled – Parabolic Move! #SilverBees
🚀 #SIP Strategy Delivers 💯%+ Returns 🥈🔥
On April 4, 2025 , suggested starting SIP in SilverBees at 89.72.
📉 The very next trading day , it dipped to 77.55 , a quick test of conviction.
📈 Since then, it’s been a parabolic rally to 180, with no looking back!
✅ Patience paid off
✅ SIP in commodities works, just like in stocks ( if started at the right time )
✅ Real assets like silver can be powerful wealth creators
⚠️ Going forward, be prepared for volatility.
After such a sharp move , price swings and corrections are normal. Stay disciplined and focus on your strategy.
🥈 Silver continues to shine. Are you riding the trend?
#SilverBees | #SilverETF | #Silver | #SIP | #ETF | #CommodityInvesting | #SmartInvesting
Silver Up 4% | Less Volume Silver rose by 4% today but the volume didn't seem to participate. Till 3:30 PM, silver future volume quoted below it's average volume. If it doesn't open in gap-up tomorrow with volume support, then a reversal won't be that surprising.
Silver swing breakoutSilver has broken out of the 1,50,000 hurdle and might head towards 1.5850 - 1.5950 in this week.
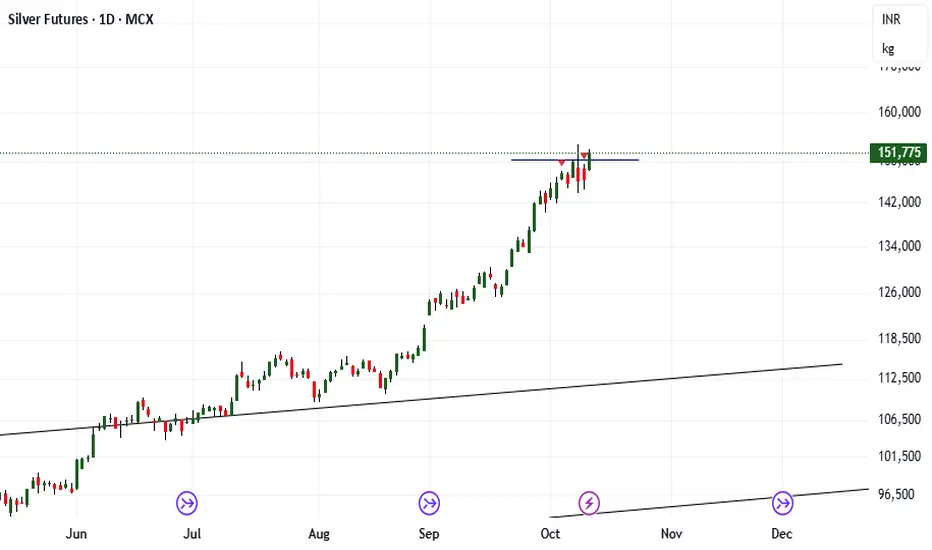
Silver Reversed from 1,50,000Silver reversed from the psychological hurdle of 1,50,000 level as expected and posted on 6th Oct,2025.

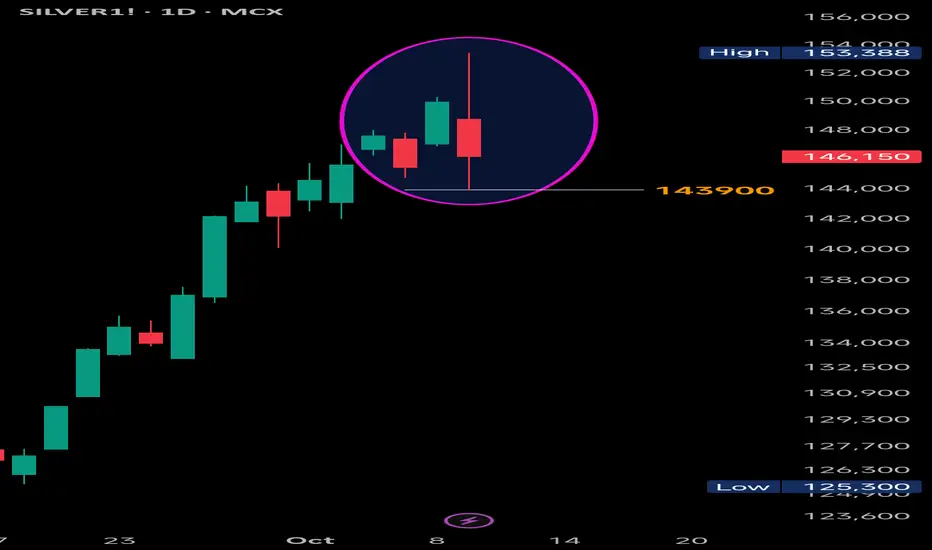
Silver: Bearish Engulfing – Is the Top In?#Silver View:
Just like Gold, Silver has formed a strong Bearish Engulfing pattern on the daily chart, potentially signaling a temporary top in the current trend. While it’s still early to confirm a full reversal, the price action suggests caution for bulls.
✅ Confirmation:
A daily close below 143,900
(today's low), especially with increased volume, would confirm the pattern and likely trigger further downside momentum.
❌ Negation:
If Silver manages to close above 153,388 (today’s high), the bearish structure will be invalidated.
🎯 Key Levels to Watch:
Resistance: 153,388 (pattern high)
Support: 143,900 (pattern low)
Stay alert for follow-through candles and volume spikes in coming sessions.
#Silver | #XAGUSD | #BearishEngulfing | #CandlestickPatterns | #TechnicalAnalysis | #PriceAction | #SilverAnalysis
📌 Disclaimer: This analysis is shared for educational purposes only. It is not a buy/sell recommendation. Please do your own research before making any trading decisions.
Silver Levels For October 2025Important support and Resistance Levels For Silver.
When Market touches the level, the price action plays important roles.
For More Learning Reach out to us.
Silver at a major resistanceSilver has reached a major resistance level. A breakout above this will see more rally. It will be very interesting to see what happens from here. Big Macro development if a breakout happens. The metal will continue to shine if it breaks out, otherwise it is a top and correction will follow.

silver soon topssilver could top soon , it had made the top and fallen , so could the history repeat ? we could see gold and silver prices falling soon because nothing could go so up forever

Double Top in SilverEntry- 143000-143200
Target- 142000, 141500, 141200
SL- Day high
Pattern - Double Top has been made in MCX silver and Comex silver in 1 hr and 15 min time frame.
Disclaimer- This is just for educational purpose.
Jai Shree Ram.

Silver Bullish Breakout on Monthly & Weekly CharPattern Formed: Symmetrical Triangle (Long-Term Consolidation)
Breakout Type: Bullish Breakout on Monthly & Weekly Chart
Volume Confirmation: Strength in breakout with price expansion
Measured Move Target: ~$44 (based on triangle height projection)
Immediate Resistance Zone: $44.11 (Historical supply zone)
Support Levels Post-Breakout:
Immediate Support: $34.78
Strong Support: $33.28

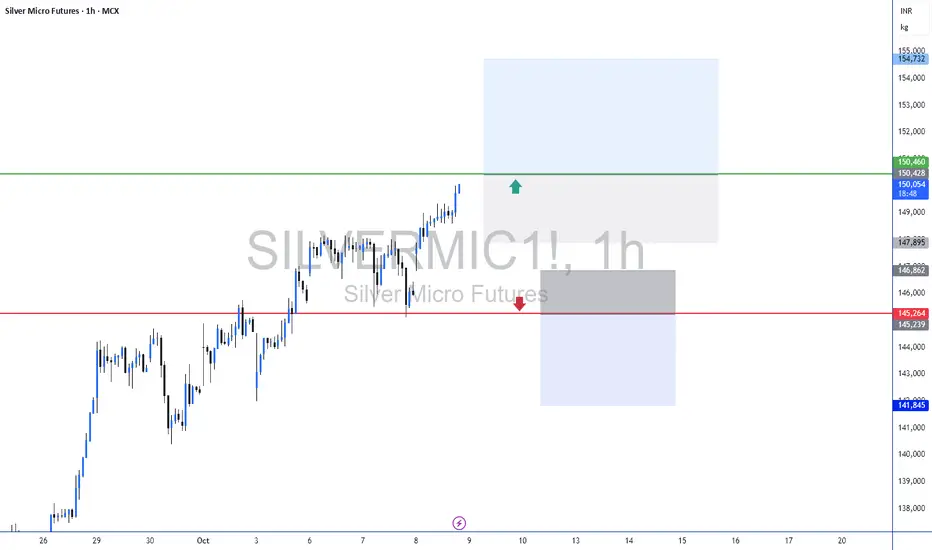
Silver Re Entry After booking partial profits at 12R, I am re-entering the MCX:SILVERM1! trade with a fresh position. The setup continues to align with my trend-following and risk parameters, and the market structure supports further upside potential.
Partial exit: 12R booked ✅
New entry: Initiated as per strategy rules
Risk management: Strict stop in place, position sizing aligned with capital
Targets: Following original R-multiple framework
Staying disciplined and letting the trade run with the trend.
Silver - Trade PlanCritical levels marked for a potential long setup.
Keep an eye on these zones for a possible entry.
Trade safe, manage risk.

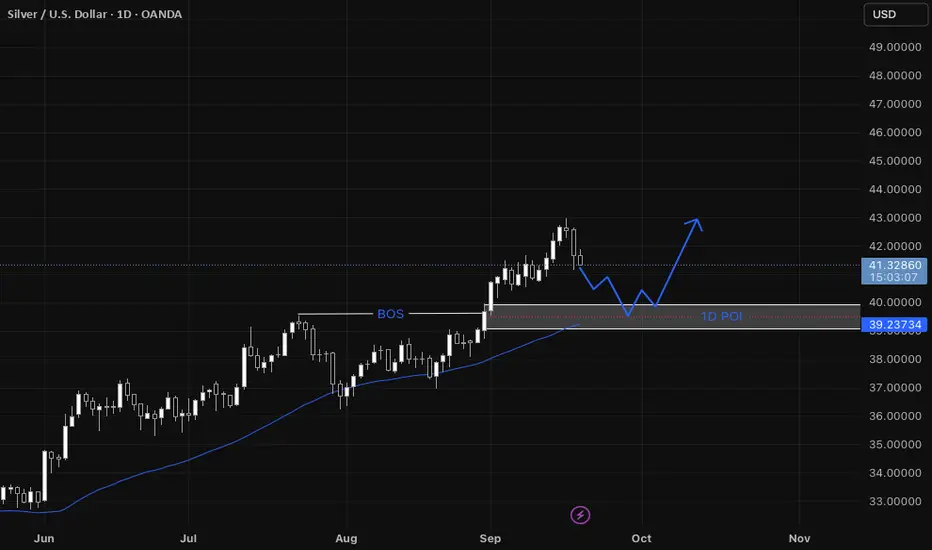
XAGUSD Step-by-step entry plan for XAGUSD
1. We have our Daily Point of Interest (POI)
- On the daily a zone that contains:
* a fair value gap (FVG),
* a break of structure (BOS) that previously acted as resistance and is now expected to act as support, and
* support from the 44 SMA.
2. Wait for price to return to the Daily POI
- Only consider the setup if price actually comes back into that daily POI zone.
3. Switch to the 1-hour timeframe to refine the entry
- Look for a shift in structure on the 1-hour (i.e., evidence that momentum is shifting bullish: BOS to the upside, higher highs/higher lows).
4. Confirm a 1-hour fair value gap forms
- The structure shift on 1-hour should create a 1-hour FVG (a short intraday imbalance).
5. Wait for the 1-hour FVG to be filled
- Let price fill that 1-hour FVG (price moves into/through the gap).
6. Look for a bullish confirmation on the filled 1-hour FVG
- After the fill, require a clear bullish formation on 1-hour (examples: bullish engulfing candle, strong demand candle, a higher-low + rejection wick).
7. Enter on the 1-hour bullish confirmation
- Enter when price breaks the confirmation level (e.g., breaks above the local 1-hour high formed by the bullish setup) or on a confirmed bullish candle close per your entry rules.
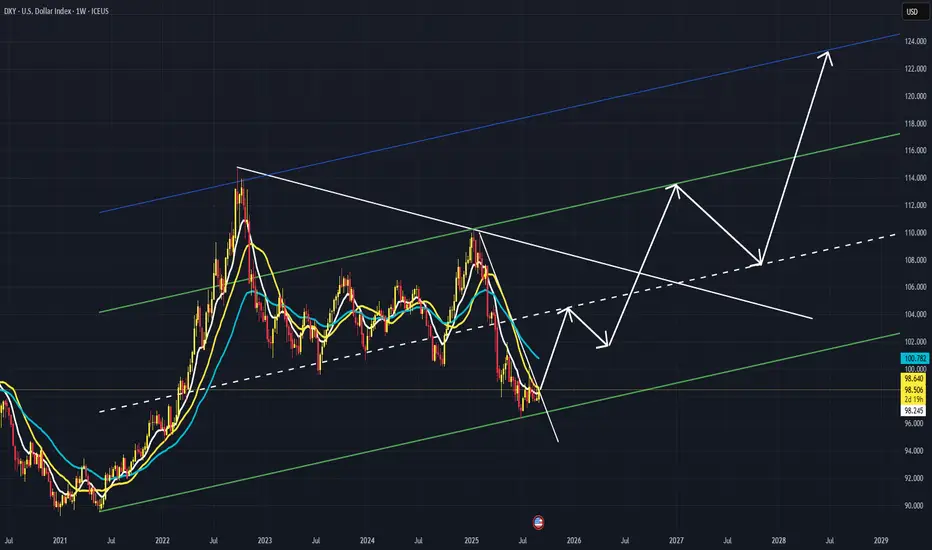
Can DXY make it to 125?Interesting thought as geopolitical forces gather and discuss the fate of USA ... Can DXY make it to 125 in a 5 wave rise in next 3 years or so?
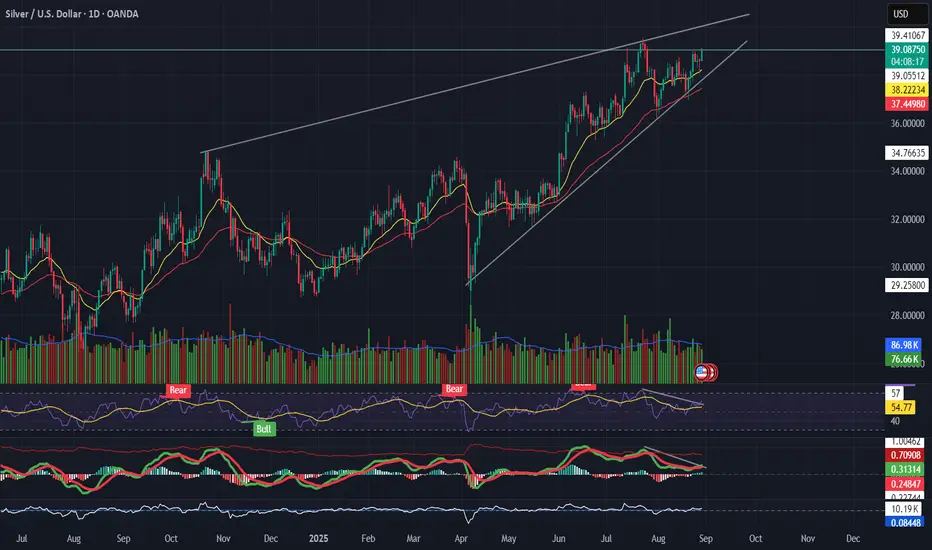
Silver (XAGUSD) Trading in a rising wedge Pattern📌 Silver (XAGUSD)
Trading in a rising wedge, pressing resistance near $39.
RSI divergence → price making higher highs, momentum not following.
MACD rolling over while price climbs = possible bearish divergence.
Support to watch: $37.3 → wedge breakdown if breached.
👉 Bullish only if $39.5 breaks with strong volume; otherwise, risk of pullback.
---
🎯 Takeaway
Silver = extended wedge → caution, momentum weak.
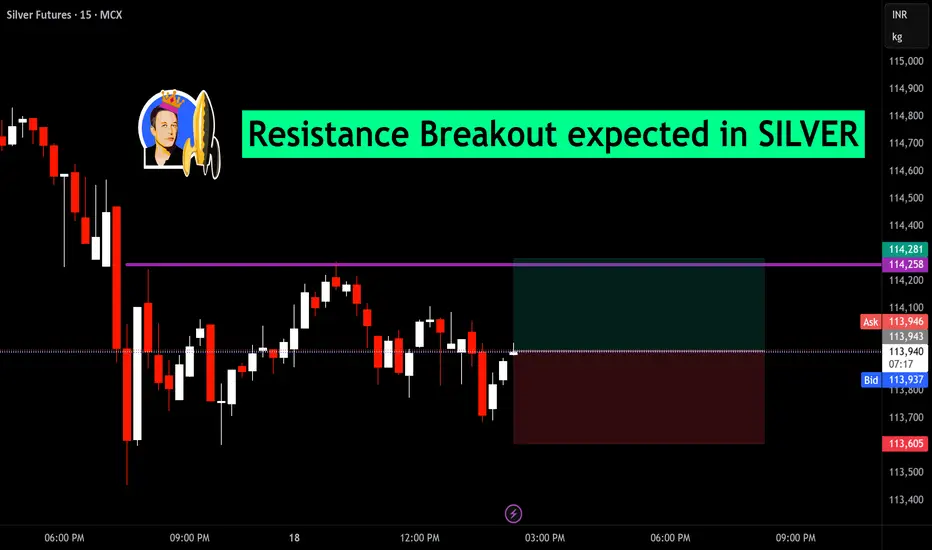
Resistance Breakout expected in SILVERilver Futures (MCX) are approaching a key resistance zone at ₹114,258. Price action shows multiple tests of this level, suggesting strong buying interest and a potential breakout. If this resistance is cleared, bullish momentum may accelerate, offering an attractive long opportunity for traders. Risk management is crucial; consider placing stops below recent support to protect capital. Monitor for confirmation through sustained price action above the resistance and increased volume. This set-up highlights evolving strength in silver and could pave the way for a further move higher. This analysis is for educational purposes and not investment advice.
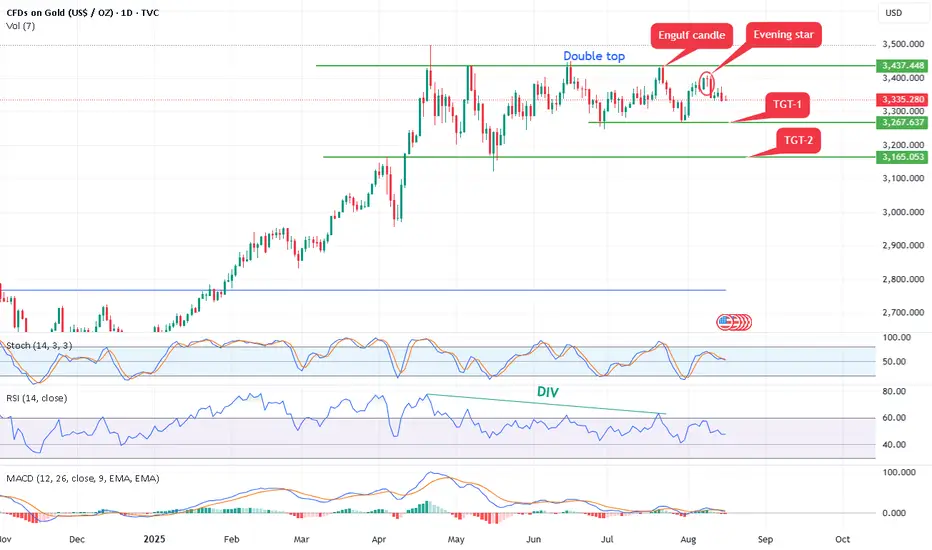
Gold form double top bearish pattern,Bearish Patterns Annotated:
Double Top: A classic bearish reversal pattern resembling an "M" shape. It occurs when price hits resistance twice at similar levels (here, approximately $3,437 and $3,448 in July and August) and fails to break higher. This signals potential exhaustion of buyers and a shift to sellers.
Evening Star: A three-candle bearish reversal pattern marked near the recent high. It typically consists of a large green candle (up day), followed by a small-bodied candle (indecision), and then a large red candle closing below the midpoint of the first candle. This suggests bulls are losing control.
Engulf Candle (Bearish Engulfing): A red candle that completely "engulfs" the body of the prior green candle, indicating strong selling pressure overriding previous buying. It's marked near the top, reinforcing the reversal theme.
Opportunity: - As per chart it can short 3380-3350 with stop loss 3400 above for the targets of double bottom pattern 3260 and 3160.