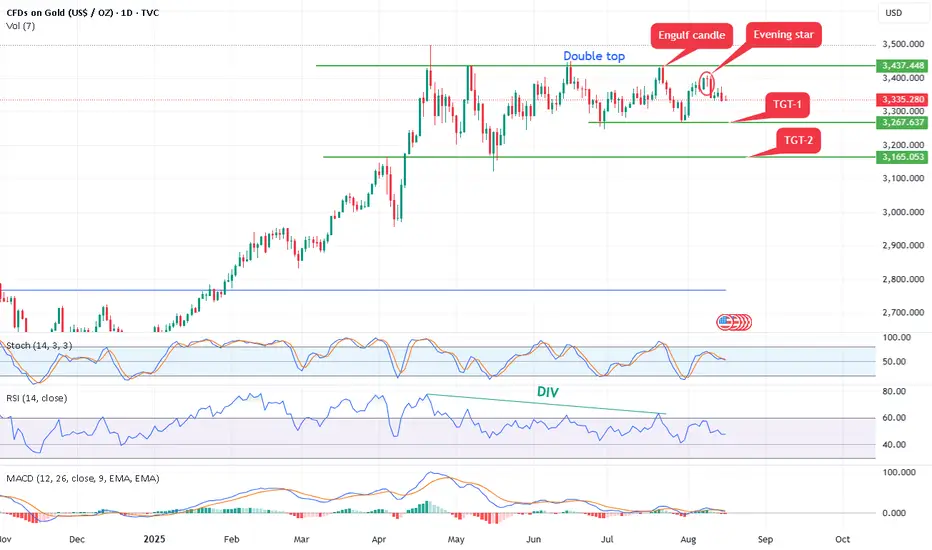
Gold form double top bearish pattern,Bearish Patterns Annotated:
Double Top: A classic bearish reversal pattern resembling an "M" shape. It occurs when price hits resistance twice at similar levels (here, approximately $3,437 and $3,448 in July and August) and fails to break higher. This signals potential exhaustion of buyers and a shift to sellers.
Evening Star: A three-candle bearish reversal pattern marked near the recent high. It typically consists of a large green candle (up day), followed by a small-bodied candle (indecision), and then a large red candle closing below the midpoint of the first candle. This suggests bulls are losing control.
Engulf Candle (Bearish Engulfing): A red candle that completely "engulfs" the body of the prior green candle, indicating strong selling pressure overriding previous buying. It's marked near the top, reinforcing the reversal theme.
Opportunity: - As per chart it can short 3380-3350 with stop loss 3400 above for the targets of double bottom pattern 3260 and 3160.
Silver
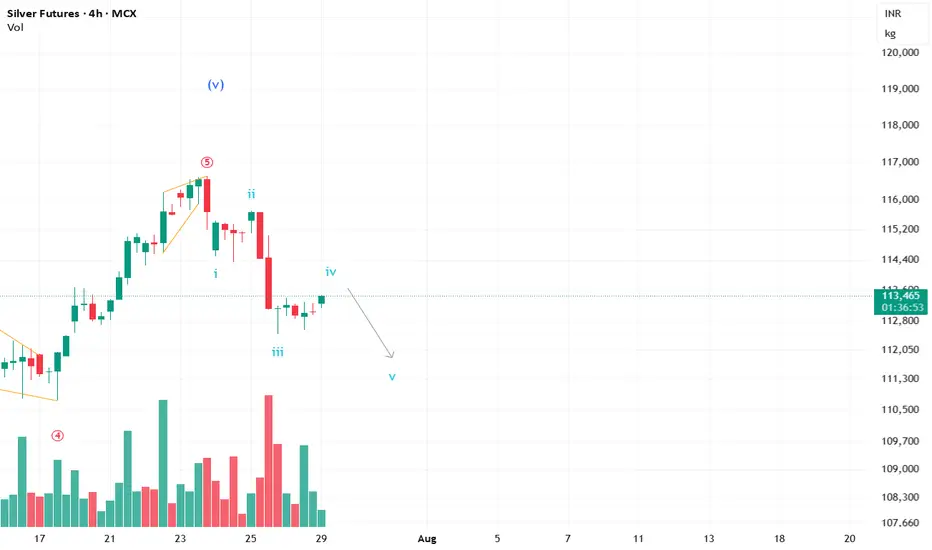
#Silver up for another short sell move?Silver is currently completing the 4th wave and may witness a down move in the short term. Keeping my eyes glued. :)
**This is an educational market outlook, not investment advice. Please consult a SEBI-registered advisor before taking any investment decisions.**
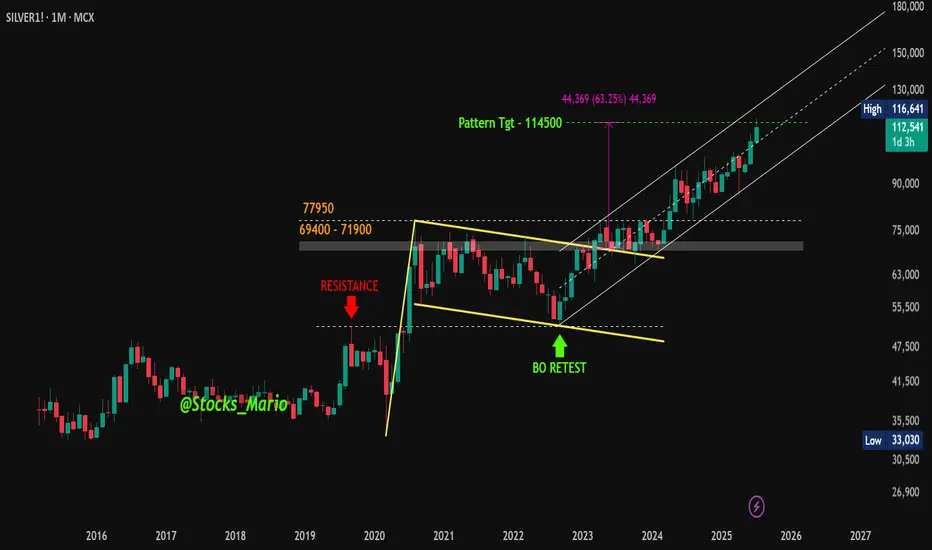
MCX Silver Powers Through Pattern Targets – Momentum Continues#Update | #MCXSilver
On Dec 27, 2022 , we identified a bullish flag pattern when Silver was trading around 69,845 . A follow-up update was shared on Apr 4, 2025 , with prices near 87,878 .
Since then, MCX Silver moved up and touched a high of 1,16,641 on Jul 14, 2025 , meeting the projected zone of the earlier chart pattern — a move of 67% from the initial post and +32% from the April update.
At present, Silver is trading within an ascending channel on the long-term charts — a structure often associated with a sustained trend.
Stay tuned — this could just be the beginning!
⚠️ This is a technical observation shared for educational purposes only. Not a buy/sell recommendation. Please consult your financial advisor before making any trading decisions.
#Silver | #MCX | #TechnicalAnalysis | #PriceAction | #Commodities | #TrendAnalysis | #ChartPatterns
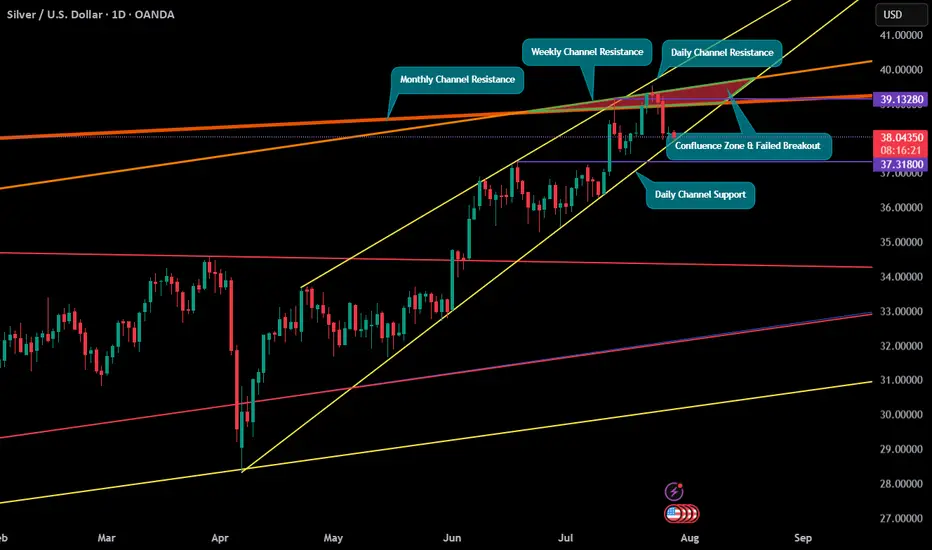
Silver at Multiple Confluence ResistanceSilver came up to a confluence of three Channel Resistances on all major timeframes i.e. Monthly, Weekly & Daily. Near term support currently is only the Daily Channel Support line & the last breakout attempt on D1 has failed to a certain extent. Should big volatility be expected? A break of such strong resistance may signal strong bullish momentum but can the support hold under such conditions.
Is the move over for Silver? #CommodityIt looks like the impulse for Silver is about to end. However, we still need the price action to confirm the view.
**This analysis is based on the Elliott Wave Principle.
This analysis is for educational purposes only and not investment advice.
Please consult your SEBI-registered advisor before making any investment decisions. Markets are subject to risk.**

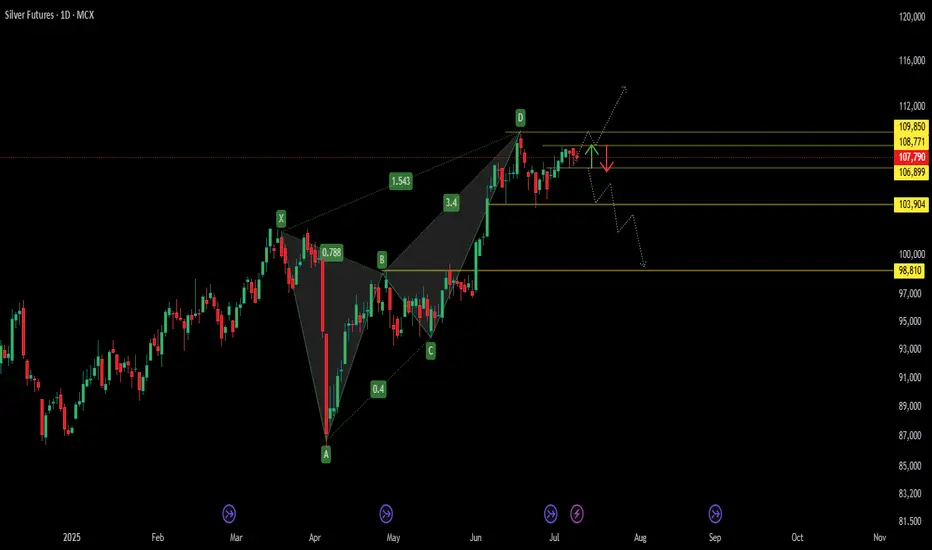
Bearish Harmonic in Play – Silver Sell Zone TriggeredBearish Harmonic in Play – MCX:SILVER1! Sell Zone Triggered 🔔
The pattern marked from X → A → B → C → D forms a Bearish Harmonic Structure , most likely a Bearish Butterfly , confirmed by key Fibonacci ratios:
* XA to AB retracement: 78.8%
* BC to CD extension: 1.543
This setup signals the formation of a Potential Reversal Zone (PRZ) near point D , where a bearish trend may initiate.
📉 Bearish Price Outlook
The dotted projection lines and red arrow illustrate the anticipated downward move:
* Price is likely to face resistance and reverse from the PRZ between ₹108,771 and ₹109,850
* A break below ₹106,899 could trigger further decline toward key support levels at ₹103,904 and ₹98,810
SilverSilver ( OANDA:XAGUSD ) – Bearish Head & Shoulders Forming on 4H Chart
Silver is currently trading at $35.95/oz and forming a Head and Shoulders pattern on the 4-hour chart — a classic bearish reversal setup. The right shoulder is still in formation, with the neckline support around $35.26.
🔍 Key Levels to Watch:
Neckline: $35.26
Breakdown Target: $33.24
Pattern Type: Bearish Head & Shoulders
⚠️ A decisive break below the neckline could trigger a short-term correction toward $33.24. Until then, price action near the neckline should be watched closely for confirmation.
📉 Short bias on breakdown. Wait for confirmation before entry.

Silver at Strong Support Level: Ideal Buy with Targets up to 12Silver has a level that is a strong potential support. Personally, I have been waiting for a retest of this level (87580) for quite some time. It is advisable to buy at this level.
From here, potential targets appear to be 96400, 100900, 102700, 106500, 120000, and 125000.

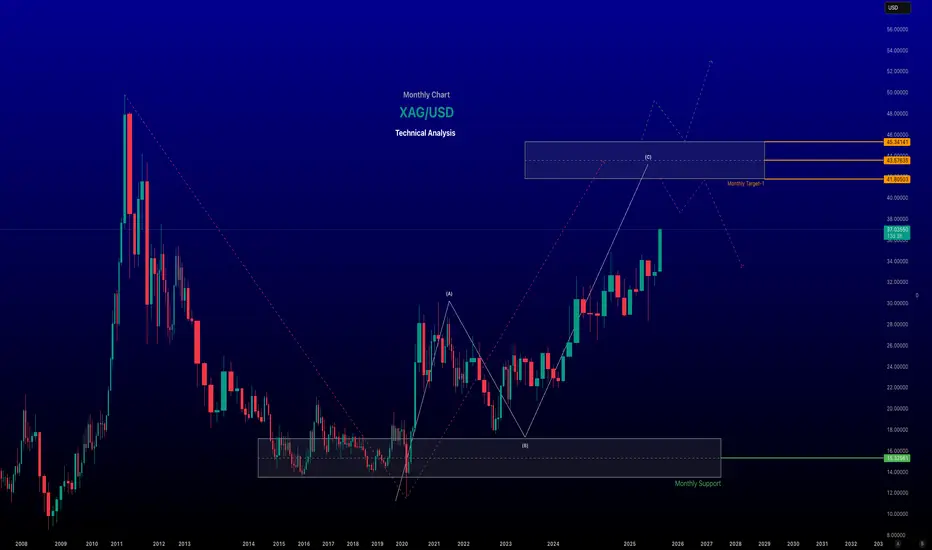
XAG/USD (Silver Spot vs. US Dollar) Analysis - Monthly Chart ~~ XAG/USD (Silver Spot vs. US Dollar) Analysis ~~
#Current Price and Recent Performance
As of June 18, 2025, the XAG/USD spot price is approximately $37.00 per troy ounce at the time of posting, reflecting a 13-year high. Silver has surged nearly 30% year-to-date in 2025, driven by heightened safe-haven demand amid geopolitical tensions, particularly in the Middle East, and global economic uncertainties. Over the past month, silver prices have risen by 12.43%, and year-over-year, they are up 23.33%.
-- Key Drivers of Recent Trends
Geopolitical Tensions: Escalating conflicts, such as Israel’s military actions in Iran, have boosted demand for safe-haven assets like silver and gold. This has been a significant catalyst for silver’s rally, with prices climbing in tandem with gold.
US Dollar Weakness: A softer US dollar, influenced by expectations of Federal Reserve rate cuts and softer inflation data, has supported higher silver prices. Since silver is priced in USD, a weaker dollar makes it more affordable for foreign investors, increasing demand.
Industrial Demand: Silver’s dual role as a precious and industrial metal (used in electronics, solar panels, and medical devices) accounts for ~56% of its demand. Growing industrial applications, particularly in green technologies, continue to support price growth.
Supply Constraints: A persistent supply deficit of 150–200 million ounces annually (10–20% of total supply) and declining above-ground inventories by nearly 500 million ounces in recent years have tightened the market, pushing prices higher.
Speculative Activity: Futures and spot market trading on exchanges like COMEX and the London Bullion Market, coupled with speculative interest, contribute to price volatility. The market is also influenced by “paper silver” (futures, ETFs), which some argue suppresses physical silver prices.
~~Technical Analysis~~
Current Levels and Trends: Silver is trading above the key support zone of $34.90–$35.15, maintaining a bullish outlook. Recent suggest a strong bullish trend, with a breakout above a downward trend line and minor resistance on the 4-hour chart.
Support and Resistance:
Support: Key levels include $34.99, $33.70, $32.67, and the 0.618 Fibonacci retracement at ~$35.00.
Resistance: Immediate resistance lies at $37.85, with further targets at $38.00 and potentially $40.34–$44.21 in the coming weeks or months.
-- Disclaimer --
This analysis is based on recent technical data and market sentiment from web sources. It is for informational purposes only and not financial advice. Trading involves high risks, and past performance does not guarantee future results. Always conduct your own research or consult a SEBI-registered advisor before trading.
#Boost and comment will be highly appreciated
Analysis on Silver : XAGUSDSilver run halts at immediate resistance $36.12698
On breakout, upside targets are T1, T2 and T3 as mentioned respectively.
If price rejects this and falls below the Immediate support, then the 2024 year's high level will be a strong support to invalidate bullish sentiment.
Below S2, it will still be a weak bullish zone instead of a reversal or bearish knock.
IMO, a pullback is quite possible before hitting the upper targets. A valid close is important above the immediate resistance level.
There is a slight negative divergence in RSI to support the pullback.

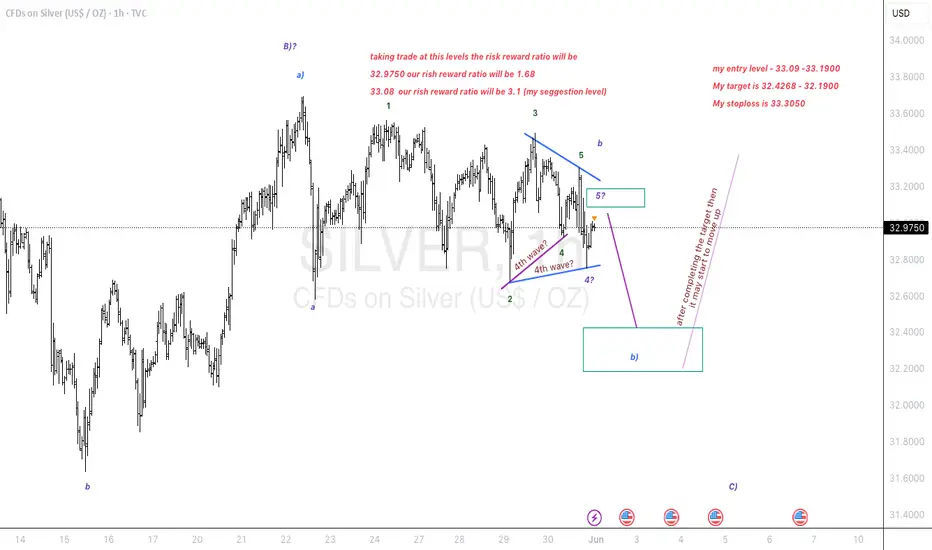
Triangle breakout in silver. Down to earth..
Elliott Wave Analysis:-
1st possibility:- (look Previous chart published)
Silver is in a triangle breakout. if it is getting towards upside breakout then we have a nice opportunity of pullback and and we can add it if the pullback occurs. else we can enjoy this journey quietly.
2nd possibility:-
Silver had already made a pullback towards down side breakout. Once it start the way it will fly towards downside and then it will complete a C wave in whole B wave then upside C wave will be impulsive.
My Entry, Stop, Target all have been discussed.
My suggestion to take a trade at this place to reduce the risk better reward.
I just spoke what chart whisper's in my ear.
I am not a SEBI registered advisor. Before taking a trade do your own analysis or consult a financial advisor. I share chart for education purpose only. I share my trade setup.
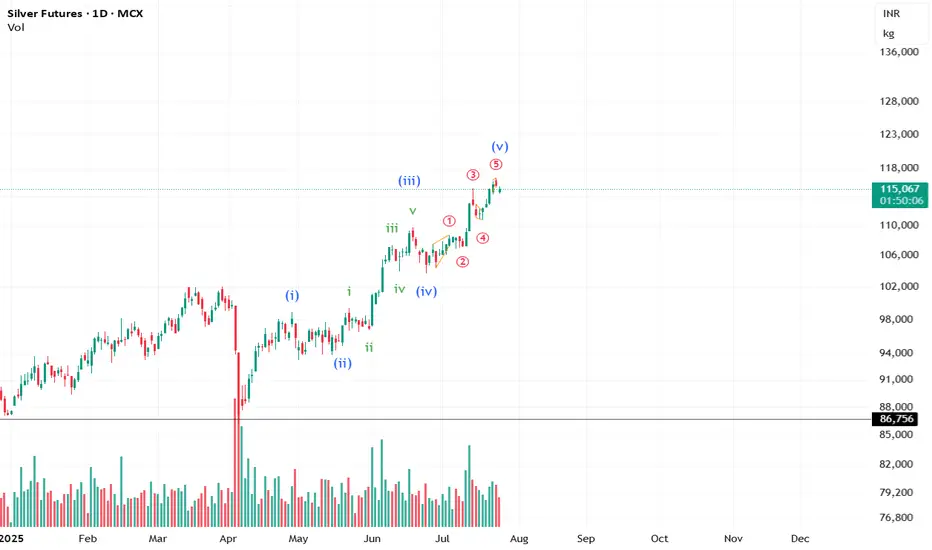
Silver MCX - Elliot Wave Counts - Long TradeSilver lagged Gold in the entire run up through the year
However, in last week Silver held quite well, while Gold has been correcting.
It seems like weekly Wave 4 is done and 1,2 of Wave 5 are done.
Wave 3 - targets 1.1L, 1.15L. Wave 5 targets + 1.2L
All the best!

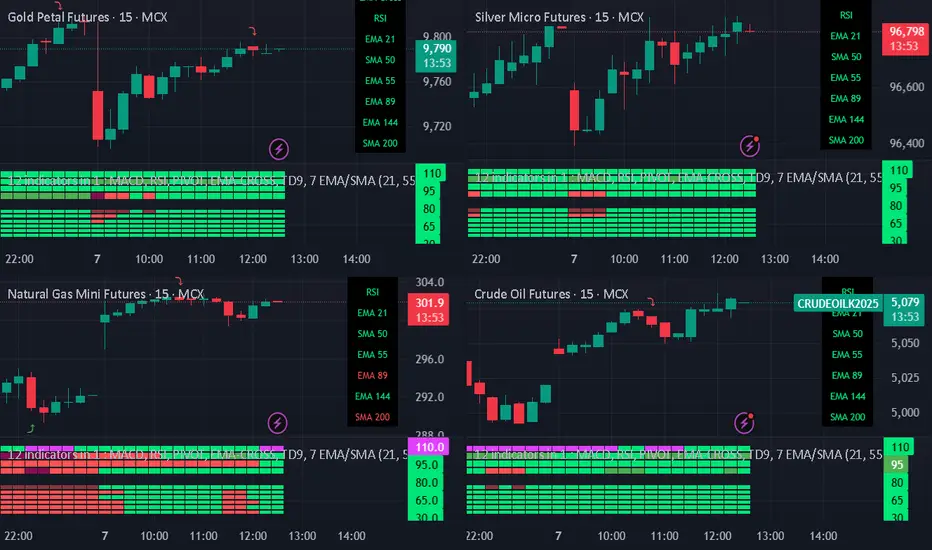
Best Commodity layoutBest Commodity layout
Crafting Your Optimal Commodity Technical Chart Layout in TradingView
The "best" commodity technical chart layout in TradingView is highly personalized, depending on your trading style, strategy, and the specific commodities you're analyzing. However, a well-structured layout should provide a clear, comprehensive view of price action and key technical indicators to aid in decision-making.
Here's a guide to creating an effective commodity technical chart layout in TradingView, incorporating common practices and versatile tools:
1. Choosing Your Main Chart Type:
Candlestick Charts: This is the most popular choice for most traders. Candlesticks provide detailed information about the open, high, low, and close (OHLC) prices for a specific period, making it easier to identify patterns and market sentiment.
Bar Charts: Similar to candlesticks, bar charts also display OHLC data but in a different visual format.
Line Charts: Useful for a quick overview of the overall trend, typically plotting the closing prices.
Heikin Ashi: These charts can help filter out market noise and make trends easier to identify by averaging price data.
Renko or Kagi Charts: These focus solely on price movement, ignoring time, and can be useful for identifying support and resistance levels.
Recommendation: Start with Candlestick charts for their detailed information. You can always switch to other types for different analytical perspectives.
2. Essential Technical Indicators for Commodities:
While the "best" set of indicators is subjective, here are some widely used and effective ones for commodity analysis in TradingView:
Moving Averages (MAs):
Types: Simple Moving Average (SMA) and Exponential Moving Average (EMA) are common. EMAs react faster to recent price changes.
Use: Identify trend direction, support/resistance levels, and potential crossover signals. Common periods include 20, 50, 100, and 200.
Layout: Add 2-3 MAs of different lengths directly onto your main price chart. For example, a 21-period EMA for short-term trends and a 50-period EMA for medium-term trends.
Volume Indicators:
Types: Volume (displays trading activity) and On-Balance Volume (OBV).
Use: Confirm the strength of price movements. A significant price move accompanied by high volume is generally considered more valid.
Layout: Typically displayed in a separate pane below the main price chart.
Oscillators (for identifying overbought/oversold conditions and momentum):
Relative Strength Index (RSI): Measures the speed and change of price movements. Values above 70 often indicate overbought conditions, while below 30 suggest oversold conditions. Standard period is 14.
Moving Average Convergence Divergence (MACD): Shows the relationship between two moving averages of an asset's price. It consists of the MACD line, signal line, and histogram.1 Used for trend identification and momentum.
1.
medium.com
medium.com
Stochastic Oscillator: Compares a particular closing price of an asset to a range of its prices over a certain period. Also used to identify overbought/oversold conditions.
Commodity Channel Index (CCI): Identifies cyclical trends and can signal overbought/oversold levels.
Layout: Oscillators are usually placed in separate panes below the main chart. You might choose 1 or 2 that best suit your strategy (e.g., RSI and MACD).
Volatility Indicators:
Bollinger Bands: Consist of a middle band (typically an SMA) and two outer bands representing standard deviations. They help identify volatility and potential price breakouts or mean reversion.
Keltner Channels: Similar to Bollinger Bands but use Average True Range (ATR) for the outer bands. Can be used for breakout and trend-following strategies.
Average True Range (ATR): Measures market volatility. Useful for setting stop-loss orders.
Layout: Bollinger Bands and Keltner Channels are overlaid on the main price chart. ATR is usually in a separate pane.
Trend-Following Indicators:
Ichimoku Cloud (Ichimoku Kinko Hyo): A comprehensive indicator that defines support/resistance, identifies trend direction, and provides trading signals. It includes several components like the Kumo (Cloud), Tenkan-sen, and Kijun-sen.
Donchian Channels: Plots the highest high and lowest low over a set period. Useful for identifying breakouts and trend direction.
Layout: Ichimoku Cloud and Donchian Channels are overlaid on the main price chart.
Recommendation for a Balanced Layout:
Main Chart: Candlesticks, 2-3 EMAs (e.g., 21, 50, 200), Bollinger Bands or Keltner Channels.
Pane 1 (below main): Volume.
Pane 2 (below main): RSI (14) or MACD.
Pane 3 (optional): CCI or ATR if your strategy heavily relies on them.
3. Drawing Tools:
Effective use of drawing tools is crucial for technical analysis:
Trendlines: Connect swing highs or lows to identify the direction and strength of trends.
Support and Resistance Levels: Horizontal lines drawn at key price levels where the price has historically struggled to break above (resistance) or fall below (support).
Fibonacci Retracement and Extension Levels: Help identify potential support/resistance levels and price targets based on Fibonacci ratios.
Channels: Parallel trendlines that can define a price range.
Chart Patterns: Use tools to identify patterns like head and shoulders, triangles, flags, and pennants.
Layout Tip: Keep your most frequently used drawing tools easily accessible in the TradingView drawing panel.
4. Multi-Timeframe Analysis & Multi-Chart Layouts:
Analyzing commodities across different timeframes can provide a broader market perspective. TradingView allows you to set up multi-chart layouts (the number of charts available depends on your subscription plan).
Common Setup:
Chart 1 (Long-Term): Weekly or Daily chart to identify the major trend.
Chart 2 (Medium-Term): 4-hour or Daily chart for more detailed trend analysis and identifying key levels.
Chart 3 (Short-Term): 1-hour or 15-minute chart for entry and exit signals.
Synchronization: TradingView allows you to synchronize symbols, crosshair, interval, and drawings across multiple charts in a layout, which can be very efficient.
5. Customization and Saving Your Layout:
Appearance: Customize chart colors (background, candles, grids), scales, and lines to your preference for better visual clarity and reduced eye strain. Access these via Chart Settings (the gear icon).
Saving Layouts: Once you have a setup you like, save it as a chart layout in TradingView. You can create multiple layouts for different commodities, strategies, or analytical purposes.
Indicator Templates: Save combinations of indicators as templates for quick application to new charts.
Tips for the "Best" Layout:
Keep it Clean: Avoid cluttering your chart with too many indicators. Focus on a few that you understand well and that complement your strategy.
Consistency: Use consistent settings for your indicators across different charts and timeframes.
Practice: The "best" layout is one that works for you. Experiment with different indicators and setups on a demo account or through backtesting to see what yields the best results for your trading style.
Stay Informed: Be aware that some commodities (e.g., agricultural products) can be influenced by seasonal patterns or specific reports (like USDA reports for crops, EIA for oil). While not a direct part of the "chart layout," integrating this knowledge with your technical analysis is crucial. TradingView has features to display key events like earnings reports or dividends, which can be relevant. Some community scripts on TradingView even offer overlays for planting and harvesting seasons for agricultural commodities.
By following these guidelines and experimenting to find what suits your individual needs, you can create a powerful and effective commodity technical chart layout in TradingView. Remember to regularly review and refine your layout as your trading strategies evolve.
"Silver – Bearish Move Toward Support"🧠 Market Overview:
Instrument: Likely Silver (based on file name).
Chart Context: The price is currently trading below both the 50 EMA (red) and 200 EMA (blue), indicating bearish momentum and a possible shift in market structure.
📊 Key Technical Components:
🔹 Exponential Moving Averages (EMA):
50 EMA (32.614) is above the 200 EMA (32.526) but both are above the current price.
This crossover is recent and could indicate the beginning of a larger downtrend if confirmed by continued price action below both EMAs.
🔹 Market Structure:
POI (Point of Interest) marks a previous swing high where selling pressure emerged.
The chart shows internal liquidity (INT.LQ) sweeps both above and below consolidation areas, hinting at smart money manipulation to grab liquidity before making a move.
🔹 Resistance Zone:
Clearly defined between approx. 33.4–34.0, where price was rejected after a failed attempt to break higher.
Multiple rejections from this zone show strong selling pressure.
🔹 Support Zone:
Sitting between approx. 30.8–31.2.
Price previously consolidated here before a bullish move, making it a likely target for a return test or a potential bounce.
📉 Bearish Scenario & Projection:
The price broke below a short-term structure and failed to hold above EMAs.
The current price action shows a bearish pullback likely to form a Lower High (LH).
The projected path shows a pullback to previous support-turned-resistance, followed by a breakdown targeting the support zone.
✅ Bias:
Short-term bias: Bearish
Medium-term bias: Bearish, unless price reclaims the 200 EMA and consolidates above the resistance zone.
🔍 Confluences Supporting Bearish Outlook:
Price below EMAs (dynamic resistance).
Failed higher highs with liquidity sweeps (indicating smart money selling).
Clear market structure shift to the downside.
Anticipated retest of support zone around 30.8–31.2.

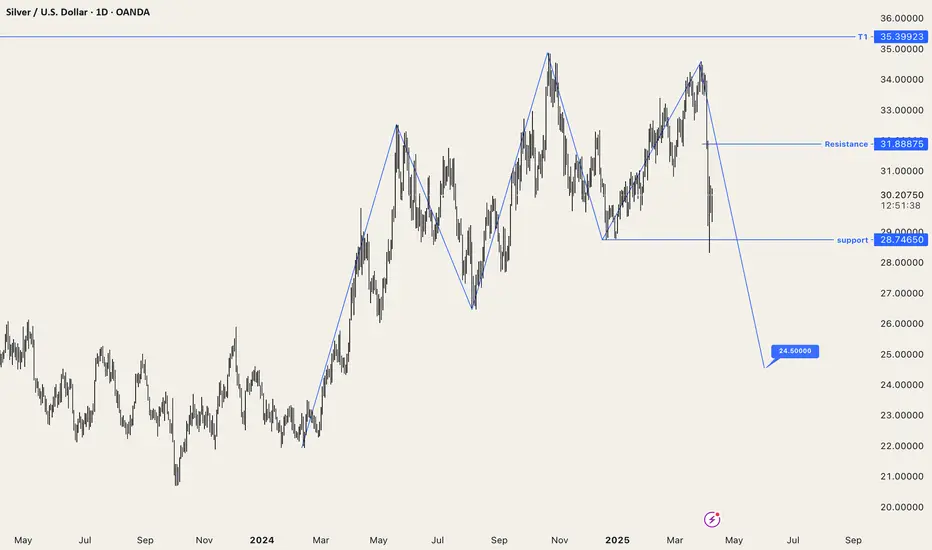
XAG: Silver projected for a fall till 24.50
Bearish invalidation if the price doesn't close, confirms the close below $28.75, and breaks the resistance level of 31.8875.
Right now it's a wait-and-watch scenario. Trade for sell will be active either on rejection of resistance or break-down of support
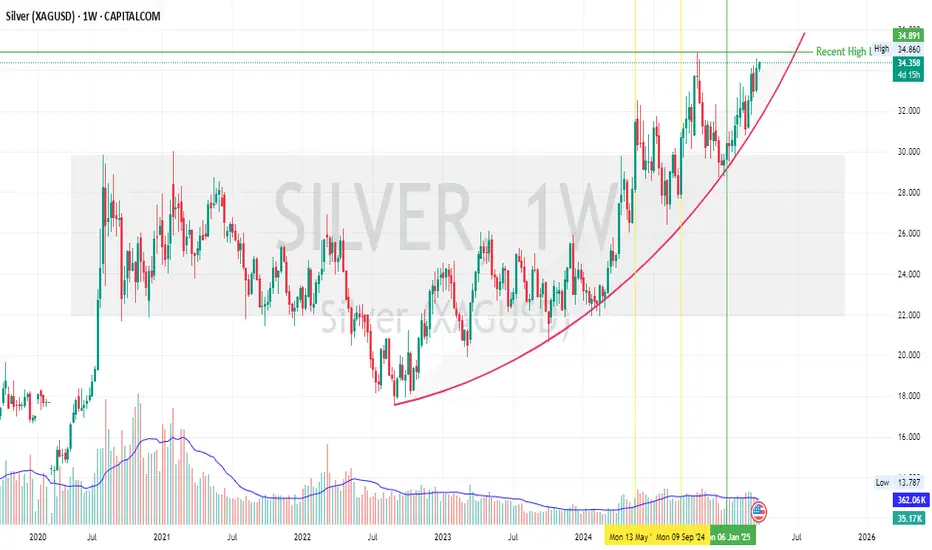
Silver Going Parabolic Silver tried to break out of the horizontal range thrice (marked on chart), but was finally successful only in its third attempt on 6th Jan 2025 and did a retest too.
Post 6th Jan 2025, Silver has been in uptrend keeping up with the Gold in terms of trajectory.
It looks like there is more room upwards as geopolitical events (Tariffs, trade wars etc) shape coming months and uncertainty remains high.
Lets see how it plays out.
Trade Safe
Gold silver update next Our Spot #Gold Range Prediction from 31/03/2025 to 04/04/2025 is as under.
Gold Spot : 3023$-3126$
Gold INR : 88100-91050
Our Spot #Silver Range prediction from 31/03/2025 to 04/04/2025 is as under.
Silver Spot: 33.44$-35.05$
Silver INR: 98400-103200
It must be remembered that price of precious metal depends on so many world wide factors like inflation, Fed interest rate, trade barrier, geopolitical tension, demand, supply, bond yield, dollar index , GDP, payroll data, CPI, currency fluctuation, debt ceiling , expected tax & duty changes, other commodity price crude oil etc. etc. and hence there can not be any accurate barometer of predicting precious metal price.
Gold INR has been calculated taking Gold Spot international price and converting the same assuming fixed Indian rupee rate. However, this is not accurate method as change in rupee value to dollar can substantially impact Gold INR price. Pl. note that price of commodity doesn't depend upon performence of company but depend upon performence of world economy, hence it is extremely risky to trade in commodities. Commodities market also become more volatile during contract expiry.
These are not a recommendation for buy or sell. This view is only for educational purpose. You are requested to consult your financial advisor before entering in to any trade.

Gold silver update Our Spot #Gold Range Prediction from 31/03/2025 to 04/04/2025 is as under.
Gold Spot : 3023$-3126$
Gold INR : 88100-91050
Our Spot #Silver Range prediction from 31/03/2025 to 04/04/2025 is as under.
Silver Spot: 33.44$-35.05$
Silver INR: 98400-103200
It must be remembered that price of precious metal depends on so many world wide factors like inflation, Fed interest rate, trade barrier, geopolitical tension, demand, supply, bond yield, dollar index , GDP, payroll data, CPI, currency fluctuation, debt ceiling , expected tax & duty changes, other commodity price crude oil etc. etc. and hence there can not be any accurate barometer of predicting precious metal price.
Gold INR has been calculated taking Gold Spot international price and converting the same assuming fixed Indian rupee rate. However, this is not accurate method as change in rupee value to dollar can substantially impact Gold INR price. Pl. note that price of commodity doesn't depend upon performence of company but depend upon performence of world economy, hence it is extremely risky to trade in commodities. Commodities market also become more volatile during contract expiry.
These are not a recommendation for buy or sell. This view is only for educational purpose. You are requested to consult your financial advisor before entering in to any trade.

Good silver next wives Our Spot #Gold Range Prediction from 31/03/2025 to 04/04/2025 is as under.
Gold Spot : 3023$-3126$
Gold INR : 88100-91050
Our Spot #Silver Range prediction from 31/03/2025 to 04/04/2025 is as under.
Silver Spot: 33.44$-35.05$
Silver INR: 98400-103200
It must be remembered that price of precious metal depends on so many world wide factors like inflation, Fed interest rate, trade barrier, geopolitical tension, demand, supply, bond yield, dollar index , GDP, payroll data, CPI, currency fluctuation, debt ceiling , expected tax & duty changes, other commodity price crude oil etc. etc. and hence there can not be any accurate barometer of predicting precious metal price.
Gold INR has been calculated taking Gold Spot international price and converting the same assuming fixed Indian rupee rate. However, this is not accurate method as change in rupee value to dollar can substantially impact Gold INR price. Pl. note that price of commodity doesn't depend upon performence of company but depend upon performence of world economy, hence it is extremely risky to trade in commodities. Commodities market also become more volatile during contract expiry.
These are not a recommendation for buy or sell. This view is only for educational purpose. You are requested to consult your financial advisor before entering in to any trade.

xagusd double bottom with divergenceXAGUSD create double bottom with morning diji star with rsi divergence if it goes and susstain above nechline then superb bull run can seen.
buy xagusd above 29.88 add more 29 closing sl below 28.75 tg 31.9-33.78

XAG/USD (Silver) 4H Chart Analysis – Bearish Setup📉 XAG/USD (Silver) 4H Chart Analysis – Bearish Setup 🚨
🔍 Key Observations:
Supply Zone (POI - Point of Interest) 🟪: The price is approaching a strong resistance area around $33.23 - $33.50.
Liquidity Grab (LQ) & Rejection Expected ❌: The previous major liquidity zone (LQ) suggests a possible fake breakout or rejection.
Bearish Projection ⬇️: The chart outlines a potential reversal after reaching resistance, leading to a drop towards $31.00 - $30.50.
📌 Trading Plan:
Short Entry 🎯: Around $33.20 - $33.50 (if price rejects this area).
Target 🎯: Major demand zone at $31.00.
Stop Loss 🚨: Above $33.60 (to avoid fakeouts).
Confirmation Needed 📊: Look for bearish candlestick patterns (e.g., engulfing, wicks, or double top formations).
⚠️ Final Thoughts:
Bearish Bias ⚠️ unless price breaks and holds above $33.50.
Monitor market conditions 🧐—news and fundamentals could shift momentum.
🔥 Trade smart! What do you think?

Silver Following Our Blueprint Perfectly - Latest PA Update Looks like my previous analysis on silver played out exactly as expected! That black arrow path we discussed when silver was trading in the 29-30 zone has materialized beautifully, bringing us to our current price of 32.74.
Current Technical Picture
Silver is giving us some strong bullish signals right now. After testing the immediate support zone at 31.80-32.20 (marked as "Immediate support" on the chart), price has bounced nicely. This area has proven to be reliable support during this recent leg up.
The red horizontal resistance zone around 34.80 is the next major hurdle to overcome. This level caused rejection back in October 2024, so we can expect some selling pressure there initially.
The key correlation right now is with gold. Silver tends to follow gold lead but with amplified moves. If gold manages to break out of its range (as we discussed in the gold analysis today), silver could really take off with an explosive move higher.
The current setup remains bullish as long as price stays above the immediate support zone (31.80-32.20). The risk/reward for longs is quite favorable here, with multiple support levels underneath current price.
The major support at 30 (green horizontal line) looks solid, providing a clear level to manage risk against for longer-term positions.
I'm watching for gold to provide the trigger for silver's next big move. Once gold confirms its direction, silver is likely to follow with even greater percentage moves.
This setup continues to develop exactly as predicted in our previous analysis .
