EMA vs SMA vs WMA: Which Moving Average Should You Use?🔎 Intro / Overview
Moving Averages remain one of the most trusted tools in technical analysis. They smooth price action, highlight the trend, and often act as dynamic support or resistance.
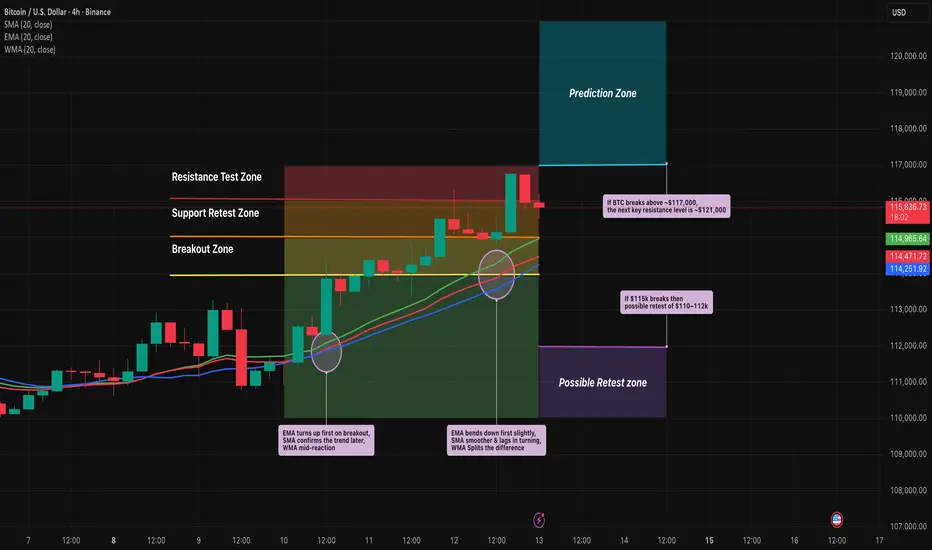
In this post, we compare the 20-period SMA, EMA, and WMA on BTCUSD 4H to show how each reacts differently to market moves.
___________________________________________________________
📔 Concept
SMA (Simple Moving Average): Every candle in the lookback is weighted equally → smooth but slower to react.
EMA (Exponential Moving Average): Recent candles carry more weight → reacts faster, hugs price closely.
WMA (Weighted Moving Average): Linear weighting → a balance between SMA’s stability and EMA’s sensitivity.
The difference lies in responsiveness. Faster averages react early but risk false signals, slower averages confirm trends but lag.
___________________________________________________________
📌 How to Use
1️⃣ Plot the 20-period SMA, EMA, and WMA together.
2️⃣ Watch how each responds during pullbacks, rallies, and consolidations.
3️⃣ Use EMA for quicker signals, SMA for smoother long-term view, and WMA if you prefer a middle ground.
4️⃣ Combine with price action or RSI to avoid relying on moving averages alone.
___________________________________________________________
🎯 Trading Plan
Intraday traders: EMA crossovers (e.g., 9 vs 21 EMA) for faster entries and exits.
Swing traders: SMA for identifying trend direction and major support/resistance.
Balanced traders: WMA for medium-term setups where stability and responsiveness matter equally.
Always align the moving average with your trading style and risk appetite.
___________________________________________________________
📊 Chart Explanation
On BTCUSD 4H:
EMA (red) bent upward first during the $114k breakout, SMA (blue) confirmed later, and WMA (green) sat between them.
At the $115k retest, EMA dipped first, while SMA lagged.
At $116.5–117k resistance, EMA whipsawed but SMA stayed smoother.
Notice how these differences become clear during sharp pullbacks, quick rallies, and sideways ranges.
___________________________________________________________
👀 Observation
EMA is quick but noisy ⚡, SMA is calm but late 🕰️, WMA strikes a middle ground ⚖️.
___________________________________________________________
❗ Why It Matters?
Choosing the right moving average impacts how quickly you spot entries, confirm trends, and manage stop-losses. Understanding the differences helps traders adapt strategies to both trending and sideways markets.
___________________________________________________________
🎯 Conclusion
No single moving average is “best.” Each serves a purpose depending on the timeframe and style of trading. The key is consistency — choose one that aligns with your plan, test it, and apply it with discipline.
👉 Which one do you prefer in your trading — EMA, SMA, or WMA?
___________________________________________________________
⚠️ Disclaimer
📘 For educational purposes only ·
🙅 Not SEBI registered ·
❌ Not a buy/sell recommendation ·
🧠 Purely a learning resource ·
📊 Not Financial Advice
Sma
#RUSHIL DECOR LONGTrade Or Invest Wisely.
We Can Just Predict.
Please Like And Share If You Agree With The Idea
Disclaimer: I Am Not A SEBI Registered Advisor, So Before Entering On My View Please Ask Your SEBI Registered Advisor. Profit Is Your And Loss Is Your.

WILL DELTA CORP BOUNCE FROM FAVOURITE SMA?Trade Or Invest Wisely.
We Can Just Predict.
Please Like And Share If You Agree With The Idea
Disclaimer: I Am Not A SEBI Registered Advisor, So Before Entering On My View Please Ask Your SEBI Registered Advisor. Profit Is Your And Loss Is Your.

Pidilite, Triangle Breakout, EMA/SMA breakoutPidilite, given a Triangle Breakoutand also closed above EMA/SMA breakout

SWING TRADE - COAL INDIA LTD - R:R @ 1:2Potential Opportunity as Swing Trade in NSE:COALINDIA
Risk : Reward - 1:2
ENTRY - 167.00
TARGET - 187.00
STOP LOSS - 157.00
This is for Educational Purpose only, apply your prudence & consult your adviser before any investing.
HAPPY TRADING.....
#nse #swingtrade #nifty #coalindialtd #coal #nifty50 #priceaction #supportzone #trendline #retest # retracement #bullish #riskrewardratio #sma #simplemovingaverage

Bhel is at support.Disclaimer :- This is not any buy or sell recommendation. It is just my view on this counter. Kindly consult with your financial or investment advisor before investing.
Bhel has taken a support on weekly chart at 50 sma and 50% Fibbonacci retracement has been done. Stocastic rsi is giving support also. Support level is around 48. And upper levels are 60, 65, 75, 80 Respectively.

PENNANT & POLE PATTERN BREAKOUT AHEAD !SAIL : As you all can see that SAIL is forming pennant pattern from around 07 may 2021 , it took around 70 days to make this pattern. Now pattern is almost about to give a breakout / breakdown.
If it gives breakout , it will also break the 50 simple moving average (green line in the chart ) , Which is a strong bullish sign. Pole height is around 60% this implies the stock has more room ahead to move. If not 60% , 20% to 30% is also a good target for short term.
Lets keep Entry above 130 and very short term swing target of 148 .
Mid and long term holders can keep high targets.
This was my personal analysis on the stock and it was only for educational purpose. Feel free to share your views/ feedback.

Will this breakout happen ? Long Ride Time !Eichermotors : 1) Chart analysis : Stock is forming sort of a triangle pattern and it is very near breakout zone. Keep an constant eye on this stock as breakout is possible any moment if market supports the momentum.
Only enter the stock after the breakout with good volumes.
2) Indicator analysis : As you all can see green moving line , its 50 Simple moving average. Stock just took support from its 50SMA , this is positive sign .
3) Fundamental analysis : ROCE = 17+ , ROE = 13+ , Current ratio = 3.5 + , Debt to equity 0.
I gave my analysis on this stock when it was at 2481 price , CMP is around 2712 and again there is chance of breakout .
Find below link to my previous analysis.
Note :-
*This analysis is for educational purpose , feel free to share your queries/ feedback.*

Coal India: Short term to Mid term bullishAll indicator are positive in daily chart Price above Ichimoku cloud, Conversion line, and lagging span also above the cloud. CMP above all moving averages. Daily MACD cut on positive side, Weekly MACD cut finished buy not yet price shoot up. Upcoming weeks may expect the upward side. These parameters may help to reach the targets. In monthly chart, indicators are loosing the strength on bearish side and slowly turning to positive side.
Vijayaraghavan.K,
Kovilpatti, Tuticorin Dist.

Tata MOTORS-Price action at 315 or 302NSE:TATAMOTORS
BUY above 315 for a target 340
Short below 302 for a target 275


BREAKOUT of 107 Possible in NTPC!!INVERTED HEAD AND SHOULDERS formation in last couple of months, a breakout from resistance of 107 may be seen in the upcoming week.GOOD BUY VOLUMES ALSO SEEN AFTER BUDGET DAY !!
WEEKLY MOVING AVERAGE CROSSING THE MONTHLY MOVING AVERAGE. NSE:NTPC

Technical Analysis: EURUSD eyes 1.2300 amid Brexit, US stimulusWith the recently upbeat markets, amid hopes of a Brexit deal and the US coronavirus (COVID-19) aid package, EURUSD is up for grabs ahead of Christmas. While the key fundamental events are yet to be announced, no major negatives are likely to erupt, which in turn cuts the US dollar’s safe-haven demand. Technically, the currency major’s ability to stay past the two-week-old rising trend line keeps the buyers hopeful. As a result, EURUSD is readying another battle with the weekly resistance line around 1.2230. However, a successful break of which might not refrain from crossing the monthly peak near 1.2270 to aim the 1.2300 round-figure.
Meanwhile, a downside break of the stated support line, at 1.2150 now, will have another back-up in the form of an ascending trend line from December 02, currently around 1.2100. Should EURUSD bears manage to conquer 1.2100, 200-SMA near 1.2010 and the 1.2000 psychological magnet will gain market attention. Overall, the bulls are set to question the early 2018 highs until the EURUSD prices drop below the August month’s peak of 1.2010.

SIMPLE MOVING AVG 10,20,50,100,200 with RESOLUTIONMoving averages work quite well in strong trending conditions but poorly in choppy or ranging conditions.
use this indicator along with Price action theory and not alone.
Moving average crossovers are a popular strategy for both entries and exits.
MAs can also highlight areas of potential support or resistance

Short ITC below 195 (Targets 184, 176, 157)Price has met resistance at 193-195 levels with 2 sweet Spinning Tops.
100 Day SMA @ 195.50 is a potential resistance.
Square off if it closes above 195 on Daily. A tight stop loss but playing safe; open to fresh entries.
GLHF!


Simple strategy for investors and long term positional tradersPresenting a very simple strategy for investors and long term positional traders using 200 day SMA and MACD to achieved good returns by riding bull run and cut losses early.
Please share your feedback and suggestions. _/\_

Watch for trend change - EsterTechnical :
RSI - Oversold
MACD - Possible curve in coming days
Current price far lower than 10/20/50 days SMA. Generally price trend to close gap with SMAs in certain period. Either SMAs should come down OR price should go up.
I will better watch for price action and enter once I see MACD giving right signal. Company results are scheduled on tomorrow so also check for no bad news before entering.
