USDCHF – M15 | Sell-Side Sweep → Reactive Bounce Price engineered a clean sell-side liquidity run, flushing range lows with displacement. The reaction that followed is corrective, not impulsive. What we’re seeing now is relief buying into discount, not a trend reversal.
Current bounce is unfolding inside prior inefficiency / mitigation, with structure still bearish on the execution timeframe.
Market Read
Range distribution → sharp sell-side sweep
Bounce = mitigation of bearish orderflow
No bullish displacement, only overlap
Execution Bias
Shorts favored on retracement into the marked supply / imbalance
Invalidation only on strong M15 acceptance above the green high
Targets
Recent sell-side lows
Extension into external liquidity below
Deeper discount if momentum expands
Smartmoneyconcept

XAUUSD (H1) – Following the bullish channelpatience before continuation ✨
Market structure
Gold remains in a well-defined ascending channel on the H1 timeframe. Despite recent intraday pullbacks, the overall structure is still bullish with higher highs and higher lows preserved. Current price action shows consolidation inside the channel rather than any sign of trend reversal.
Technical outlook (Lana’s view)
Price is rotating around the midline of the rising channel, indicating healthy digestion after the previous impulsive leg.
The recent pullback appears to be a controlled correction, likely aimed at collecting buy-side liquidity before the next expansion.
Market is still respecting structure and trendline support — no breakdown confirmed so far.
Key levels to watch
Buy-side focus
FVG Buy zone: 4434 – 4437
A clean reaction here could offer a good continuation entry within the trend.
Major buy zone: 4400 – 4404
This is the stronger demand area aligned with channel support and previous structure.
Sell-side reaction (short-term only)
4512 – 4515
This zone aligns with Fibonacci extension and channel resistance, where short-term profit-taking or reactions may appear.
Scenario outlook
As long as price holds above the lower channel boundary, bullish continuation remains the primary scenario.
A pullback into FVG or the lower buy zone followed by confirmation would favor another push toward channel highs and liquidity above.
Only a clean break and acceptance below 4400 would force a reassessment of the bullish bias.
Lana’s trading mindset 💛
No chasing price near resistance.
Let price come back into value zones inside the channel.
Trade reactions, not predictions.
Trend is your friend — until structure says otherwise.
This analysis reflects a personal technical perspective for educational purposes only. Always manage risk carefully.

SMC TRADING PLAN – XAUUSD (1H)1. Market Context
Observing the chart shows:
The price is moving in a short-term downtrend, indicated by the downtrend line that has been tested multiple times but not decisively broken.
Twice the price touched the trendline, it created a strong reaction → confirming this as a dynamic resistance zone.
The market has created MSS (Market Structure Shift) at both the top and bottom → indicating a transition phase, suitable for scalping trades at reaction zones.
The price levels you marked (4,230 – 4,219 – 4,192 – 4,181) are indeed potential liquidity pools / order blocks.
2. Main Trend & Smart Money Intentions
✔ What is Smart Money doing?
Attracting liquidity below around the 4,158 – 4,160 area (noted as “Liquidity” on the chart).
Pushing the price up to retest resistance around the trendline to hunt the liquidity of the Long side at the top.
Then bringing the price to a deeper discount area → then deciding to push up to break or continue distributing.
That is: Short-term Buy – Short-term Sell – then stronger Buy at the liquidity bottom
→ This is the standard Liquidity Hunt – MSS – Reversal model in SMC.
3. Two Main Scenarios
Scenario 1 – SELL from resistance (priority)
The price is approaching the trendline and resistance area you marked. This is a high-probability setup.
Ideal SELL zone:
📍 4,219 – 4,221 (reaction zone + FVG + Trendline retest)
Scalping target:
TP1 → 4,192
TP2 → 4,181
If a strong break: extend to 4,160 – 4,158 (main liquidity area)
Stoploss: 4,230.7 (above the liquidity sweep area)
Reason for SELL
Touching the downtrend line → strong technical reaction.
This is the Premium zone of the upward move.
Likely to form a short-term distribution before pushing down to hunt liquidity.
Scenario 2 – BUY from liquidity zone (secondary priority)
If the price dives down to take liquidity first, prioritize Buy at the bottom zone.
Strong BUY zone (Liquidity Zone):
📍 4,160 – 4,158
→ This is the bottom marked by Smart Money to hunt stoploss & create a new bottom.
Target:
TP1 → 4,181
TP2 → 4,192
TP3 → 4,219 – 4,230 (expecting to push the price to take top liquidity)
Stoploss: 4,146
Reason for BUY
Clear liquidity zone, created by the previous low bottom.
Coincides with the lower trendline.
Two previous MSS indicate the market is in an accumulation phase for a short-term reversal.
4. Detailed Trading Plan
🎯 SELL Setup – Quick Scalp (priority)
Entry: 4,219 – 4,221
SL: 4,230
TP:
TP1: 4,192
TP2: 4,181
TP3: 4,160 (if price breaks down)
High probability because: trendline reaction + premium zone + liquidity build-up.
🎯 BUY Setup – Safe (wait for price to hunt down)
Entry: 4,160 – 4,158
SL: 4,146
TP:
TP1: 4,181
TP2: 4,192
TP3: 4,219 – 4,230
High probability because: main liquidity zone + discount zone + potential for smart money to push up from the bottom.
5. Trading Advice
Only take orders when there is a clear reaction: wick rejection, minor structure break on M5.
Do not enter orders in the middle of the zone – only trade when the price hits the key level.
Scalping should prioritize quick TP because gold's range is quite strong.
📌 Conclusion
Your chart gives very clear signals according to SMC:
SELL at Premium – Buy at Discount – all revolving around liquidity hunt & MSS.
Two trading zones have been extremely clearly identified:
✔ SELL Zone: 4,219 – 4,221
✔ BUY Zone: 4,160 – 4,158

Price hits FVG: Get ready for Market Maker's next move!In the current market context, the price structure is clearly showing the regulation of Smart Money as it continuously creates new liquidity zones, breaks structures, and leaves important footprints like OB – FVG – BOS. Below is a trading plan built based on the observed price zones on the chart:
🟥 1. Market Context – Role of OB Sell
Price has reacted strongly at the Order Block Sell in the 4,237 – 4,256 zone.
This is where a strong push down occurred (accompanied by a structure break – BOS), confirming this as an active supply zone.
➡️ This will be the key level to monitor all pullbacks in the coming time.
🟩 2. Current Market Structure – Market Structure
After the OB Sell is activated, the market creates a bearish BOS.
Price is moving down to approach the Liquidity Buy below in the 4,154 – 4,161 zone.
On the way, price leaves a Fair Value Gap (FVG) – a zone that can be used as a retracement point to continue selling.
➡️ Overall bias: Bearish intraday – favor sell on pullback.
🟨 3. Main Trading Plan – SELL SETUP
🎯 Area of Interest
FVG: 4,197 – 4,214
This is the ideal price zone for price to return to balance before continuing the downtrend.
📌 Entry SELL:
Preferred scenario: Price retraces to fill FVG → reacts → creates a small bearish structure (BOS M1–M5) → Sell.
🎯 Targets:
TP1: 4,170 — intermediate support zone
TP2: Liquidity Buy: 4,154 – 4,161
TP3 (extended): 4,144 if liquidity below continues to be swept
🛑 Stop Loss:
Above the FVG peak or above the nearest OB zone: 4,214 – 4,227
➡️ High probability when price fails to break 4,214–4,227 and continues to create lower highs.
🟦 4. Secondary Scenario – SHORT-TERM BUY (Countertrend)
Only activated when price hits Liquidity Buy and a clear reversal signal appears:
📌 Entry BUY:
After sweeping liquidity in the 4,154–4,161 zone
Wait for bullish BOS confirmation on a lower timeframe
🎯 Targets:
4,184
4,197
4,214 (maximum – hit FVG and exit)
➡️ This is just a retracement trade, not trend-following, so risk management is crucial.
⭐ 5. Summary View
The market is moving in line with Smart Money behavior:
Sweep liquidity above (Sell-side Liquidity) → Create OB → Push price down
Leave FVG → Attract price back → Continue distribution
Main goal: Sweep Liquidity below
👉 The main trend remains SELL until the Liquidity Buy below is hit and a strong reversal structure is created.

Nifty 50: Short to 25,730 or Bounce at 25,650?📉 Market Breakdown
Nifty 50 has shown clear rejection from above resistance and the gap zone. On the 15-min timeframe, price broke structure to the downside, signalling potential continuation.
🎯 Key Levels to Watch
🔻 Possible move towards the gap below around 25,730
🛑 Key support zone sits near 25,650
🔄 Price may find demand here and attempt a reversal
👉 Let’s watch how price action unfolds around these levels. A rejection at support could set up a bounce, while a breakdown may open further downside.
Sharing my personal market view — not financial advice.

XAUUSD H1 – Double Tap Liquidity & Reentry Setup🕊️ Market Context
Gold just delivered a beautiful liquidity sweep from the highs at 4148, after multiple CHoCH–BMS transitions confirmed structural bullish intent.
We are now seeing price forming equal lows, tapping the buy zone (4090–4085) — a clean H1 demand block aligned with the 0.618 retracement.
💎 Technical Analysis (SMC Perspective)
Structure:
Higher-timeframe structure remains bullish, following multiple BMS breaks to the upside.
Current pullback is corrective — a typical liquidity sweep to rebalance inefficiency.
BUY ZONE: 4090 – 4085 (SL 4080)
→ H1 Demand (OB) + 0.618 Fib confluence.
→ Watching for M15 CHoCH confirmation before entering long.
Target: 4148
→ Buy-Side Liquidity (BSL) resting above previous highs — likely magnet for the next push.
🪶 Trading Plan
I’ll wait patiently for a clean sweep + M15 confirmation around 4085–4090 to re-enter long.
As long as price respects 4080, my bias remains bullish, targeting the next BSL @ 4148.
No trade if price fails to confirm on lower timeframe — patience over impulse. 💛
💭 Karina’s Note
This setup perfectly reflects the essence of SMC — liquidity engineering before continuation.
It’s not about catching every move; it’s about aligning with the story the market is telling.
This is my personal view based on SMC principles – not financial advice.
✨ Like & Follow for daily London session updates ✨

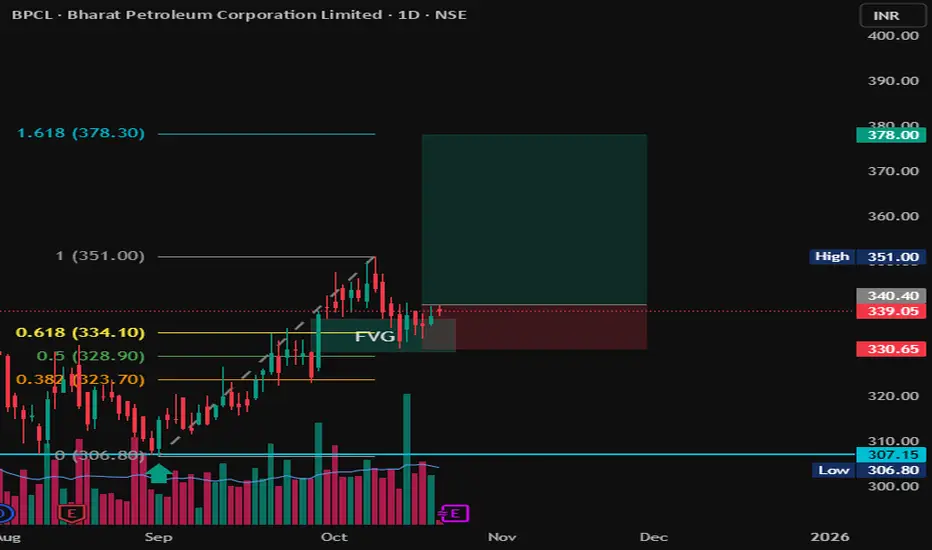
BPCL | FVG + Fibonacci COnfluence | Long Setup toward 378 💬 Description:
Chart Type: 1D (Daily)
Stock: BPCL – Bharat Petroleum Corporation Ltd.
🧩 Setup Overview
BPCL has completed a clean retracement into a Fair Value Gap (FVG) aligning with the 0.5–0.618 Fibonacci retracement zone from the previous upswing (306 → 351).
The zone around ₹334–₹340 acted as strong demand support, hinting at a possible continuation leg to the upside.
📊 Trade Plan
Entry Zone: ₹338–₹340
Stop Loss: ₹330
Target 1: ₹351
Target 2: ₹378 (1.618 Fib Extension)
Risk–Reward Ratio: ~1:3
📈 Technical Confluence
✅ FVG + 0.618 Fib alignment
✅ Retest & bounce confirmation
✅ Volume showing accumulation
✅ Clear higher-low structure maintained
🚨 Invalidation
Setup invalid if price closes below ₹330, which would break FVG and shift structure to bearish.
🧠 Bias: Bullish continuation
Time Horizon: Swing (2–4 weeks)
Gold sweeps SL, wait for BUY LIMIT at Demand Zone 4,223-4,225Timeframe analysis: H4/30M
Logic: Trend Continuation after liquidity sweep.
MARKET STRUCTURE ANALYSIS (SMC Analysis)
Main Trend: Bullish (Price is moving within a parallel channel).
Structure Confirmation (BOS): The chart has confirmed an upward Break of Structure (BOS), indicating that buyers are controlling the market.
Liquidity Sweep/Fake: The strong bearish candle (marked as "Fake") is a move to sweep Stop Losses of early buyers and gather liquidity before Smart Money pushes the price in the main direction. This is an Inducement action.
Key Demand Zone (POI/Demand Zone/Order Block): The TIMING BUY area (4,223.154 - 4,225.000) is a potential Demand Zone/Order Block identified by Smart Money. The price is expected to retest this area before continuing to rise.
MAIN TRADING SCENARIO (LONG SETUP)
SCENARIO: Wait for the price to Pullback to the POI area to enter a buy order, continuing the main bullish trend.
Parameter
Value
SMC Description
Action
BUY LIMIT
Place a pending buy order
Entry Zone (POI)
4,225.000 - 4,223.150
Demand Zone/Order Block after liquidity sweep.
Stop Loss (SL)
4,214.390
Place below the low of the liquidity sweep candle ("Fake Low"), ensuring safety.
Take Profit 1 (TP1)
4,240.000
Target the nearest Swing High.
Take Profit 2 (TP2)
4,250.000
Target psychological resistance and mid-channel.
Take Profit 3 (TP3)
4,260.000+
Target the upper boundary of the parallel channel.
R:R Ratio
Approximately 1:2.5 to 1:3.5 (Depending on TP)
Good R:R ratio for a trend-following trade.
RISK MANAGEMENT
Risk: Only risk a maximum of 1-2% of the account for this trade.
Breakeven: When the price hits TP1, move SL to the Entry point (Breakeven) to protect capital.
Invalidation: If the price closes the D1/H4 candle below the SL level (4,214.390), the buy plan will be invalidated.

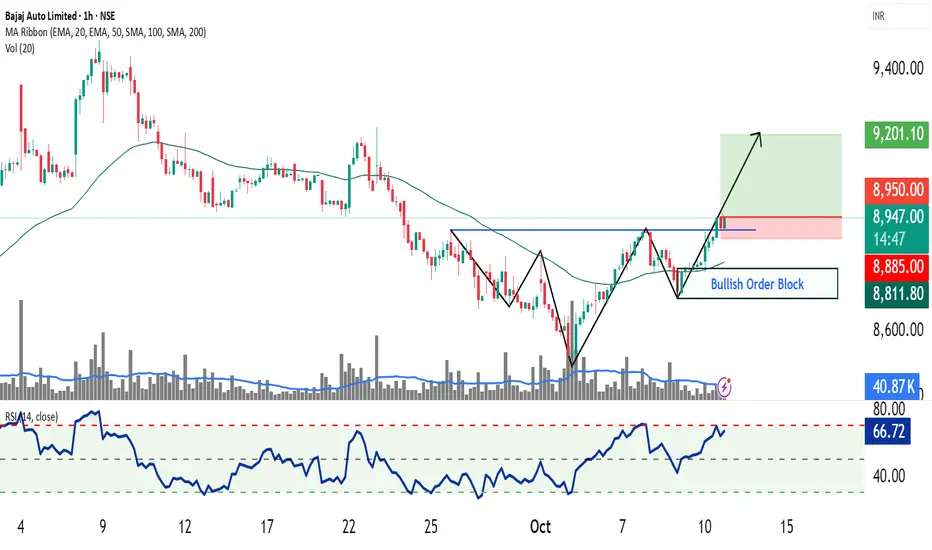
Bajaj Auto – Bullish head and shoulder breakout📈 Pattern Analysis: Bajaj Auto has successfully completed a Bullish Head and Shoulders pattern on the chart, followed by a clean breakout and subsequent retest, confirming the validity of the formation. The price action now awaits a pivot breakout, which would trigger the next leg of upside momentum.
📊 Trading Strategy:
Two distinct trading approaches can be considered based on trader type:
1. Retail Concept Strategy:
Enter long above the pivot high once price breaks decisively.
Place stop-loss below the breakout candle, ensuring a safer entry with confirmation.
Note: The risk–reward ratio is less favorable if the SL is kept below the right shoulder in classical style.
2. Smart Money Strategy:
Enter on retrace to the order block area positioned just above the right shoulder.
This offers a superior risk–reward entry aligned with institutional-style trading concepts.
🔎 Indicators & Trend:
50 EMA is sloping upward on the hourly timeframe, confirming short-term uptrend strength.
RSI > 65, indicating sustained bullish momentum with potential for continuation.
🎯 Target Projection:
Targets will be determined using the measurement rule, projecting the height of the head added to the neckline breakout zone.
⚠️ Disclaimer:
This analysis is prepared only for educational and training purposes. It does not constitute investment advice or a trading recommendation.
✍️ Prepared by: SEBI Certified Research Analyst (Not Registered)
XAUUSD Alert| Liquidity Grab or Trend Reversal?”XAUUSD Alert 🚨 | Liquidity Grab or Trend Reversal?”
Gold has recently pushed into the 3525 – 3550 rejection zone, a level that has historically acted as strong supply. After this extended bullish rally, price is now showing early signs of exhaustion. This could be a liquidity grab above resistance before the market corrects lower.
My expectation here is a short-term pullback. The first key area I’ll be watching is around 3450, which lines up with a smaller demand zone and could act as a temporary support. If buyers fail to defend that level, then I expect continuation toward the 3330 – 3320 zone, which is my final target and also a major higher-timeframe support point.
This level is very important because it was previously a strong base for accumulation, and if tested again, it could provide a potential long opportunity. However, if price breaks below 3320 decisively, it would open the door for a much deeper correction.
Overall, my short-term outlook is bearish retracement, but I’ll be closely watching how price reacts once we reach the deeper support levels.

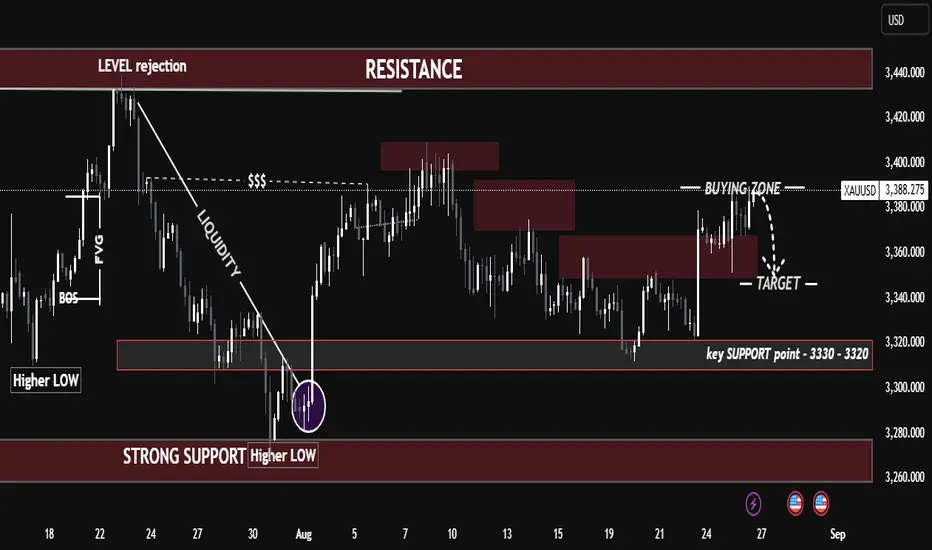
"Gold Setup: Buying Zone Rejection or Breakout Ahead?""Gold Setup: Buying Zone Rejection or Breakout Ahead?"
Gold is currently trading inside a buying zone (3380 – 3400) but facing rejection. Market structure is still holding higher lows, which keeps the bigger trend bullish, but short-term price action suggests a possible retracement move.
Resistance Zone: 3420 – 3440 (strong supply, previous rejection)
Key Support: 3330 – 3320 (major demand, higher low base)
Immediate Target: 3340 – 3360 (if rejection continues)
📉 Short-term bias: bearish correction toward 3340 – 3360
📈 Swing bias: bullish as long as 3330 – 3320 holds
🔑 My View:
I’ll be watching how price reacts around 3330 – 3320. Holding this level could trigger the next bullish leg toward 3420 – 3440. Losing it opens the door for deeper downside into 3280.
BTC Took Support – Big Move from Demand Zone Expected!🚀 BTC Took Support – Big Move from Demand Zone Expected!
Bitcoin (BTC/USD) has touched the demand zone and now showing signs of upside reversal. After taking out sell-side liquidity, price is getting ready for a bullish push toward higher targets.
📊 Technical Analysis:
🟤 Demand Zone (115,000 – 116,000):
Market came down and respected this zone. This is a strong area where buyers entered again.
🧲 Sell-Side Liquidity Grab:
Price formed equal lows, then broke them to collect liquidity before reversing — typical smart money behavior.
🔁 Break of Structure (BOS):
Structure break confirmed that trend might reverse now from bearish to bullish.
🟪 Fair Value Gap (FVG):
A clean FVG is also visible near the top side, and price may move to fill this imbalance.
🎯 Target: 119,000 USD:
If bulls hold the demand zone, BTC can easily move towards this resistance area. This is the short-term upside target.
📚 Key Learning Points:
Liquidity was collected below equal lows
Buyers stepped in from the demand zone
Break of structure confirms bullish pressure
FVG + Resistance area aligns with target
✅ Conclusion:
As long as BTC holds above 116,000, bulls are in control. This is a good zone for long entries, with a target near 119,000. Traders should watch for confirmation with minor BOS or strong bullish candles.

GBP/USD Technical Insight – Reversal Opportunity from Demand GBP/USD Technical Insight – Reversal Opportunity from Demand Zone
The GBP/USD chart showcases a classic liquidity sweep and bullish reaction from a clearly defined support zone (1.3360 – 1.3400). After an extended bearish move, price entered the demand area, rejected strongly, and formed a potential bullish reversal setup, signaling a possible move toward the resistance zone near 1.3740 – 1.3800.
The use of Supertrend Indicator confirms a shift in market structure, supporting the bullish bias. This setup reflects a textbook example of smart money behavior — where price mitigates imbalance, grabs liquidity, and rallies from institutional zones.
⸻
🧠 Educational Key Points:
• Support & Resistance Zones are well-respected.
• Trend Shift confirmed after long accumulation.
• Liquidity Engineering: Market makers swept the lows before reversing.
• Confluence of Structure + Indicator adds high-probability confidence.
📌 Potential Trade Idea:
Buy from the support zone with targets near resistance; manage risk below the support zone for precision.

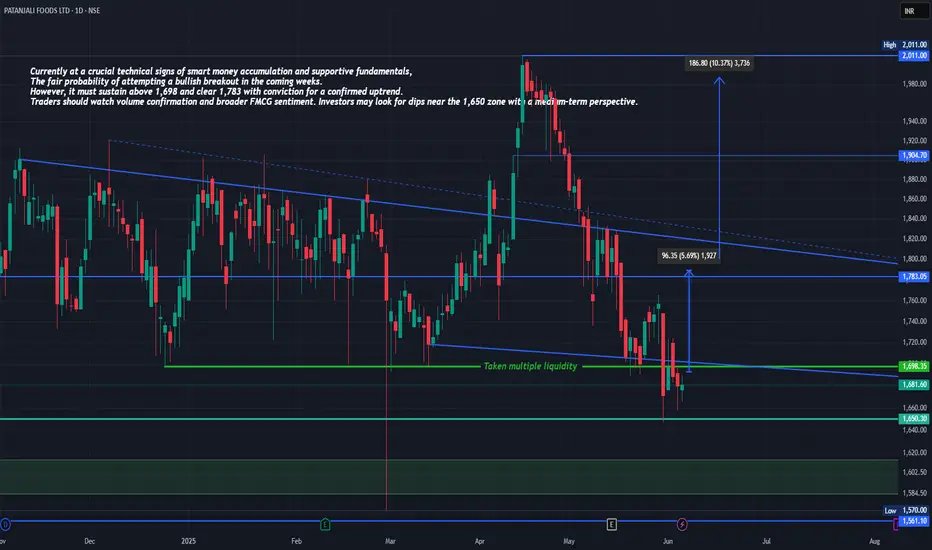
PATANJALI FOODS LTD – Daily Chart AnalysisPATANJALI FOODS LTD – Daily Chart Analysis
Price as on June 6, 2025: INR 1,681.60
Technical View with Fundamental Context
Price Structure Analysis:
Patanjali Foods appears to be consolidating within a large descending wedge pattern. The recent price action shows a bounce from the lower wedge boundary, where multiple liquidity points have been swept, creating a potential accumulation zone.
Current Support Zone: INR 1,650 to 1,698 (marked by green horizontal levels)
Immediate Resistance: INR 1,783 (falling trendline and horizontal supply zone)
Breakout Targets:
INR 1,783 (near resistance)
INR 1,904 (midterm supply area)
INR 2,011 (swing high from previous uptrend)
If the price sustains above 1,698 and gains volume strength, it may attempt a move toward the 1,783 zone, followed by a breakout targeting 1,904 and beyond.
Some Observations
Liquidity Grab Confirmed:
Price action shows a wick piercing below a crucial horizontal demand level. This sweep of stop-losses beneath support is often followed by a reversal, suggesting institutional accumulation.
Wedge Compression:
Multiple lower highs and relatively stable lows form a classic descending wedge pattern, which statistically favors bullish breakouts.
Measured Move Setup:
From the current level to the wedge breakout target at INR 1,783 represents a 5.69 percent move. Beyond that, the extended upside toward INR 2,011 offers a potential of over 10 percent.
Fundamentals Highlights:
Operates under strong brand equity with wide rural and urban penetration.
Strategic backward integration in oilseed procurement and processing.
Plays a major role in import substitution for edible oils, supported by government policies.
Recent Developments:
Restructuring and synergy with other Patanjali Group entities is ongoing.
Expansion into high-margin wellness and health products.
Strong demand trends seen in packaged foods and nutraceuticals.
Risks:
Vulnerability to global edible oil prices and supply chains.
High promoter holding under regulatory scrutiny can impact investor sentiment.
Positives:
Focus on indigenous production and Atmanirbhar Bharat themes.
Consistent demand for essentials even in weaker market cycles.
Debt reduction in recent quarters shows improvement in balance sheet strength.
Patanjali Foods is currently at a crucial technical zone. With signs of smart money accumulation and supportive fundamentals, the script has a fair probability of attempting a bullish breakout in the coming weeks. However, it must sustain above 1,698 and clear 1,783 with conviction for a confirmed uptrend.
Traders should watch volume confirmation and broader FMCG sentiment. Investors may look for dips near the 1,650 zone with a medium-term perspective.
Like, comment your thoughts, and share this post
Explore more stock ideas on the right hand side your feedback means a lot to me!
Disclaimer: This post is for educational purposes only and should not be considered a buy/sell recommendation.
AUD/USD: Bullish Momentum Builds from Strong DemandIn the 4-hour AUD/USD chart, strong supply and demand zones are visible. A significant demand zone is observed around the 0.62269 level. Within the chart, a Change of Character (ChoCh) is identified from the 0.6323 level, and a Break of Structure (BoS) is noted at the 0.63211 level. A strong selling reaction has been observed from the supply zone, and the market has retested that level again.
On the demand side, the market has touched the strong demand zone twice and showed a bullish formation each time. Currently, the price is forming a strong bullish candle again.
Based on the Fibonacci levels, potential upside targets could be seen at 0.62717, 0.63128, and 0.63312, provided the market holds above the demand zone. However, if the demand zone is broken, there is a possibility of the market dropping down to 0.61901 .

Gold Expected Move Gold expected move for today
Xauusd can give a good drop initially till 2621 and then shall give a sharp long move till 2647-48

How would Bitcoin react? Btc/Usdt Chart analysis Bitcoin on Hourly chart is has formed HH & HL (HIGHER HIGH, HIGHER LOW). Trend is definitely bullish but after a massive move every assets goes for a correction. Looking at hourly chart we can see that Bitcoin is trading in range bound and it need to take any side liquidity for any trade to be executed. For buy we would suggest to wait for the ATH (All time high) to be breaken out. So sell side we would suggest to wait for a MSS( Market structure shift). Weekends are usually slower for Crypto market. We will wait for the first Asian session of the day to start and will trade plan accordingly

EURUSD Impressive internal structureEURUSD has been consistently accumulating in a wide internal structure, these structures are best for scalpers and day traders since they have a definite range with lesser volatility and high predictability.
Order blocks are marked as per my analysis. Make sure to do your own analysis as well before creating any positions.

GBPJPY TRADE SETUPGBPJPY has touched it's supply zone.
It may fall a bit in daily basis
Swing Target 179.00

EURJPY 4H sell opportunity | on imbalance areaConfirmation:-
1] Market structure shift
2] Imbalance area
3] M pattern target complete
Target confirmation:-
1st target - imbalance area
2nd target - equal lows liquidity with imbalance

NZDCHF TRADE IDEApossible NZDCHF trade scenario will look for entry from above zone
enter with ltf confirmation if taken direct entry manage your risk properly 1:2-3 RR
Indicator based SMC approach. follow and like more such smc setups

GBPUSD TRADE IDEAPossible GBPUSD trade idea can look for buys from above mention level above setup is 1:3 RR please manage risk properly Enter at your own risk ! Indicator based SMC approach. follow and like for more such setups.

EURGBP TRADE IDEAPossible EURGBP trade idea
can look for buys from above mention level
above setup is 1:3 RR
please manage risk properly
Enter at your own risk !
Indicator based SMC approach.
follow and like for more such setups.
