Snp500
S&P 500 Elliott wave count ( intraday chart) Om Namah Shivay
The S&P 500 Intraday chart Elliott wave analysis gives some possible movement ideas.
This is for educational purpose only. There are no trading suggestions in this.
Om Namah Shivay
S&P 500 Elliott wave count ( daily chart) Om Namah Shivay
Trying to get an alternate Wave count for S&P 500. Other variations are possible.
Om Namah Shivay
SNP 500 chart on fed reserve rate cutThis is to illustrate the Federal Reserve Rate Cut during the 2008 housing crash vs Present Day. The Rate cut was done in 2008 to come out of a recession. But presently, the rate is cut before we enter any recession. So if we do see a major recession, there is nothing for Fed to do except may be to go for negative interest rate.
Any thought?
Chevron recent rally may be just a corrective pullback.Chevron Corporation: The move up in the last couple of sessions seems to be a corrective pullback. The RSI is now at the bearish extreme zone, the candles are forming bearish patterns. The prices have also closed below the KS & TS lines. The trend down is expected to continue. A close below 115.5 will confirm the trend.
AAL registering a breakout! How far it can carry?American Airlines Group – AAL has resigtered a fresh breakout from a consolidation zone. The RSI on the daily charts is close to 72 levels, on the daily charts the big white candle closing above the kumo is an indication of strength. Further there is a kumo crossover as well that indicates strength. The stock is expected to move to 35 levels in coming sessions, entries can be planned between 30.15 – 29.45 levels on the flip side if the stock fails to break away and falls into the cloud again, then stops may be kept near 29 levels. The trade has a very good risk to reward ratio. Follow me on twitter @bharatj82
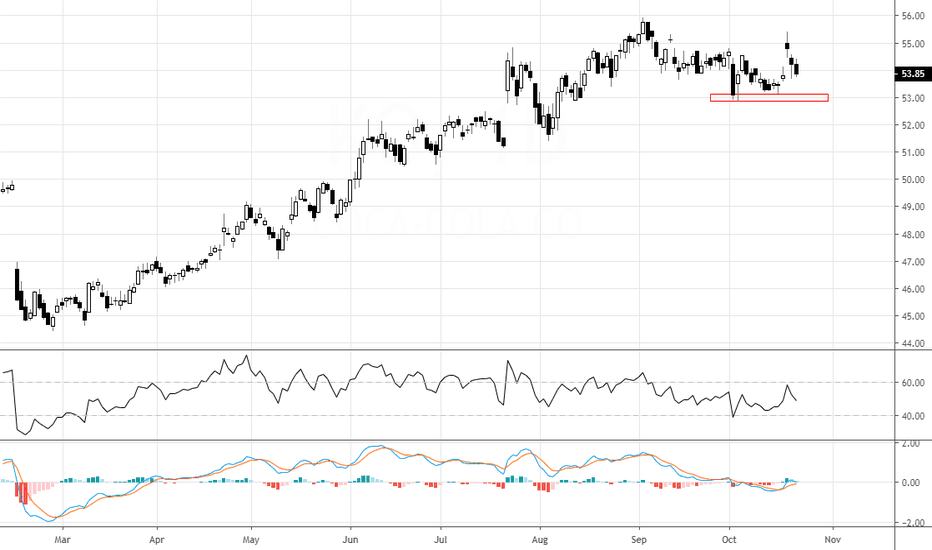
Coca Cola may get bitter here!The stock is in a dominant trend up. Recently a lower high and lower low price pattern has been noticed on the daily charts. The RSI also seems to have shifted the range from bullish 80-40 zones to neutral 60-40 zones in the past few weeks. Important support levels are marked on the charts. Breaking them may result into corrections. The degree of the corrections are still not predictable, but the RSI forewarns. To get more insights into RSI visit www.prorsi.com


