Foseco India - Breakout Setup, Move is ON...#FOSECOIND trading above Resistance of 4799
Next Resistance is at 6319
Support is at 3279
Here are previous charts:
Chart is self explanatory. Levels of breakout, possible up-moves (where stock may find resistances) and support (close below which, setup will be invalidated) are clearly defined.
Disclaimer: This is for demonstration and educational purpose only. This is not buying or selling recommendations. I am not SEBI registered. Please consult your financial advisor before taking any trade.
Stockanalysis

Free Cash Flow – The Most Ignored Metric That Can Save You!Hello Traders!
When most people look at a company’s financials, they stop at profits.
But smart investors know that profits on paper don’t always mean cash in hand.
That’s where Free Cash Flow (FCF) comes in, the metric that reveals the real financial strength of a business.
What is Free Cash Flow?
Free Cash Flow is the money a company has left after paying all operating expenses and making necessary investments in its business.
It’s the cash available to pay dividends, buy back shares, reduce debt, or reinvest for growth.
Why It Matters More Than Reported Profits
Cash is King:
A company might report high profits but still struggle if it doesn’t have actual cash flow.
FCF shows if the business can fund itself without borrowing.
Signals Financial Health:
Consistently positive FCF means the company generates enough money to grow and reward shareholders.
Negative FCF for many years can be a red flag unless it’s due to planned growth investments.
Protects During Tough Times:
Companies with strong FCF can survive economic slowdowns without cutting essential spending or taking on expensive debt.
How to Check It
You can find FCF in the company’s cash flow statement:
FCF = Operating Cash Flow – Capital Expenditures
Rahul’s Tip:
Don’t just chase high profits.
Always check if the company is actually generating cash, because without cash, growth and survival both become impossible.
Conclusion:
Free Cash Flow might be the most ignored metric in investing, but it’s also one of the most powerful.
It tells you if a company can stand on its own feet, grow sustainably, and protect your investment in tough markets.
If you found this useful, like the post, share your view in the comments, and follow for more practical investing tips!
Indian Bank - Long Setup, Move is ON...#INDIANB trading above Resistance of 427
Next Resistance is at 665
Support is at 299
Here are previous charts:
Chart is self explanatory. Entry, Resistances and Support are mentioned on the chart.
Disclaimer: This is for demonstration and educational purpose only. This is not buying or selling recommendations. I am not SEBI registered. Please consult your financial advisor before taking any trade.

How I Shortlist Fundamentally Strong Stocks in Just 10 Minutes!Hello Traders!
Finding fundamentally strong stocks doesn’t have to be a week-long research project.
With the right process, you can filter out weak companies and shortlist potential winners in just 10 minutes.
Here’s exactly how I do it.
Step 1: Check Revenue & Profit Growth
I look at the last 5 years’ data to see if both sales and profits are growing steadily.
A consistent upward trend means the company has a stable business model and strong demand for its products.
Step 2: Look at Debt Levels
A fundamentally strong company should have low or zero debt.
Too much debt can eat into profits and create risk during market slowdowns.
Step 3: Review Free Cash Flow
I check if the company is actually generating cash after expenses.
Positive free cash flow shows the business is self-sustainable and not dependent on constant borrowing.
Step 4: Check Return on Equity (ROE)
An ROE above 15% usually means management is using shareholders’ money efficiently.
It’s a sign of strong leadership and good capital allocation.
Step 5: See Valuation Ratios
I compare the P/E and P/B ratios with industry averages.
A great company bought at an overvalued price can still give poor returns, so valuation matters.
Rahul’s Tip:
Don’t overcomplicate the process.
Focus on these 5 points and you’ll quickly filter out the junk, leaving you with stocks worth deeper research.
Conclusion:
Stock analysis doesn’t have to be overwhelming.
With a structured checklist, you can shortlist fundamentally strong companies in minutes — and spend the rest of your time tracking their performance.
If this process helped you, like the post, share your thoughts in the comments, and follow for more simple investing strategies!
How Promoter Holding Tells You the Real Story of a Company!Hello Traders!
When you invest in a company, you’re putting your money into the vision and decisions of its promoters.
One of the most powerful yet overlooked indicators of a company’s future is its promoter holding , the percentage of shares owned by the people who run the business.
Here’s why it matters and how to read it.
1. High Promoter Holding Shows Confidence
If promoters own a large portion of the company, it means they have a big personal stake in its success.
They win only when shareholders win, which often aligns their interests with yours.
2. Falling Promoter Holding Can Be a Red Flag
If promoters are consistently reducing their stake without clear reasons, it could mean they are losing confidence or need cash for other purposes.
This trend needs deeper investigation before you invest.
3. Pledged Shares Tell Another Story
Sometimes promoters pledge their shares to take loans.
If a large percentage of holdings is pledged, it’s a risk, because if the loan isn’t repaid, lenders can sell those shares, pushing the stock price down.
4. Stability Over Time is a Good Sign
A steady promoter holding over years shows trust in the business and signals that promoters are in it for the long run.
Rahul’s Tip:
Promoter holding should never be looked at in isolation.
Always check it alongside fundamentals, financial health, and industry outlook before making any decision.
Conclusion:
Promoter holding can reveal the real confidence level of the people behind the company.
When the promoters are heavily invested, and not pledging their shares, it’s usually a sign you’re looking at a solid long-term bet.
If this post gave you a new perspective, like it, drop your thoughts in the comments, and follow for more practical stock market insights!

Godfrey Phillips India - Breakout Setup, Move is ON...#GODFRYPHLP trading above Resistance of 6771
Next Resistance is at 9804
Support is at 4339
Here are previous charts:
Chart is self explanatory. Levels of breakout, possible up-moves (where stock may find resistances) and support (close below which, setup will be invalidated) are clearly defined.
Disclaimer: This is for demonstration and educational purpose only. This is not buying or selling recommendations. I am not SEBI registered. Please consult your financial advisor before taking any trade.

Cartrade-A risky positional trade for ATH targets!Cartrade has given outstanding Q4 2024 results and bullishness in the stock is indicator of same.
However, these stocks come with good amount of risk with bigger rewards.
Stock has formed beautiful cup & handle pattern and is about to break it.
Once 1000 is crossed, we can see ATH levels soon. I had seen similar breakout in PBFintech (Policybazaar).
If you believe in new age startups, this stock is technically looking bullish.

HDFC Asset Management Company Ltd - Long Setup, Move is ON...#HDFCAMC trading above Resistance of 3844
Next Resistance is at 5237
Support is at 2982
Here are previous charts:
Chart is self explanatory. Levels of breakout, possible up-moves (where stock may find resistances) and support (close below which, setup will be invalidated) are clearly defined.
Disclaimer: This is for demonstration and educational purpose only. This is not buying or selling recommendations. I am not SEBI registered. Please consult your financial advisor before taking any trade.

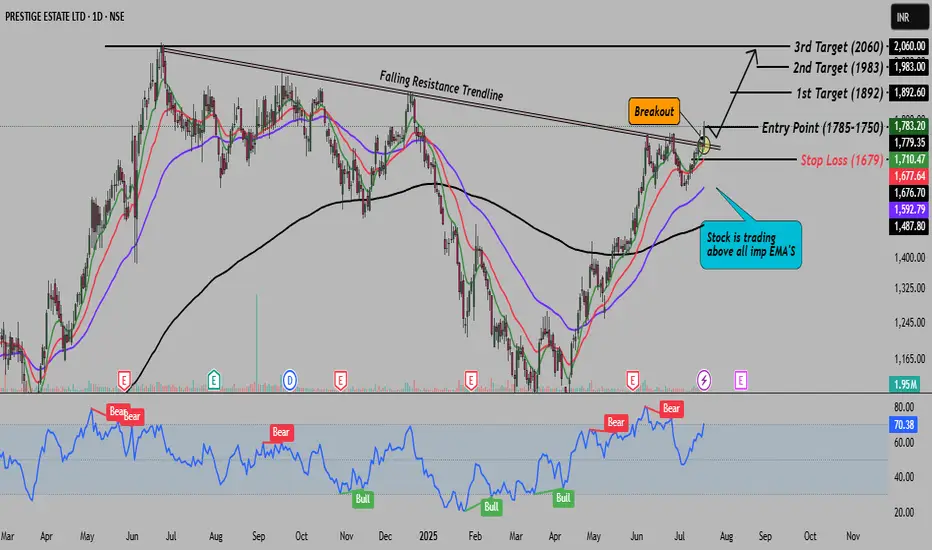
Prestige on breakout, this is ready to fly in blue sky!Hey Traders! Today, I’m sharing a stock that has broken out from a falling resistance trendline. This breakout sets the stage for a potential move towards its all-time high zone. It looks promising for both short-term and long-term trades. In my opinion, this could be a solid trade for the next few days.
Here’s what you need to know:
The stock has broken above a key falling resistance trendline.
This sets up a potential move towards the all-time high zone.
For better risk-reward, I suggest trading with smaller quantities.
Don’t forget to use the stop loss marked on the chart for risk management.
Please trade wisely and according to your own risk tolerance.
Disclaimer: This analysis is for educational purposes only. Always consult a financial advisor before making any investment decisions.
Gabriel India Limited - Breakout Setup, Move is ON..#GABRIEL trading above Resistance of 518
Next Resistance is at 673
Support is at 415
Here are previous charts:
Chart is self explanatory. Levels of breakout, possible up-moves (where stock may find resistances) and support (close below which, setup will be invalidated) are clearly defined.
Disclaimer: This is for demonstration and educational purpose only. This is not buying or selling recommendations. I am not SEBI registered. Please consult your financial advisor before taking any trade.

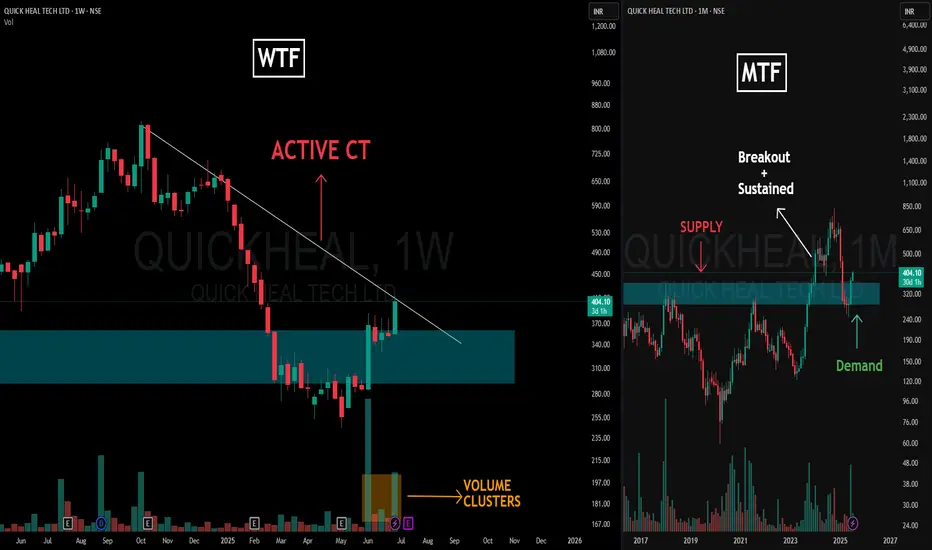
Supply Flips, Trendline Squeezes & Volume Talks – Clean MTFA📌 Charting Breakdown
This post dives into a clean Multi-Timeframe Analysis (MTFA) for QUICKHEAL using structural logic — with Weekly Time Frame (WTF) on the left and Monthly Time Frame (MTF) on the right.
🔍 Left Side – Weekly Time Frame (WTF)
-The Active CT (Counter-Trend) is marked via the dominant trendline resistance, which price is actively engaging.
-We observe a strong Volume Cluster forming near the base of the reclaimed demand zone — often a sign of accumulation or significant interest.
🧠 Right Side – Monthly Time Frame (MTF)
-Here, a textbook Supply & Demand Conversion is visualized.
-Initially, price reacted to a clear Supply Zone, creating the resistance base.
-Once that zone was broken with strength and sustained above it, the previous supply area transformed into Demand, validating the impulse move.
-Price then returned to test this now-converted zone — an SR flip seen through the lens of supply-demand logic, not just support/resistance lines.
🧾 Disclaimer:
This post is not a forecast, tip, or financial advice. It is purely an educational breakdown of price structure and market behavior based on my personal charting style. Feel free to ask your doubts or thoughts in the comments — let’s build clarity, not predictions.
Laurus Labs Limited - Breakout Setup, Move is ON...#LAURUSLABS trading above Resistance of 553
Next Resistance is at 699
Support is at 420
Here are previous charts:
Chart is self explanatory. Levels of breakout, possible up-moves (where stock may find resistances) and support (close below which, setup will be invalidated) are clearly defined.
Disclaimer: This is for demonstration and educational purpose only. This is not buying or selling recommendations. I am not SEBI registered. Please consult your financial advisor before taking any trade.

Styrenix Performance Materials Ltd - Breakout Setup, Move is ON.#STYRENIX trading above Resistance of 2485
Next Resistance is at 3295
Support is at 1675
Here are previous charts:
Chart is self explanatory. Levels of breakout, possible up-moves (where stock may find resistances) and support (close below which, setup will be invalidated) are clearly defined.
Disclaimer: This is for demonstration and educational purpose only. This is not buying or selling recommendations. I am not SEBI registered. Please consult your financial advisor before taking any trade.

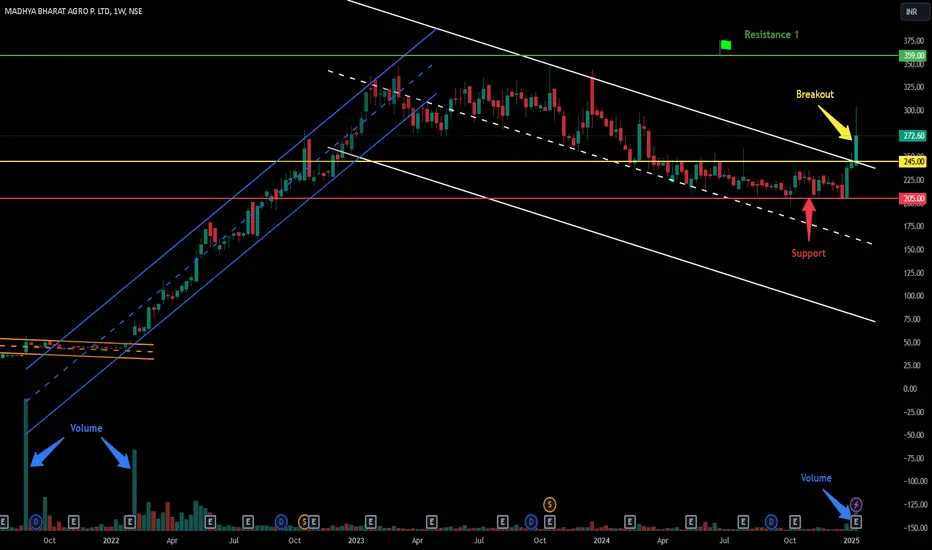
Breakout in Madhya Bharat Agro Products Ltd...Chart is self explanatory. Levels of breakout, possible up-moves (where stock may find resistances) and support (close below which, setup will be invalidated) are clearly defined.
Disclaimer: This is for demonstration and educational purpose only. This is not buying or selling recommendations. I am not SEBI registered. Please consult your financial advisor before taking any trade.
NDR Auto Components Ltd - Breakout Setup, Move is ON...#NDRAUTO trading above Resistance of 1476
Next Resistance is at 1938
Support is at 1094
Here are previous charts:
Chart is self explanatory. Levels of breakout, possible up-moves (where stock may find resistances) and support (close below which, setup will be invalidated) are clearly defined.
Disclaimer: This is for demonstration and educational purpose only. This is not buying or selling recommendations. I am not SEBI registered. Please consult your financial advisor before taking any trade.

Fiem Industries - Long Setup, Move is ON...#FIEMIND trading above Resistance of 2317
Next Resistance is at 3624
Support is at 1510
Here are previous charts:
Chart is self explanatory. Levels of breakout, possible up-moves (where stock may find resistances) and support (close below which, setup will be invalidated) are clearly defined.
Disclaimer: This is for demonstration and educational purpose only. This is not buying or selling recommendations. I am not SEBI registered. Please consult your financial advisor before taking any trade.

Welspun Corp - Breakout Setup, Move is ON...#WELCORP trading above Resistance of 750
Next Resistance is at 916
Support is at 614
Here are previous charts:
Chart is self explanatory. Levels of breakout, possible up-moves (where stock may find resistances) and support (close below which, setup will be invalidated) are clearly defined.
Disclaimer: This is for demonstration and educational purpose only. This is not buying or selling recommendations. I am not SEBI registered. Please consult your financial advisor before taking any trade.

Hitachi Energy (PowerIndia) - Breakout Setup, Move is ON...#POWERINDIA trading above Resistance of 12845
Next Resistance is at 17702
Support is at 9481
Here are previous charts:
Chart is self explanatory. Levels of breakout, possible up-moves (where stock may find resistances) and support (close below which, setup will be invalidated) are clearly defined.
Disclaimer: This is for demonstration and educational purpose only. This is not buying or selling recommendations. I am not SEBI registered. Please consult your financial advisor before taking any trade.

BSE Ltd - Breakout Setup, Move is ON...#BSE trading above Resistance of 4169
Next Resistance is at 6645
Support is at 2586
Here is previous chart:
Chart is self explanatory. Levels of breakout, possible up-moves (where stock may find resistances) and support (close below which, setup will be invalidated) are clearly defined.
Disclaimer: This is for demonstration and educational purpose only. This is not buying or selling recommendations. I am not SEBI registered. Please consult your financial advisor before taking any trade.

Mazagon Dock Shipbuilders - Breakout Setup, Move is ON...#MAZDOCK trading above Resistance of 4315
Next Resistance is at 6033
Support is at 2955
Here are previous charts:
Chart is self explanatory. Levels of breakout, possible up-moves (where stock may find resistances) and support (close below which, setup will be invalidated) are clearly defined.
Disclaimer: This is for demonstration and educational purpose only. This is not buying or selling recommendations. I am not SEBI registered. Please consult your financial advisor before taking any trade.

Ideaforge: Bullish Trend Ahead Amid India-Pakistan Tensions?Hey Everyone! Ideaforge just broke out from a double bottom chart Pattern Neckline , and it looks like a potential trend reversal is in motion. With the breakout confirmed by a volume surge , it seems that smart money might be entering, which is a positive sign for the stock. The technical setup is strong, but let’s dive deeper into the fundamentals to get a clearer picture.
While Ideaforge faces challenges like limited profitability in the past, its future outlook looks promising. The company holds a strong position in India’s drone industry, and 92% of its revenue comes from defense contracts, making it heavily reliant on government spending. Recent developments like drones being used in India-Pakistan border tensions have brought Ideaforge’s technology to the forefront, creating a positive sentiment shift in the market. This real-time application in national security could significantly boost its future growth, especially with the rise in demand for advanced drone technology in defense.
For entry, Stop loss and Target check Chart above!
Disclaimer: This analysis is for educational purposes only. Please consult a financial advisor before making investment decisions.
If you found this helpful, don’t forget to like, share, and drop your thoughts in the comments below!

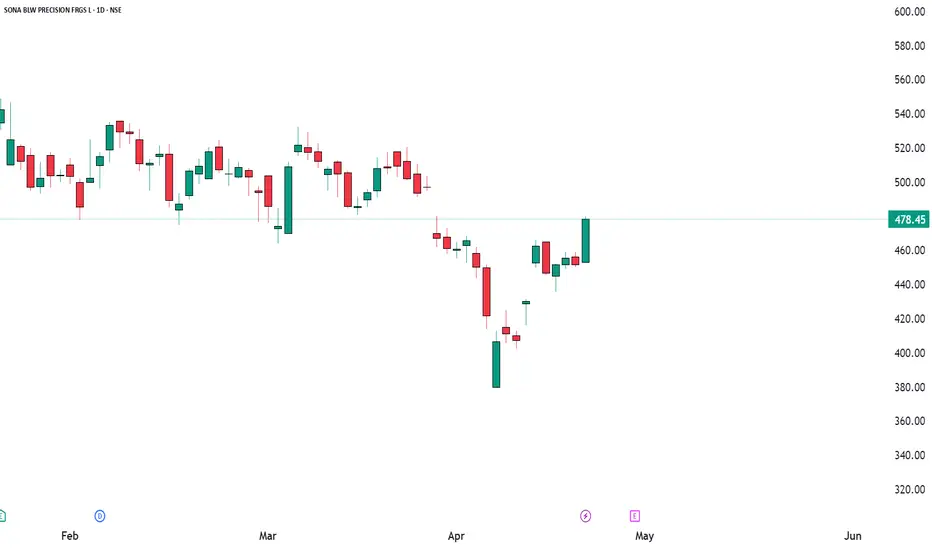
Bullish Breakout SetupSONACOMS (5.95%)
Bullish Setup Alert
We are seeing a strong bullish signal for SONACOMS, with multiple key indicators aligning for a potential breakout. A Bullish Marubozu candlestick has formed, indicating strong bullish momentum. Additionally, the RSI has broken out, signaling increasing buying strength. The SuperTrend and VWAP both confirm bullish sentiment, while the TTM Squeeze suggests a volatility breakout in the making.
Resistance Levels: 488-497-515
Support Levels: 461-444-434
Entry: @/above 479.85
Stop Loss: @/below 448.30
Volume Analysis: Volume has been robust, which could suggest accumulation and increased market interest.
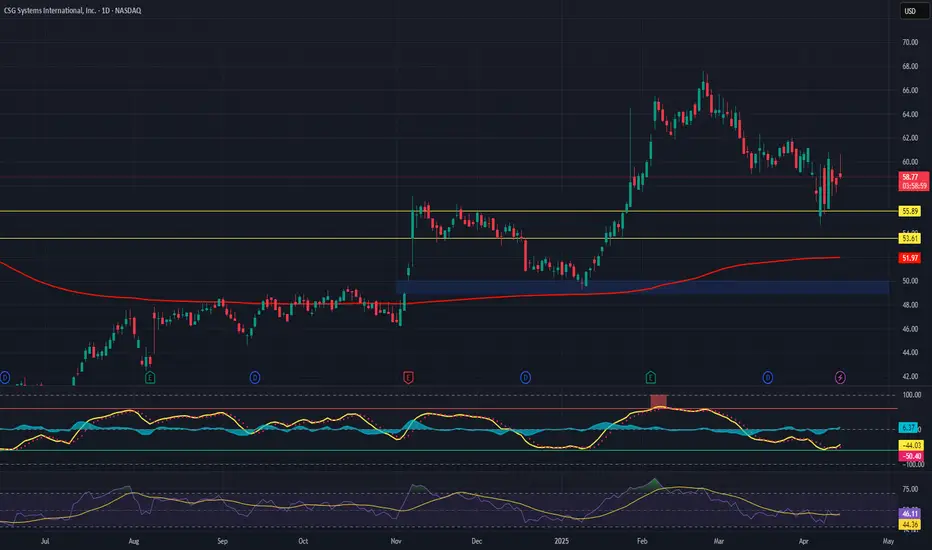
CSG Systems (CSGS) – Powering the Future of Digital Revenue & CXCompany Snapshot:
NASDAQ:CSGS is at the forefront of SaaS-driven digital transformation, providing robust business support systems (BSS) tailored for the communications, media, and tech sectors. Its solutions unify revenue management, customer experience (CX), and payment processing, helping enterprises scale smarter.
Key Catalysts:
Strategic Liquidity Boost 💰
Secured a $600M credit facility with favorable terms
Enhances M&A flexibility, innovation investments, and working capital optimization
Customer Experience (CX) Differentiator 📈
2025 CX Report highlights key growth levers:
AI-powered engagement
Hyper-personalization
Data-driven optimization
Unique selling point: CSG directly links CX improvements to financial ROI—a major decision-maker hook
Sticky Revenue Model 🔁
Enterprise-grade platforms built for long-term partnerships
High recurring revenue visibility with mission-critical BSS integrations
Telecom & Media Tailwinds 📡
As global carriers & media companies digitize operations, CSG is a go-to provider for scalable monetization & engagement
Investment Outlook:
✅ Bullish Above: $49.00–$50.00
🚀 Upside Target: $75.00–$76.00
📊 Growth Drivers: Digital BSS demand, CX monetization focus, improved financial firepower
📢 CSGS: Monetizing experiences, not just connections. #CSGS #SaaS #CustomerExperience