Weekly CT Breakout + 200EMA Flip | GALAXYSURF Structure📉 Main CT Line (Dotted White)
A well-defined counter-trendline finally gave way after weeks of price compression. The breakout was clean, with a strong bullish candle closing decisively above it.
📊 Volume Confirmation
Breakout candle posted a solid spike in volume — the highest weekly volume in months. 💥
📈 200 EMA Broken (Blue Line)
Price has also cleared the 200-week EMA, a key dynamic resistance, now potentially flipping to support. 📉
🟧 Higher Timeframe Supply (Orange Line) / ⚪ (White Lines)
The breakout candle has also stepped into a tight zone between Weekly + Monthly supply, marked by the orange line.
📌 As always, the chart tells the story. No predictions. No assumptions, just structure.
Stocks!

Styrenix Performance Materials Ltd - Breakout Setup, Move is ON.#STYRENIX trading above Resistance of 2485
Next Resistance is at 3295
Support is at 1675
Here are previous charts:
Chart is self explanatory. Levels of breakout, possible up-moves (where stock may find resistances) and support (close below which, setup will be invalidated) are clearly defined.
Disclaimer: This is for demonstration and educational purpose only. This is not buying or selling recommendations. I am not SEBI registered. Please consult your financial advisor before taking any trade.

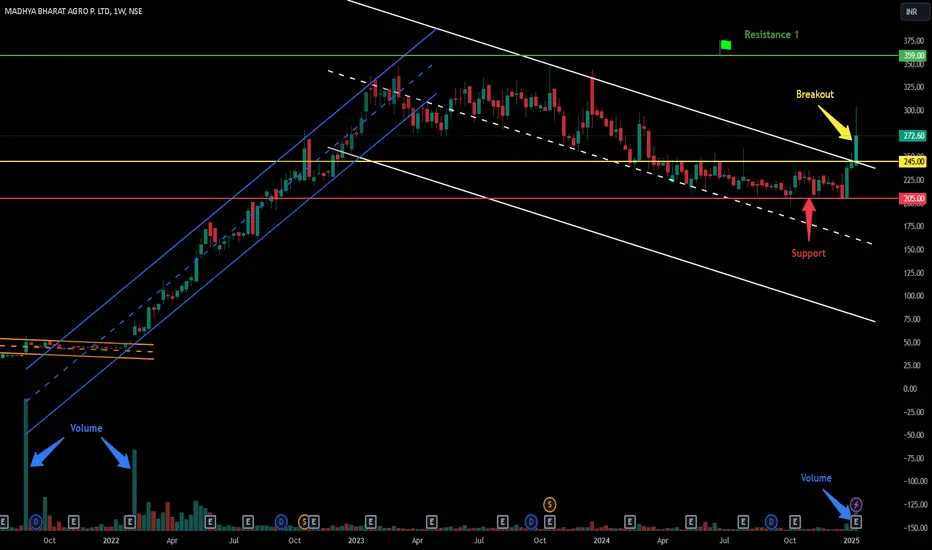
Breakout in Madhya Bharat Agro Products Ltd...Chart is self explanatory. Levels of breakout, possible up-moves (where stock may find resistances) and support (close below which, setup will be invalidated) are clearly defined.
Disclaimer: This is for demonstration and educational purpose only. This is not buying or selling recommendations. I am not SEBI registered. Please consult your financial advisor before taking any trade.
Nifty Bank Intraday levels(For Education Purpose)20.05.2025📉 Bearish (Sell) Setup:
Sell Below: ₹55,480 (confirmed breakdown)
Targets:
🎯 Target 1: ₹55,400
🎯 Target 2: ₹55,300
🎯 Target 3: ₹55,180 (if heavy selling continues)
Stop Loss: ₹55,580 (or ₹55,600 for conservative SL)
///📈 Bullish (Buy) Setup – Only if Reversal Happens:
Buy Above: ₹55,600 (strong reversal with volume & green candles)
Targets:
🎯 Target 1: ₹55,700
🎯 Target 2: ₹55,800
🎯 Target 3: ₹55,900
Stop Loss: ₹55,480

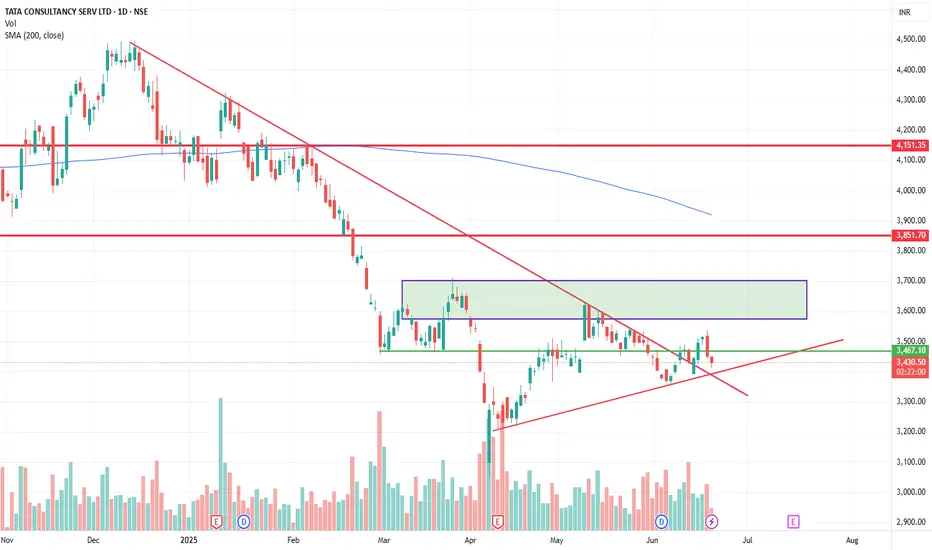
TCS Strong Support at ₹3360 | Breakout Above ₹3700ata Consultancy Services (TCS) is showing strong support near ₹3360 levels. A potential breakout will be confirmed if the price sustains above ₹3700.
Currently, the stock is facing key resistance zones between ₹3512 and ₹3525. A successful close above these levels may lead to strong bullish momentum.
📌 Key Levels:
Support: ₹3360
Resistance Zones: ₹3512 – ₹3525
Breakout Confirmation: Above ₹3700
Traders should watch these levels closely for directional cues. Volume confirmation and price action around resistance will be crucial.
#TCS #TCSshare #NSEStocks #StockAnalysis #BreakoutStocks #TradingViewIndia #TCSBreakout #IndianStocks #TechnicalAnalysis #SwingTrade
🔔 Disclaimer:
This analysis is for educational and informational purposes only. It is not a buy or sell recommendation. Please do your own research or consult a financial advisor before making any trading decisions. Trading and investing involve risk.
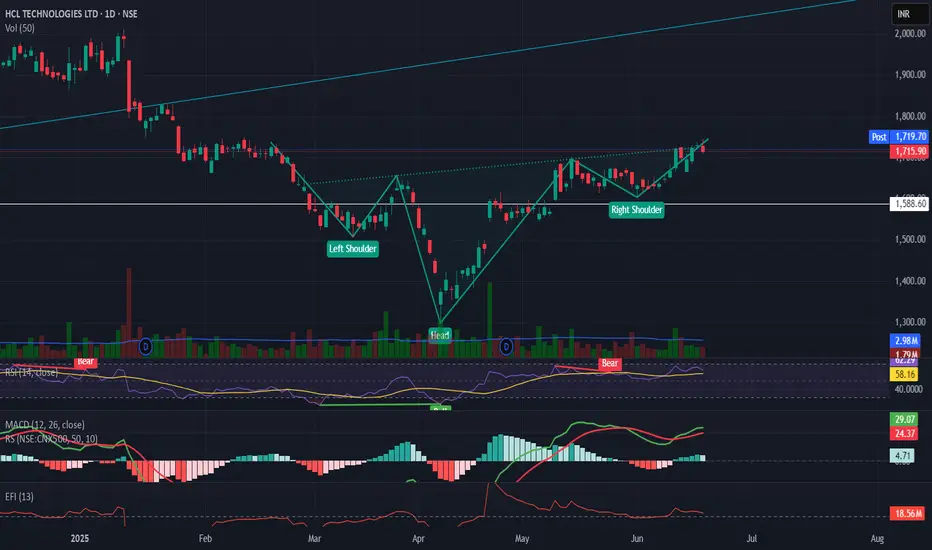
HclTech with inverse head and shoulders patternHclTech is showing six months long inverse head and shoulders pattern with major resistance at 1750.
RSI at 58
MACD is above its signal line and trending higher.
Efi Is above zero and is stable right now
target at 2140-2400 based on the pattern
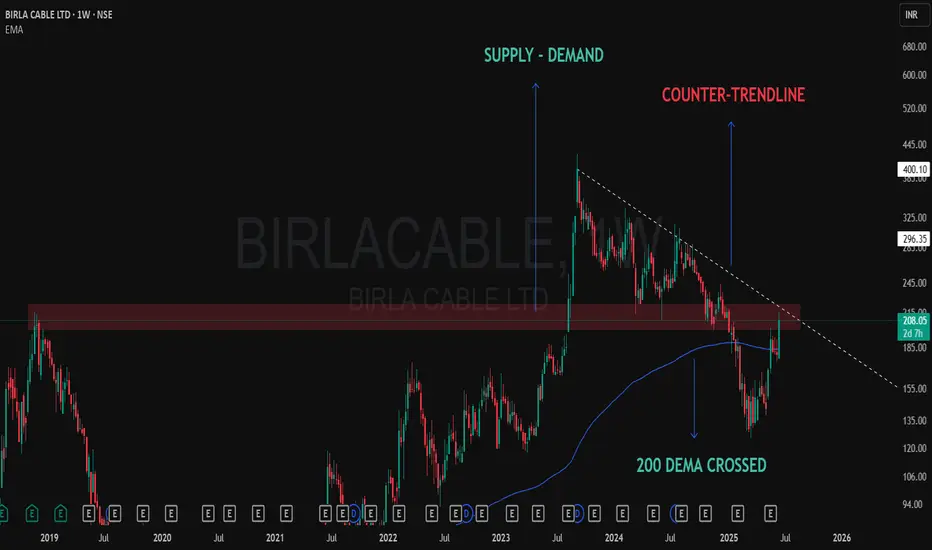
Technical Development on Weekly Chart – Birla Cable📈 BIRLA CABLE – Chart Talking Loud Now!
✅ 200 DEMA crossed
200 Dema was providing solid resistance and now taken out marked with blue line.
❌ At Counter-Trendline
Solid CT thrown from the top of the pattern, dotted white line shows that.
✅ Demand Zone Holding Strong
Clearly shown a solid supply zone which got converted into a Demand only after the Breakout some months back.
After months of consolidation and rejection from the same supply zone… price is now attacking with volume 🔥
🧠 “When structure aligns with emotionless patience, conviction follows.”
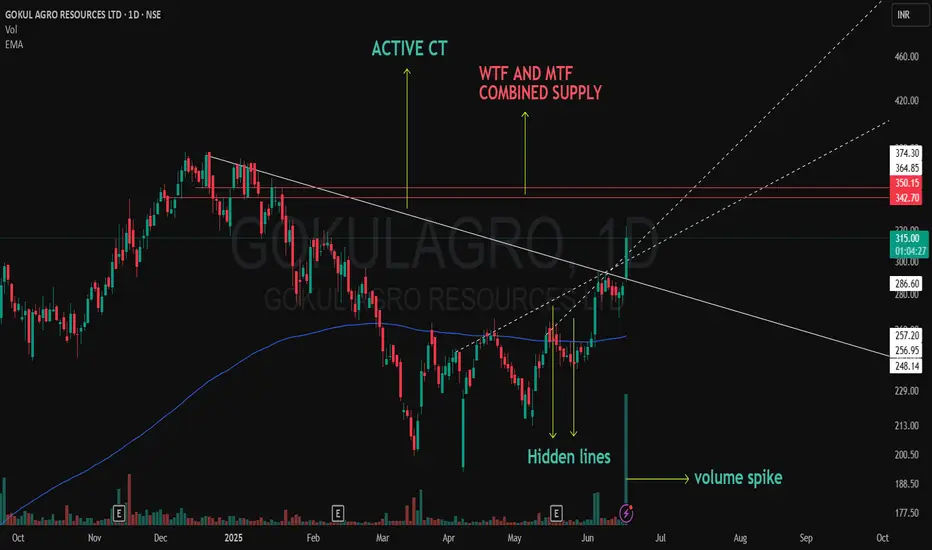
CT Breakout Live on GOKULAGRO! Supply Zone Just Ahead 📌 CT Breakout In Play | GOKULAGRO
A strong breakout just happened on the Daily chart of GOKULAGRO.
🟢 The Active CT (green) has been cleanly broken today with a strong bullish candle.
🟢 Multiple hidden resistances were also taken out during the breakout – marked in green as they’ve now turned into potential support.
🟢 A healthy volume spike confirms strong participation – not massive, but convincing enough to validate the move.
🔴 The next major supply lies just ahead – a combined Weekly + Monthly resistance zone (marked in red). This could act as a temporary pause or reversal zone if not cleared with momentum.
This is not a forecast or a buy/sell recommendation — just a structured observation of price action and context.
Watching how it behaves near the higher timeframe supply. Will it reject or absorb?
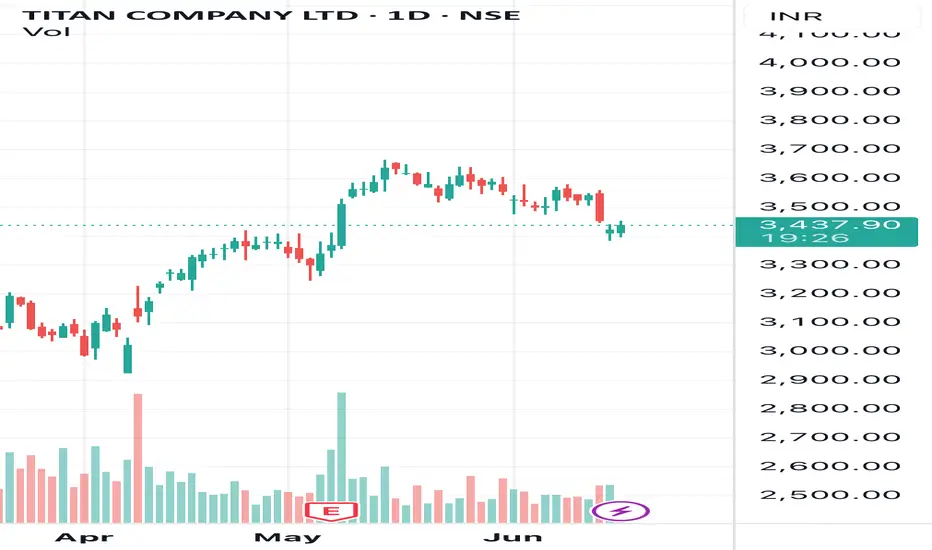
Technical Analysis (TITAN - Daily Chart):📊 Trend and Candle Pattern:
• The stock showed strong recovery between March and April.
• There was a bullish rally from April to May, reaching highs above 3600.
• After hitting resistance, it has seen a minor correction and is now trading around 3436.40.
🔴 Moving Average (Likely 200-DMA):
• The red line on the chart appears to be the 200-day moving average (DMA), which is currently at 3385.91.
• The current price is above the 200-DMA, indicating that the stock remains in a bullish zone.
• If the price falls below 3385, it may signal weakness or a trend reversal.
🧱 Support and Resistance:
• Immediate Support: 3385 (200 DMA)
• Major Support: Around 3300
• Resistance Zone: 3600–3650 (recent highs)
📈 Performance:
• The stock has shown a 5.80% gain, indicating positive momentum over the recent period.
⸻
📌 Conclusion:
• As long as the price remains above the 200-DMA (3385), the trend is bullish, and traders can consider a “buy on dips” strategy.
• A close below 3385 could trigger further downside.
• The current trend appears to be sideways to mildly bullish.
Note : not a buying or selling recommendation only for education purposes
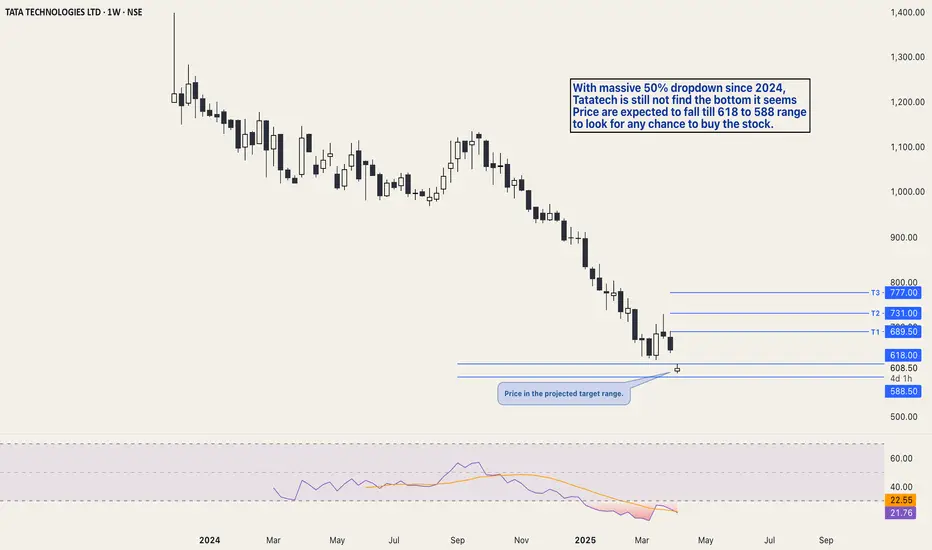
Tatatech analysis updates. Wait for buy.Price reached the projected downside target range.
Waiting for the price to test the lower range level i.e., 581 for any buying decision.
Price once bouncing from the support will target 689.50, 731 and 888 as upside targets.
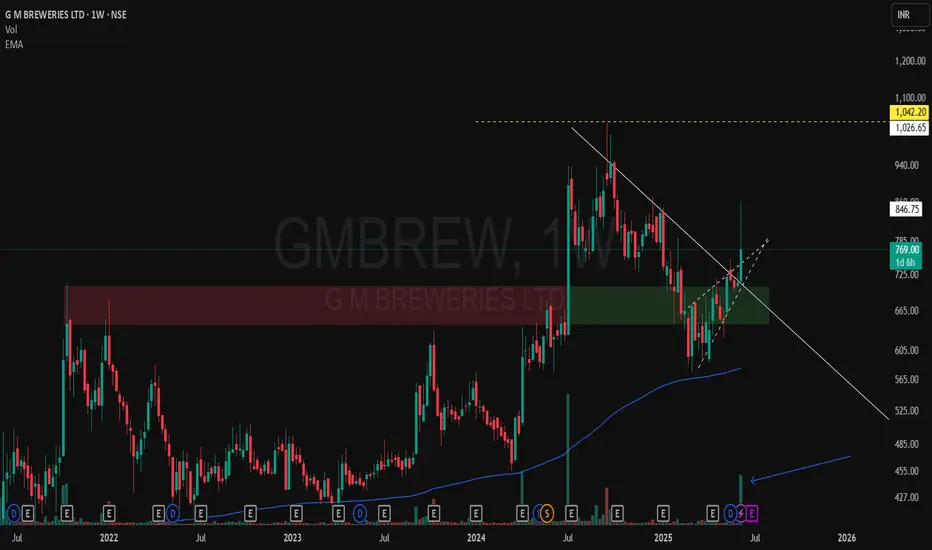
GM BREWERIES – A Classic CT Breakout with Strong Demand Flip🔍 A solid Weekly Time Frame (WTF) structure is visible here on GMBREW:
-The red-green zone highlights a classic supply turning into demand, supporting the structure.
-A clear Counter Trendline (CT) breakout (white line) is now visible, showing strength with increasing momentum.
-Notice the strong spike in volume – this breakout isn't silent. Participation has significantly picked up.
-Yellow line represents the MTF supply, which could act as the next area of interest.
-Price is currently showing a wick, so weekly closing behavior will be key from here.
-No predictions – just a technical snapshot. Structure, volume, and zones are aligning well here. Let’s see how it unfolds. 📊
Multi time frame charting explained in GEPILI make educational content videos for swing / positional trading

BEPL Breakout soonBEPL about to breakout with 16% profit in short term with triangle pattern and also 55 ema has crossed 8,13,21 ema which shows strong uptrend on moving average
Hold duration around 1-2 month
Entry - 117
Target -138
Stock has good fundamentals
So I suggest to buy BEPL Bhansali eng. Polymers LTD

Adani power breakoutAdani power short term profit up to 35%
Hold duration of Adani power 1-2 month
Buy around - 590
Target -750
Adani power fundamentals are strong and just gave a breakout, might be possible to give profit in under 10-15 days

Inside 2 Weekly Timeframe CT Breakouts With Strong VolumesPurely chart-based view. No bias. No advice. Just how I interpret these right now
I make educational content videos on Swing trading .

PURVAPURVA has given breakout of resistance after a consolidation.
Moving above 20ema. Now there is probability of an upside move.
✅ If you like my analysis, please follow me as a token of appreciation :)
in.tradingview.com/u/SatpalS/
📌 For learning and educational purposes only, not a recommendation. Please consult your financial advisor before investing.

NDR Auto Components Ltd - Breakout Setup, Move is ON...#NDRAUTO trading above Resistance of 1476
Next Resistance is at 1938
Support is at 1094
Here are previous charts:
Chart is self explanatory. Levels of breakout, possible up-moves (where stock may find resistances) and support (close below which, setup will be invalidated) are clearly defined.
Disclaimer: This is for demonstration and educational purpose only. This is not buying or selling recommendations. I am not SEBI registered. Please consult your financial advisor before taking any trade.

Fiem Industries - Long Setup, Move is ON...#FIEMIND trading above Resistance of 2317
Next Resistance is at 3624
Support is at 1510
Here are previous charts:
Chart is self explanatory. Levels of breakout, possible up-moves (where stock may find resistances) and support (close below which, setup will be invalidated) are clearly defined.
Disclaimer: This is for demonstration and educational purpose only. This is not buying or selling recommendations. I am not SEBI registered. Please consult your financial advisor before taking any trade.

4 Stocks. 4 Stories. Here's How I See Them Without Predictions..Purely chart-based view. No bias. No advice. Just how I interpret these right now
I make educational content videos on Swing trading .

Inside Bars After High Volume – CERA Setting Up Near Key CT📌 Timeframe: Weekly (WTF)
📌 Type: Technical Observation / Swing Structure
📌 Concept: Counter Trendline Breakout Setup
CERA is currently navigating a highly constructive zone from a swing trading lens. Here's what's developing technically:
🔹 Higher Low Formation:
The stock has established a higher low structure, with the white internal trendline offering visible support across recent weeks. Interestingly, this aligns perfectly with the 200-period EMA on the weekly timeframe, enhancing its significance as a dynamic support layer.
🔹 Volume Clues:
Two of the highest volume candles on the weekly chart have now been followed by inside bars, a potential sign of absorption or base building. This tightening within volume zones signals institutional interest and a possible buildup phase.
🔹 Supply Zone Identified:
An overhead supply (marked in orange)
🔹 EMA Context: The blue 200 EMA further reinforces the idea of Supportive price behavior around this line validates its role.
🔍 This post is for educational discussion only. No recommendation or forecast is implied. Please conduct your own due diligence.

Support Flips, Trendline Snaps — Weekly Chart Speaks!A counter-trendline breakout (white line) is underway on the Weekly Time Frame (WTF), supported by strong structural confluences:
🔹 Pattern size is substantial, with price consolidating for several months before breakout.
🔹 The yellow zone represents a prior support, which later broke down — now acting as a resistance-turned-breakout zone, a classic supply flip.
🔹 Recent breakout candle shows strength, emerging after taking support from the 200 DEMA, reinforcing the base.
🔹 MTF resistance (dashed yellow line) is marked — remains the next significant obstacle on higher timeframes.
No trading/investment advice. Purely educational .

Welspun Corp - Breakout Setup, Move is ON...#WELCORP trading above Resistance of 750
Next Resistance is at 916
Support is at 614
Here are previous charts:
Chart is self explanatory. Levels of breakout, possible up-moves (where stock may find resistances) and support (close below which, setup will be invalidated) are clearly defined.
Disclaimer: This is for demonstration and educational purpose only. This is not buying or selling recommendations. I am not SEBI registered. Please consult your financial advisor before taking any trade.

Hitachi Energy (PowerIndia) - Breakout Setup, Move is ON...#POWERINDIA trading above Resistance of 12845
Next Resistance is at 17702
Support is at 9481
Here are previous charts:
Chart is self explanatory. Levels of breakout, possible up-moves (where stock may find resistances) and support (close below which, setup will be invalidated) are clearly defined.
Disclaimer: This is for demonstration and educational purpose only. This is not buying or selling recommendations. I am not SEBI registered. Please consult your financial advisor before taking any trade.
