When to Buy the Dip & When to Stay Away!Hello Traders!
We’ve all heard the phrase “Buy the Dip” — but blindly following it can be a dangerous trap. Not every dip is a buying opportunity. Some are just the beginning of a deeper fall! So how do you know when to step in — and when to step aside?
Let’s decode smart dip buying vs. risky dip chasing so you can make better entries and protect your capital.
When to Buy the Dip
Uptrend Structure Intact:
Price is still forming higher highs and higher lows. The dip is just a healthy pullback.
Approaching Strong Support Zones:
Previous swing lows, demand zones, or trendlines are holding. Add confluence with Fibonacci or moving averages.
Volume Confirms the Bounce:
Look for decreasing volume during the dip and increasing volume on bounce or green candle formation.
No Negative News Trigger:
Dip is technical, not caused by bad news or earnings shocks. Sentiment is still positive.
When to Stay Away from the Dip
Trend Has Reversed:
If the market structure is broken and lower highs/lows are forming, it's not a dip — it's a downtrend.
Dip on Negative News or Fundamentals:
Sharp fall due to weak results, downgrades, or global cues? Better to wait for stabilization.
No Price Action Confirmation:
Don't buy just because it “looks cheap.” Wait for confirmation like bullish candles or reversals at key zones.
High Volatility & No Base Formation:
If price is free-falling without structure, it’s not a dip — it's a trap.
Rahul’s Tip
Every dip looks tempting — until it dips more! Wait for structure, confirmation, and signs of demand. Let the price prove itself before you commit.
Conclusion
Buying the dip is a powerful strategy — but only when used wisely. Combine trend analysis, support zones, price action, and volume to separate healthy pullbacks from risky crashes.
Do you buy the dip often? What’s your filter for safe entries? Let’s discuss below!
Stocks!

Eternal Sunshine of the Spotless MindHere you have Charles Thomas Munger, the permanent vice president of one of the most successful companies in the world, Berkshire Hathaway. He was not at the origins of this business, but it was Charles, together with Warren Buffett, who turned a dying enterprise into a star of the world stock market. It didn't take a Master's degree in Business Administration or incredible luck. As Mr. Munger said, to succeed you don't necessarily have to strive to be the smartest, you just have to be not stupid and avoid the standard ways of failure. He worked as a meteorologist, then a lawyer, and finally as someone we know well - an investor who inspired many to take a smart approach to business and their own lives.
“I don’t think you should become president or a billionaire because the odds are too great against you. It is much better to set achievable goals. I didn't set out to become rich, I set out to be independent. I just went a little overboard”, Charles joked. Wake up every morning, work hard, be disciplined and surprisingly, everything will work out very well. This commandment sounds a little archaic in times of rapid rise and easy money. However, for anyone who thinks years and decades ahead, it is difficult to come up with something better.
Speaking to students at his hometown University of Michigan, Mr. Munger said the most important decision you make in life is not your business career, but your marriage. It will do more good or bad for you than anything else. He attached such great importance to human relationships. This correlates strongly with a study of human happiness that has been ongoing for over 85 years under the auspices of Harvard University. The scientists' main conclusion was that everything we build (portfolios, businesses, strategies) is worthless if there is no person in our lives to whom we can say a simple “I'm here”. Or “Thank you”. Or “I love you”.
The healthiest and happiest in old age were not those subjects who earned the most. And those who have maintained good, trusting relationships. Marital. Friendly. Related. And in this light, Charles Munger's words about caution, moderation and common-sense sound quite different. It's not about money. It's about a life that can be lived with the feeling that you have enough. That you don't have to be a hero. That you can just be a reasonable person. Loving. Healthy. Calm.
Perhaps this is the main secret of Mr. Munger's success in the stock market? In the long run, the one who has already won achieves a positive result.
November 28th, 2023, was the last day of the cheerful Charlie's life. There were 34 days left until his 100th birthday.

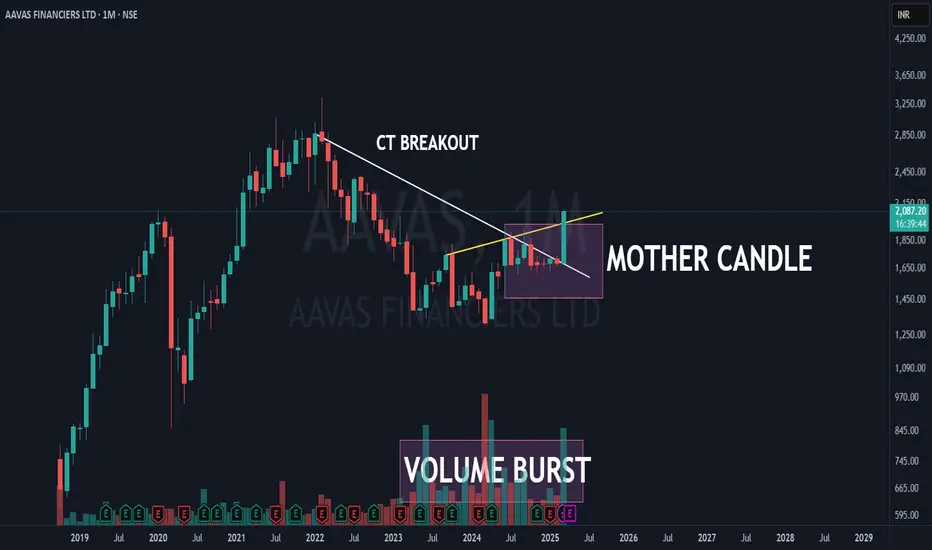
aavas financiers ltd | major monthly breakout! AAVAS is showing a strong bullish breakout on the monthly timeframe (MTF) with powerful confluence signals! Let’s break it down:
🔹 Counter Trendline (CT) Breakout ✅
Price has successfully broken the descending trendline, signaling a major trend shift.
🔹 Mother Candle Breakout ✅
The price has broken out of the mother candle's range, confirming strength.
🔹 Hidden Resistance Breach ✅
The yellow line marks a key resistance zone.
🔹 Volume Burst ✅
A significant volume spike confirms the breakout’s validity.
High participation = Strong conviction!
This is a highly bullish setup—will AAVAS continue its momentum? 📈👀
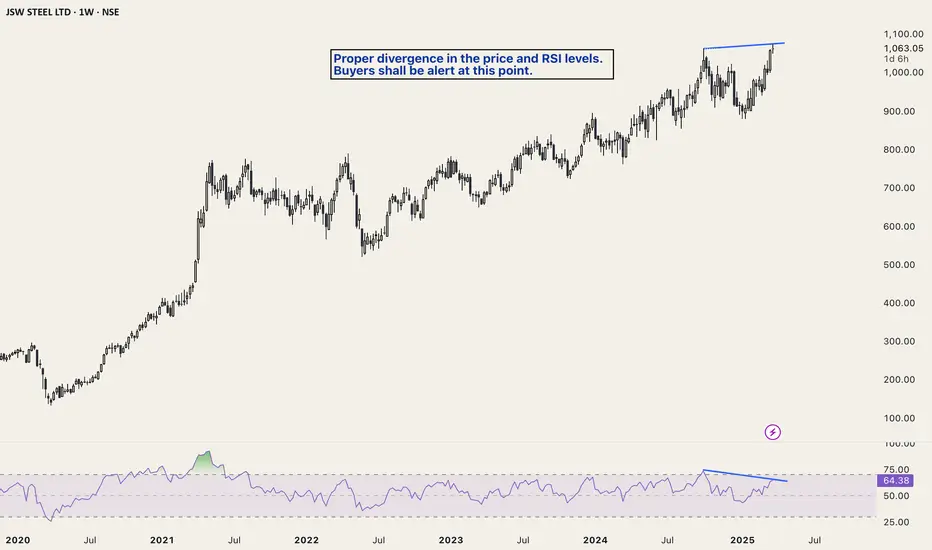
JSW STEEL: Diverging for fall?Proper divergence in the price and RSI levels.
Buyers shall be alert at this point.
Breakout shall be confirmed with the breakout of RSI divergence.
At this point, aggressive traders' tempting chance to short for an attractive R:R at this point.
If You Do This Before 9:15, You’ll Win More!Hello Traders!
The market opens at 9:15 AM, but real winners don’t wait until then. They prepare before the bell rings . Your success in trading depends not just on what you do during market hours, but what you do before the chaos begins . Let’s talk about the essential pre-market rituals that can help you trade with clarity, confidence, and consistency.
What You Should Do Before 9:15 AM
Check Global Market Sentiment:
US markets, SGX Nifty, crude oil, and other global cues can set the tone for the day.
Mark Key Levels:
Identify major support, resistance, trendlines, and zones from daily/hourly timeframes.
Create a Watchlist:
Focus on 3–5 high-potential stocks or indices. Don’t chase everything.
Have a Trade Plan Ready:
Note your entry levels, stop loss, and target. Pre-decide risk-reward before the bell.
Review News & Events:
Check for stock-specific news, results, RBI speeches, or macro events that may cause volatility.
Mentally Prepare:
Take 2 minutes to breathe, calm your mind, and remind yourself to follow your process.
Rahul’s Tip
Discipline starts before the market opens. If you prep well, you won’t panic. If you plan your trades, you won’t chase them.
Conclusion
The 15 minutes before the bell can shape your entire trading day. Winners prepare, amateurs react. Build your pre-market routine, and you’ll see the results in your P&L.
What’s your go-to pre-market routine? Share in the comments and let’s help each other improve!

When to Book Profits? Smart Exit Signs Every Trader Must Know!Hello Traders!
We all love the feeling of seeing profits on our screen, but the real challenge is knowing when to book them . Exiting too early means missing the big move. Exiting too late? You give back most of your gains. So today, let’s break down how to identify the perfect moment to book profits —whether you're trading intraday, swing, or positional.
Top Signs You Should Book Profits
Price Hits Key Resistance or Target Zone:
When your price hits a pre-defined target, Fibonacci level, or a strong resistance, it's a clear signal to book partial or full profits.
Momentum is Fading:
Look for weakening RSI, MACD crossovers, or decreasing volume. These are signs that buying strength is drying up.
Reversal Candlesticks Near Resistance:
Patterns like Bearish Engulfing, Shooting Star, or Evening Star near key levels indicate a possible reversal.
News/Event Risk Ahead:
If there's a major earnings release, policy decision, or macroeconomic event ahead, it’s safer to secure some profits.
Risk-Reward Becomes Unfavorable:
If the remaining upside is less than the downside risk, reduce your position and protect gains.
Trailing Stop Loss Triggered:
Using trailing stops helps you ride the trend while locking in profits. If it hits, exit without regret.
Rahul’s Tip
You don’t need to catch the exact top. Profit booked is better than profit on paper. Focus on consistency and discipline. Let the markets reward your process, not just your predictions.
Conclusion
Booking profits is an art backed by rules. Follow your strategy, monitor price action, and trust your system. That’s how you grow and protect your trading capital in the long run.
How do you decide when to exit your trades? Share your strategy in the comments below!

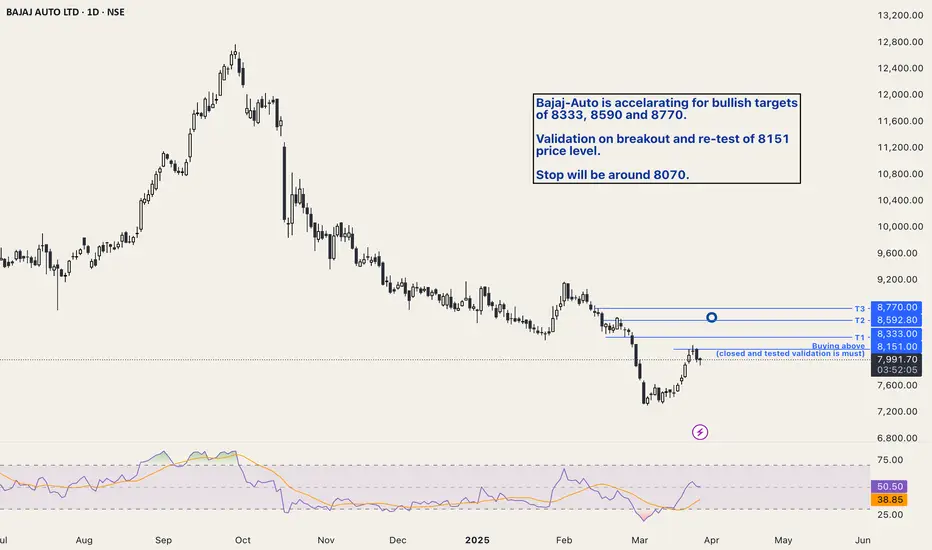
Bajaj-Auto bullish insightBajaj-Auto is accelerating for bullish targets
of 8333, 8590 and 8770.
Validation on breakout and re-test of 8151
price level.
The stop will be around 8070.
Stop Blaming the Market – Fix This First!Hello Traders!
Let’s be honest — we’ve all blamed the market after a losing trade.
But here’s the truth: The market is never wrong, our approach is. Before pointing fingers at volatility, news, or “manipulation,” take a step back and ask yourself: Am I following a system, or just gambling with hope?
Let’s explore what you really need to fix first — and how doing so can turn your trading around!
What to Fix Before Blaming the Market
Lack of a Trading Plan:
No entry/exit rules, no position sizing, no risk management = pure chaos. The market didn’t cause your loss—your lack of structure did.
Emotional Trading:
Taking revenge trades, FOMO entries, or holding losses in hope? That’s not the market—it’s your emotions taking over.
Overtrading Without Edge:
If you're trading every candle that moves without a tested edge, you're not trading — you're guessing.
Ignoring Risk Management:
Are you risking more than 1-2% per trade? Then one bad day can wipe out weeks of profits.
No Journaling or Self-Review:
If you’re not reviewing your past trades, you’ll keep repeating the same mistakes—blaming the market each time.
Rahul’s Tip
The market owes you nothing. It rewards discipline, patience, and consistency—not complaints. Fix your mindset and process, and the results will follow.
Conclusion
Before blaming the market again, look within.
Master yourself, and you’ll master the charts. It’s not about fighting the market—it’s about flowing with it, with a solid plan in hand.
Have you caught yourself blaming the market recently? What did you learn from it? Let’s share and grow in the comments!

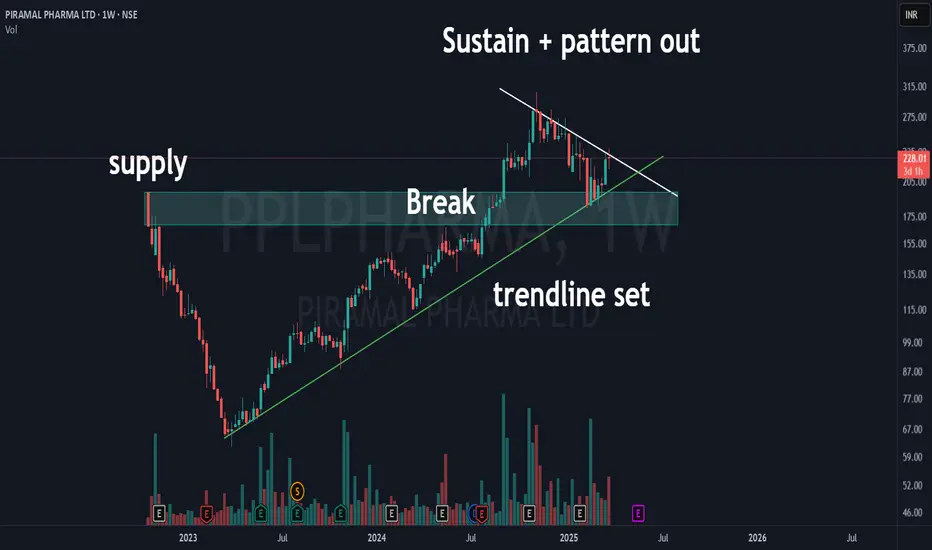
Piramal Pharma Yet to Breakout? | MotherBar + CT + Supply DemandPiramal Pharma Ltd is at a critical juncture! 🚀 The stock is consolidating within a counter trendline (CTL) while respecting the rising trendline support.
Key highlights:
✅ Mother Candle Formation - A large weekly candle acting as a range.
✅ Counter Trendline Breakout Watch - Price is still testing resistance, a breakout could trigger momentum.
✅ Demand Zone Support - The highlighted zone could act as a buying area.
✅ Volume Analysis - Increasing volumes hint at potential accumulation.
Will this breakout or get rejected? Let’s watch price action carefully! 📊🔥
HUDCO another fall?If that's an AB=CD pattern, still worse to come for HUDCO.
Bearish invalidation above 209-210 zone.
Analysing this stock for a sell/buy opportunity based on the breakout/rejection at this level of bearish invalidation.

2 Amazing swing trading ideas | Simple Price action I make educational content on swing / positional trading

Mother Candle & Counter Trendline Breakout | NAVA LTD📊 Technical Breakout Overview:
🔹 Mother Candle Breakout on the Weekly Timeframe – Strong bullish momentum!
🔹 Red Line (Weekly Counter Trendline) – Clean breakout, confirming trend reversal.
🔹 Yellow Dotted Line (MTF Resistance Counter Line) – Broken decisively.
🔹 Blue Line (MTF Major Resistance) – Next big target zone at ₹574.70.

Gearing up for HSCL✅ HSCL (Himadri Speciality Chemical Ltd) is showing strong bullish momentum, backed by rising demand for specialty chemicals and carbon materials.
📈 The company’s recent capacity expansions and focus on EV battery chemicals are driving growth prospects.
💡 Increasing global graphite demand and specialty carbon products are boosting revenue potential.
🚀 With improving financials and positive market sentiment, the stock is poised for an upward breakout.
🔥 Technicals indicate strong buying interest, making HSCL a potential candidate for price appreciation.
Max Financial Services Ltd – Trend Reversal in Play?🚀 Technical Analysis Breakdown:
The yellow trendline shows a long-term support, which has held well despite recent corrections.
The red downtrend line indicates a recent bearish phase, which has now been broken with a strong bullish candle.
The stock has bounced from the trendline support, showing signs of strength.
Above all the strong Pinbar candle looks amazing for a candle close .
🔎 Your Take? Do you see further upside or a pullback? Comment below! 👇

L&T Finance Weekly Breakout Setup 🔹 Green Line – The weekly support held strong, giving a perfect WTF (Where's The Floor) bounce.
🔹 Supply Zone (Blue Box) – This crucial resistance has now been broken out convincingly.
🔹 Red Line – A CT (Counter-Trendline) breakout with solid volume confirmation.
🔹 Bright Blue Line (MTF Resistance @ 185.82) – The toughest resistance, but it's far from the breakout zone, making this a high-RR trade idea.
🔥 Unique setup with multiple confluences! Volume spike adds conviction. Can bulls sustain the momentum? 🤔
📈 What’s your take on this breakout? Comment below! 👇

Pcbl Chemical – Supply Turned Demand, Higher Lows & Breakout Set📊 Stock: PCBL CHEMICAL LTD (NSE) – 1W Chart
📈 Bullish Structure Developing!
Supply turned into demand! Initially, the stock faced a strong supply zone, leading to a correction and consolidation.
Breakout & Sustained Move – After breaking out, the stock sustained above the breakout level for a long period, confirming demand at this zone.
Higher Lows Formation – A classic bullish structure is developing, indicating accumulation.
CT Base Breakout Approaching – The stock is breaking out of a contraction phase, which could lead to further upside.
Volume is a concern, but price action remains strong. A volume pickup could fuel a stronger move! 🚀
💬 What’s your take on this setup? Are you tracking PCBL? Drop your thoughts below! ⬇️

Godrej Agrovet – Breaking Out After 245 Days of Consolidation!📊 Stock: GODREJ AGROVET LTD (NSE) – 1W Chart
📈 Breakout Alert!
The stock has been consolidating for 245 days and is now breaking out with strong momentum!
Hidden trendlines (yellow) indicate potential future price movement zones.
Red trendline (CT) – Key resistance trendline that has been broken.
Green trendline – Strong support area that held firm.
Blue line marks the nearest all-time high based on multi-timeframe closing levels.
With strong market participation and volume, this breakout looks promising! 📊🚀
💬 What are your thoughts on this breakout? Are you tracking this stock? Comment below! ⬇️

The Ultimate Guide to Building Wealth Through Smart Investing!Hello Traders & Investors!
Are you wondering which investment method can build the largest corpus over the long term? With so many options— Stocks, ETFs, Mutual Funds, Gold, Bonds, Fixed Deposits, and even Options Writing, it’s crucial to know which one offers the best returns while managing risk effectively. Let’s dive into a detailed comparison to find the best strategy for long-term wealth creation!
1. Equity (Stocks) – The Ultimate Wealth Creator
Average Returns: 12-18% CAGR (historically for strong companies).
Why It’s Powerful: Equity investments compound over time and provide the highest long-term returns.
Best For: Investors who can handle volatility and have a long investment horizon.
Pros:
✔ Compounding Effect – Small investments grow into massive wealth over time.
✔ Beats Inflation – Equity is the best asset class for long-term wealth preservation.
Cons:
❌ High volatility in the short term.
❌ Requires research & patience.
2. ETFs & Mutual Funds – Passive Investing for Consistency
Average Returns: 10-15% CAGR (depending on market performance).
Why It’s Powerful: Diversification and professional management make it a safer alternative to direct stock investing.
Best For: Investors who want steady returns without active stock picking.
Pros:
✔ Low Risk Compared to Stocks – Reduces exposure to single-stock failures.
✔ Great for Long-Term Investors – Set & forget approach.
Cons:
❌ Returns are slightly lower than individual stocks.
❌ Expense ratios reduce overall profitability.
3. Gold – The Safe-Haven Asset
Average Returns: 8-12% CAGR (historically).
Why It’s Powerful: Gold holds value during market crashes and economic uncertainty.
Best For: Investors looking for portfolio diversification and inflation protection.
Pros:
✔ Hedge Against Inflation & Crashes.
✔ Highly Liquid – Easily Buy & Sell.
Cons:
❌ Lower long-term returns than stocks & ETFs.
❌ No compounding effect.
4. Bonds & Fixed Deposits – Safety but Low Growth
Average Returns: 6-8% CAGR (historically).
Why It’s Powerful: Provides stability and guaranteed returns, making it a good option for conservative investors.
Best For: Those seeking low-risk, fixed returns over time.
Pros:
✔ Principal Protection – No Market Risk.
✔ Fixed Income Source.
Cons:
❌ Returns barely beat inflation.
❌ Not ideal for wealth creation.
5. Option Writing – High Risk, High Reward
Average Returns: 15-30% CAGR (if done correctly).
Why It’s Powerful: Generates consistent income through premium collection.
Best For: Experienced traders who understand risk management and capital allocation.
Pros:
✔ Consistent Income Through Premiums.
✔ Can Profit in Any Market Condition.
Cons:
❌ High capital requirement.
❌ Risk of significant losses in volatile markets.
6. The Best Long-Term Investment Strategy?
For Maximum Growth: Equity (Stocks) + ETFs – The best for compounding wealth.
For Balanced Growth & Safety: Equity + ETFs + Gold – A mix of high returns & stability.
For Conservative Investors: ETFs + Bonds + Fixed Deposits – Low risk, but lower returns.
For Passive Income Seekers: Dividend Stocks + Bonds – Steady returns with income.
For Experienced Traders: Stocks + ETFs + Option Writing – High returns, requires skill.
Conclusion
There’s no single best investment, but if you want huge wealth creation, equities & ETFs outperform all other asset classes in the long run. Add gold & bonds for stability, and if experienced, option writing can generate extra income.
What’s your preferred investment strategy for long-term wealth creation? Let’s discuss below! 👇

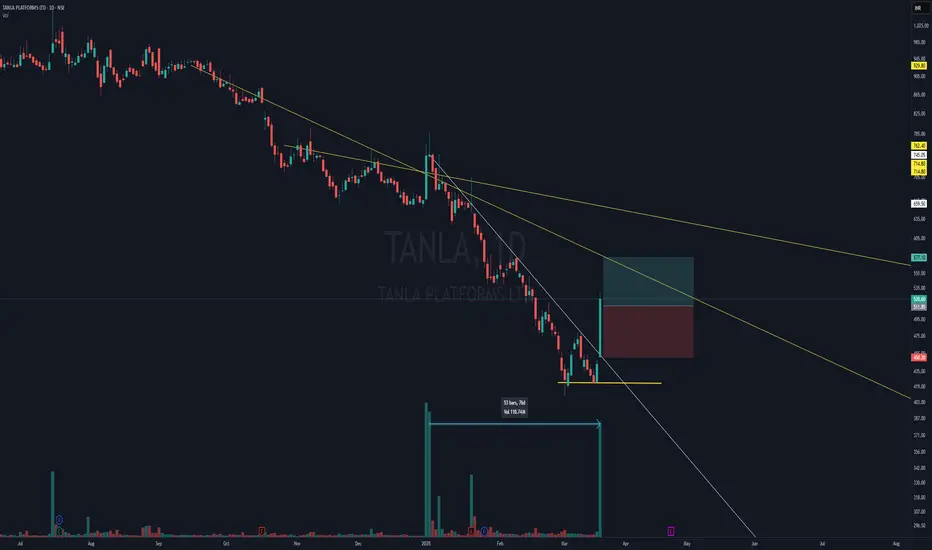
Tanla Platforms Swing -Double Bottom + CT Breakout with Volumes 📈 Technical Breakdown:
Double Bottom Formation at the base, signaling a potential reversal (though weak).
CT Breakout on the Daily Timeframe (DTF) (White Line).
Higher Timeframe (WTF) Resistance Zones marked by Yellow Lines, acting as hidden reactive resistances.
Massive Volume Spike Today – the highest in recent times, confirming strong breakout momentum.
🎯 Trade Idea:
A clean breakout from the CT with blasting volumes suggests a 1:1 trade opportunity at max for now.
Price might face resistance at higher levels, aligning with the yellow CT lines.
Need to watch if price sustains above the breakout zone for further continuation.
💬 Huge volumes—smart money stepping in or a trap? What’s your view? Let me know in the comments! 👇
How ETF Investing Can Make You Rich in the Long Term!Hello Traders & Investors!
Ever wondered how ETFs (Exchange-Traded Funds) can help you build massive wealth over time? Unlike stock picking, ETFs offer a simple, diversified, and low-cost way to grow your money steadily. If you’re looking for consistent returns without active trading, this post is for you! Let’s explore how ETF investing can create long-term financial success!
1. Why ETFs Are a Wealth-Building Machine?
Diversification with One Investment: ETFs hold multiple stocks, bonds, or assets, reducing the risk of a single stock crash.
Passive Investing with Compounding Growth: ETFs let your money grow effortlessly over years with minimal effort.
Lower Costs, Higher Returns: ETFs have lower expense ratios than mutual funds, saving you money over time.
Reinvested Dividends Boost Wealth: Many ETFs offer dividend reinvestment (DRIP), letting your gains compound.
Better Risk Management: Since ETFs spread investments across different sectors and asset classes, they offer stability in market downturns.
2. How to Choose the Right ETFs for Long-Term Wealth?
Broad Market ETFs (S&P 500, Nifty 50, Nasdaq-100): These track major indexes and provide steady growth over time.
Sector-Specific ETFs: If you believe in tech, healthcare, or energy, sector ETFs let you invest in growing industries.
Dividend ETFs for Passive Income: High-yield dividend ETFs provide stable income while growing your capital.
Bond & Gold ETFs for Safety: These add stability and protection during market volatility.
Low-Cost ETFs with High Liquidity: Look for ETFs with low expense ratios & high trading volume.
3. The Magic of Compounding with ETFs
Long-Term Investing Always Wins: ETFs benefit from compounding returns, where small gains snowball into large wealth.
Automate Your Investments: Use Systematic Investment Plans (SIP) to invest regularly without worrying about market timing.
Stay Invested in Market Crashes: The best gains happen when the market recovers. Never panic-sell!
Reinvest Dividends for Faster Growth: A small dividend can turn into massive returns over decades.
Think in Decades, Not Days: ETF investing is about long-term wealth accumulation, not short-term trading.
4. How to Start ETF Investing Today?
Open a Brokerage Account: Choose a platform that offers commission-free ETF investing.
Pick Your ETFs Based on Goals: Want growth? Choose ** index ETFs. Want safety? Go for bond ETFs.
Start Small & Increase Over Time: Even small investments grow exponentially with time.
Stay Consistent: Invest monthly or quarterly, regardless of market conditions.
Rebalance When Needed: Once a year, adjust your ETF holdings to stay aligned with your financial goals.
Conclusion
ETFs are a powerful, simple, and low-cost way to build long-term wealth. They offer diversification, passive income, and compound growth without the stress of stock picking. If you’re serious about financial freedom, ETF investing is one of the best paths to get there!
Are you investing in ETFs? Share your thoughts and favorite ETFs in the comments!👇

How to Spot the Market Bottom Before Everyone Else!Hello Traders!
Catching the exact market bottom feels like finding a needle in a haystack. Many traders jump in too early and get trapped in false recoveries, while others wait too long and miss the best buying opportunities. So, how do we know when the market has truly bottomed out? Let’s break it down!
1. Key Signs That a Market Bottom is Forming
Extreme Fear & Capitulation: When panic selling accelerates, weak hands get flushed out, and volume spikes—this is often the final shakeout before a reversal.
Divergence in Indicators: If price is making lower lows, but indicators like RSI, MACD, or OBV are making higher lows, this signals weakening selling pressure.
Institutional Buying (Smart Money Inflow): Look for large volume spikes at key support zones— institutions accumulate when retail traders panic sell.
VIX & Fear Index Peaking: A spike in volatility (VIX) and extreme fear readings indicate that the market is near capitulation.
Market Structure Shift: A higher high after a long downtrend signals a potential reversal and confirms a bottom formation.
2. Confirmation That the Bottom is In!
Breakout Above Key Resistance: If the price successfully reclaims a major resistance zone and holds above it, this confirms a shift in momentum.
Higher Highs & Higher Lows: A classic uptrend structure forms when the market starts making higher highs and higher lows.
Sector Rotation & Strength in Leading Stocks: Watch for growth stocks, tech, or financials gaining strength before the broader market recovers.
Positive Economic Triggers: Market bottoms often align with central bank policy shifts, interest rate pauses, or strong earnings reports.
Volume Confirmation: The strongest bottoms are confirmed by high buying volume on up days and low selling volume on down days.
3. Common Traps to Avoid When Predicting Market Bottoms
Catching the Falling Knife: Just because an asset has dropped significantly doesn’t mean it can’t go lower! Always wait for confirmation.
Fake Breakouts & Dead Cat Bounces: A sharp rally during a bear market doesn’t always mean the bottom is in. Watch for volume and trend confirmations.
Ignoring Macro Trends: If the Fed is still raising rates, inflation is high, or economic data is weak, the market could stay in a downtrend longer than expected.
Not Managing Risk Properly: Always use stop-losses, proper position sizing, and avoid going all-in at once!
4. How to Trade a Market Bottom Effectively
Look for Leading Stocks in Strong Sectors: The first stocks to recover often outperform the entire market.
Use Scaling Entries: Instead of buying all at once, scale in with multiple entries as confirmation builds.
Monitor Sentiment Indicators: Extreme bearishness in news and social media often signals a turning point.
Trade with Trend Confirmation: Wait for the first higher high & pullback retest to confirm an uptrend.
Have an Exit Plan: If the trend fails, cut losses quickly. If it works, let winners run!
Conclusion
Finding a market bottom isn’t about guessing—it’s about using data, price action, and sentiment indicators to confirm a shift in momentum. The best traders don’t try to buy the lowest price, they buy when the trend is shifting in their favor!
Do you think the market has bottomed out yet? Let’s discuss below!👇

Institute of Intermediation and 24 Coffee LoversWhen the market is efficient, the most efficient strategy will yield zero financial return for the investor. Therefore, firstly, it is necessary to strive to find inefficiencies in the market itself to apply a strategy that will be effective for it.
What creates market inefficiency? First, there are delays in disseminating important information about the company, such as the approval of a contract with a major customer or an accident at a plant. If current and potential investors do not receive this information immediately, the market becomes inefficient at the time such an event occurs. In other words, objective reality is not considered by market participants. This makes the stock price obsolete.
Secondly, the market becomes inefficient during periods of high volatility. I would describe it this way: when uncertainty hits everyone, emotions become the main force influencing prices. At such times, the market value of a company can change significantly within a single day. Investors have too many different assessments of what is happening to find the necessary balance. Volatility can be triggered by the bankruptcy of a systemically important company (for example, as happened with Lehman Brothers), the outbreak of military action, or a natural disaster.
Third, there is the massive action of large players in a limited market - a "bull in a china shop" situation. A great example is the story of 2021, when the Reddit community drove up the price of GameStop shares, forcing hedge funds to cover their short positions at sky-high prices.
Fourthly, these are ineffective strategies of the market participants themselves. On August 1, 2012, American stock market trading company Knight Capital caused abnormal volatility in more than 100 stocks by sending millions of orders to the exchange over a 45-minute period. For example, Wizzard Software Corporation shares rose from $3.50 to $14.76. This behavior was caused by a bug in the code that Knight Capital used for algorithmic trading.
The combination of these and other factors creates inefficiencies that are exploited by trained traders or investors to make a profit. However, there are market participants who receive their income in any market. They are above the fray and are engaged in supporting and developing the infrastructure itself.
In mathematics, there is a concept called a “zero-sum game”. This is any game where the sum of the possible gains is equal to the sum of the losses. For example, the derivatives market is a perfect embodiment of a zero-sum game. If someone makes a profit on a futures contract, he always has a partner with a similar loss. However, if you dive deeper, you will realize that this is a negative-sum game, since in addition to profit and loss, there are commissions that you pay to the infrastructure: brokers, exchanges, regulators, etc.
To understand the value of these market participants and that you are paying them well, imagine a modern world without them. There is only a company issuing shares and investors in them.
Such a company has its own software, and you connect to it via the Internet to buy or sell shares. The company offers you a quote for buying and selling shares ( bid-ask spread ). The asking price ( ask ) will be influenced by the company's desire to offer a price that will help it not lose control over the company, consider all expected income, dividends, etc. The purchase price ( bid ) will be influenced by the company's desire to preserve the cash received in the capital market, as well as to earn money on its own shares by offering a lower price. In general, in such a situation, you will most likely get a huge difference between the purchase and sale prices - a wide bid-ask spread .
Of course, the company understands that the wider the bid-ask spread , the less interest investors have in participating in such trading. Therefore, it would be advisable to allow investors to participate in the formation of quotes. In other words, a company can open its order book to anyone who wants to participate. Under such conditions, the bid-ask spread will be narrowed by bids from a wide range of investors.
As a result, we will get a situation where each company will have its own order book and its own software to connect to it. From a portfolio investor's perspective, this would be a real nightmare. In such a world, investing in not one, but several companies would require managing multiple applications and accounts for each company at the same time. This will create a demand from investors for one app and one account to manage investments in multiple companies. Such a request will also be supported by the company issuing the shares, as it will allow it to attract investors from other companies. This is where the broker comes in.
Now everything is much better and more convenient. Investors get the opportunity to invest in multiple companies through one account and one application, and companies get investors from each other. However, the stock market will still be segmented, as not all brokers will support cooperation with individual companies, for technical or other reasons. The market will be fragmented among many brokerage companies.
The logical solution would be to create another market participant that would have contracts with each of the companies and universal software for trading their shares. The only thing is that it will be brokers, not investors, who will connect to such a system. You may have already guessed that this is an exchange.
On the one hand, the exchange registers shares of companies, on the other hand, it provides access to trading them through brokers who are its members. Of course, the modern structure of the stock market is more complex: it involves clearing, depository companies, registrars of rights to shares, etc.* The formation of such institutions and their licensing is handled by a regulator, for example, the Securities and Exchange Commission in the United States ( SEC ). As a rule, the regulator is responsible for legislative initiatives in the field of the securities market, licensing of market participants, monitoring violations in the market and supporting its efficiency, protecting investors from unfair manipulation.
*Clearing services are activities to determine, control and fulfill obligations under transactions of financial market participants. Depository services - services for the storage of securities and the recording of rights to them.
Thus, by making a transaction on the exchange, we contribute to the maintenance of this necessary infrastructure. Despite the fashion for decentralization, it is still difficult to imagine how one can ensure speed, convenience and access to a wide range of assets due to the absence of an intermediary institution. The other side of the coin of this institution is infrastructure risk. You can show phenomenal results in the market, but if your broker goes bankrupt, all your efforts will be nullified.
Therefore, before choosing an intermediary, it is useful to conduct a mental survey of the person you will be dealing with. Below you will find different types of intermediaries, which I have arranged according to their distance from the central elements of the infrastructure (exchanges, clearing houses, depositories).
Prime broker
Exchange Membership: mandatory
License: mandatory
Acceptance and accounting of your funds/shares: mandatory
Order execution: mandatory
Clearing and depository services: mandatory
Marginal services: mandatory
Remuneration: commission income from trades, clearing, depository and margin services
This category includes well-known financial houses with history and high capitalization. They are easily verified through lists of exchange members, clearing and depository companies. They provide services not only to individuals, but also to banks, funds and next-level brokers.
Broker
Exchange membership: mandatory
License: mandatory
Acceptance and accounting of your funds/shares: mandatory
Order execution: mandatory
Clearing and depository services: on the prime broker side
Margin services: on the prime broker side or own
Remuneration: commission income from trades and margin services
This category includes intermediaries with a focus on order routing. They delegate participation in depository and clearing services to a prime broker. However, such brokers can also be easily verified in the lists of exchange members.
Sub-broker
Exchange Membership: no
License: mandatory
Acceptance and accounting of your funds/shares: mandatory
Order execution: on the broker or prime broker side
Clearing and depository services: on the prime broker side
Margin services: on the broker or prime broker side
Remuneration: commission income from trades
This category includes brokers who have a brokerage license in their country, but do not have membership in foreign exchanges. To provide trading services on these exchanges, they enter into agreements with brokers or prime brokers from another country. They can be easily verified by license on the website of the regulator of the country of registration.
Introducing Broker
Exchange Membership: no
License: optional, depending on the country of regulation
Acceptance and accounting of your funds / shares: no
Order execution: on the side of the sub-broker, broker or prime broker
Clearing and depository services: on the prime broker side
Margin services: on the broker or prime broker side
Remuneration: commission income for the attracted client and/or a share of the commissions paid by them
This category includes companies that are not members of the exchange. Their activities may not require a license, since they do not accept funds from clients, but only assist in opening an account with one of the top-tier brokers. This is a less transparent level, since such an intermediary cannot be verified through the exchange and regulator’s website (unless licensing is required). Therefore, if an intermediary of this level asks you to transfer some money to his account, most likely you are dealing with a fraudster.
All four categories of participants are typical for the stock market. Its advantage over the over-the-counter market is that you can always check the financial instrument on the exchange website, as well as those who provide services for its trading (membership - on the exchange website, license - on the regulator's website).
Pay attention to the country of origin of the broker's license. You will receive maximum protection in the country where you have citizenship. In case of any claims against the broker, communication with the regulator of another country may be difficult.
As for the over-the-counter market, this segment typically trades shares of small-cap companies (not listed on the exchange), complex derivatives and contracts for difference ( CFD ). This is a market where dealers rule, not brokers and exchanges. Unlike a broker, they sell you their open position, often with a lot of leverage. Therefore, trading with a dealer is a priori a more significant risk.
In conclusion, it should be noted that the institution of intermediation plays a key role in the development of the stock market. It arose as a natural need of its participants for concentration of supply and demand, greater speed and security of financial transactions. To get a feel for this, let me tell you a story.
New Amsterdam, 1640s
A warm wind from the Hudson brought the smell of salt and freshly cut wood. The damp logs of the palisade, dug into the ground along the northern boundary of the settlement, smelled of resin and new hopes. Here, on the edge of civilization, where Dutch colonists were reclaiming their homes and future fortunes from the wild forest, everything was built quickly, but with a view to lasting for centuries.
The wooden wall built around the northern border of the town was not only a defense against raids, but also a symbol. A symbol of the border between order and chaos, between the ambitions of European settlers and the freedom of these lands. Over the years, the fortification evolved into a real fortification: by 1653, Peter Stuyvesant, appointed governor of New Netherland by the West India Company, ordered the wall to be reinforced with a palisade. It was now twelve feet high, and armed sentries stood on guard towers.
But even the strongest walls do not last forever. Half a century after their construction, in 1685, a road was built along the powerful palisade. The street received a simple and logical name - Wall Street. It soon became a bustling commercial artery for the growing city. In 1699, when the English authorities had already established themselves here finally, the wall was dismantled. She disappeared, but Wall Street remained.
A century has passed
Now, at the end of the 18th century, there were no walls or guard towers on this street. Instead, a plane tree grew here - a large, spreading one, the only witness to the times when the Dutch still owned this city. Traders, dealers, and sea captains met under its shadow. Opposite the buttonwood tree stood the Tontine Coffee House, a place where not just respectable people gathered, but those who understood that money makes this world go round.
They exchanged securities right on the pavement, negotiated over a cup of steaming coffee, and discussed deals that could change someone's fate. Decisions were made quickly - a word, backed up by a handshake, was enough. It was a time when honor was worth more than gold.
But the world was changing. The volume of trades grew, and chaos demanded rules.
May 17, 1792
That spring day turned out to be decisive. Under the branches of an old buttonwood tree, 24 New York brokers gathered to start a new order. The paper they signed contained only two points: trades are made only between their own, without auctioneers, and the commission is fixed at 0.25%.
The document was short but historic. It was called the Buttonwood Agreement, after the tree under which it was signed.
Here, amid the smell of fresh coffee and ink, the New York Stock Exchange was born.
Soon, deals were being concluded under the new rules. The first papers to be traded were those of The Bank of New York , whose headquarters were just a few steps away at 1 Wall Street. Thus, under the shade of an old tree, the history of Wall Street began. A story that will one day change the whole world.
Buttonwood Agreement. A fresco by an unknown artist who adorns the walls of the New York Stock Exchange.

Bulls are coming back | Which type of setups to trade ?I make educational content videos for swing / positional trading
